How to View Performance Counters for MBAM 2.5
Use the following instructions to review the performance counters available for Microsoft BitLocker and Administration (MBAM) 2.5. These performance counters record the performance of requests that are sent to the following web services:
• StatusReportingService.svc – service that receives requests for compliance status
• CoreService.svc – service that receives requests for key recovery attempts
For descriptions of the available types of performance counters, see http://technet.microsoft.com/library/dn645361.aspx.
The MBAM performance counters are automatically registered by the Windows PowerShell Mbam-enable-webapplication cmdlet. You don’t need to enable the counters prior to viewing them. To view the MBAM performance counters, we recommend that you use the standard utility, Performance Monitor (perfmon), which comes with Windows.
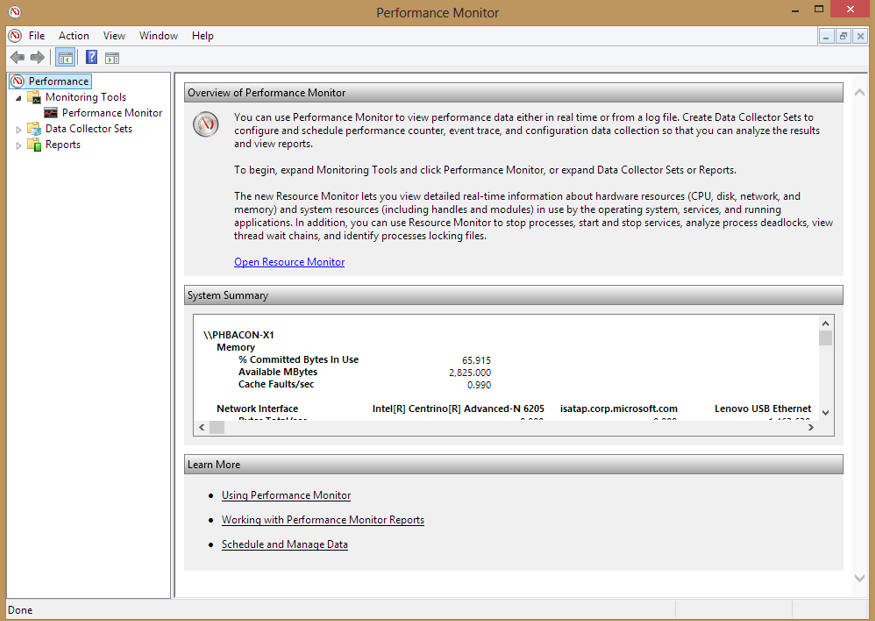
After you load perfmon, a page opens that looks similar to the following:
In the left pane, select Performance Monitor to switch to the graph view. A graph that is similar to the following is displayed.
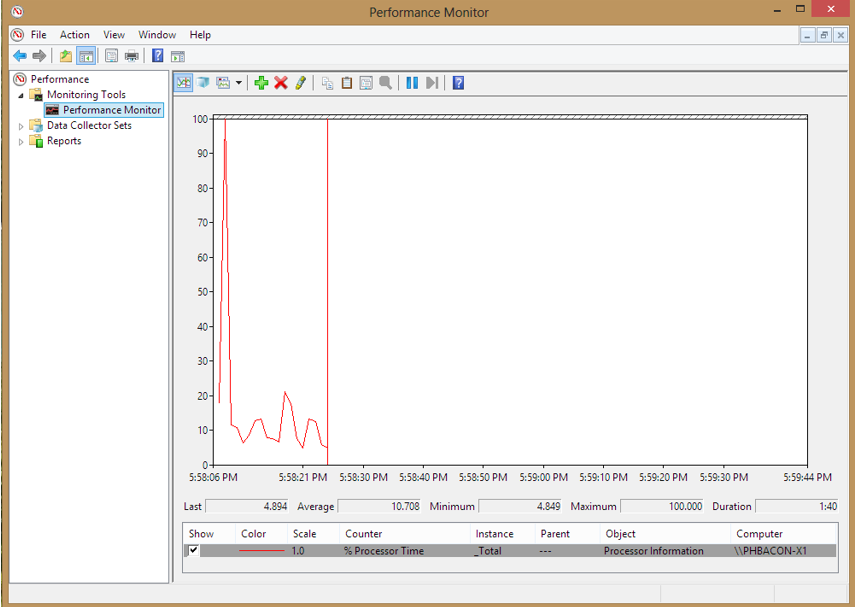
Click the green plus symbol shown in the toolbar.

Scroll through the list of categories to find the MBAM Compliance web service and MBAM KeyRecovery web service categories and expand them to see their available counters.
Notice that the Instances list contains specific instances that correspond to web service methods (functions), but only after the web service method has been called (that is, the instances are populated “on demand” as the web service requests are made). Therefore, you may need to wait until your MBAM client has reported key recovery or compliance status before you see an instance appear in this list.
Once you see the counter/instance combination(s) that you are interested in, select them and click OK (this dialog allows for multiple selections. The dialog can be opened again at any time, enabling you to add additional counter/instance combinations.
There are other non-MBAM performance counters that you may find useful, such as CPU and memory utilization, network throughput, a number of HTTP requests received, etc. Therefore, it is likely that you will add both MBAM-specific performance counters and other non-MBAM performance counters to your graph in any troubleshooting scenario.