Azure Machine Learning: Predictive Analytics
1.0 What is Machine Learning?
1.1 Definition
Machine learning simply detects patterns in large amount of data to predict what happens when you get new information.
"Machine Learning Algorithm falls into 2 broad categories: Supervised Learning and Unsupervised Learning" [Book: Machine Learning]
1.2 Supervised Learning
In supervised learning, a data set is provided to the algorithm which returns a “right answer” back.
The "algorithm uses a known data set (called the training data set) to make predictions. The training data set includes input data and response values. From this data set, the supervised learning algorithm seeks to build a model that can predict the response values for a new data set. Supervised learning includes two categories of algorithms, namely, regression and classification." [MathWorks: Supervised Learning]
1.2.1 Regression
Regression is used for continuous-response values, for example, predicting housing price based on its size.
From an existing data set, the algorithm plots a graph of houses and their respective price.
From this data set, we now want to predict the price of a house of 900 Square Feet.
The algorithm will detect the tendency of the data and present it in the form of a straight line to make a forecast as shown in the figure below.

1.2.2 Classification
Classification is used for categorical response values, where the data can be separated into specific “classes”. Classification is used to predict discreet value output ( i.e. 0/1, Yes/No).
Consider a case where we need to determine whether a cancer is malignant or no based on its size.
From existing data set, the algorithm compares the tumor size to the cancer type.
Now if we need to forecast whether a tumor of size Z is dangerous, the algorithm will determine this as in the figure below and will find that it’s not harmful.

1.3 Unsupervised learning
In unsupervised machine learning, the algorithm will try to identify structure in the data given a data set. "The most common unsupervised learning method is cluster analysis, which is used for exploratory data analysis to find hidden patterns or grouping in data." [MathWorks: Unsuoervised Learning]
Examples:
- Market Research:"Market researchers use cluster analysis to partition the general population of consumers into market segments and to better understand the relationships between different groups of consumers/potential customers, and for use in market segmentation, product positioning, new product development and selecting test markets." [Wikipedia]
- Social Network Analysis:Clustering may be used to recognize communities within large groups of people." [Wikipedia]
- Crime Analysis Cluster analysis can be used to identify areas where there are greater incidences of particular types of crime. By identifying these distinct areas or "hot spots" where a similar crime has happened over a period of time, it is possible to manage law enforcement resources more effectively."[Wikipedia]
2.0 Introducing Azure Machine Language (Azure ML)
Azure ML is Microsoft Cloud solution to perform predictive analytics. "Traditionally this requires complex software and high performing computers which are not accessible to everybody. By using the powers of cloud computing, Azure ML provides a fully-managed solution for predictive analytics which is accessible to a much broader audience. Predicting future outcomes is now attainable." [MS Azure: Machine Learning]
2.1 Creating an Azure ML Workspace
To start using Azure ML, you first need to create a workspace by following the steps below:
Go to your azure account and navigate to machine learning. You may also get a free trial account here.
Go to Machine Learning and click on new > Machine Learning > Quick Create, fill in the required information and hit Create!

2.2 Accessing Azure ML Studio
To access Azure ML Studio, go to https://studio.azureml.net/Home/ and sign in with your live ID.
3.0 Overview of Azure ML Studio
AML studio is a browser based workbench to author predictive analytics solutions. AML studio has 7 sections as described below.

4.0 Working with Experiments
For this experiment we shall use a fictitious loan data set and will try to predict whether someone will be able to repay his loan based on past data. The data set is as follows:

4.1 Adding a new data set
To upload a new data set, go to, Experiments > New > Data set > from local file

4.2 Creating a new Experiment
To create a new Experiment, click on new > Experiment

4.2.1 Working with data sets.
Clicking on new experiment, will bring you on a new canvas where you can add all elements needed for your experiment.
From here, you may drag objects from the left pane and place on the canvas.
From the saved Data set tab, you may browse both some sample data sets and also the data sets you uploaded.
For the next example, drag the file loan_hist.csv that we just uploaded and place it on the canvas.

Once you select your data set, you may view the contents on the data set by clicking on visualize.

4.2.2 Split the data
The next step is to split the data into "test" and "training".
Select the split object on the lift and drag it on the screen. Next, we need to specify which percentage of the data will be used and training and which percentage as test.
Test data will be used to evaluate the accuracy of the trained data.

4.2.3 Train model
The train model is where the “learning” occurs. It takes 2 inputs, the data set and an algorithm.
Since we need to answer a “two class question”, which falls under classification, we shall use a classification algorithm.

Next step is to configure the train model, to determine which fields to "predict."
To do so, click on the train model and click on "launch column selector" on the right to select the required field.
In our case, we need to predict the field "Loan Paid?"

4.2.4 Score & Evaluate Model
"We'll use the scoring data that was separated out by the Split module to score our trained models. We can then compare the results of the two models to see which generated better results." [MS Azure]
The score model takes 2 input parameters, the train model and the test data.
"To evaluate the two scoring results we'll use the Evaluate Model module." [MS Azure]
The evaluate model can take up to two score models as input parameter for comparison.

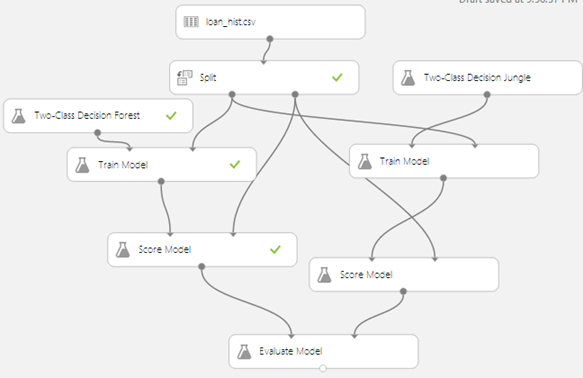
4.2.5 Adding another algorithm
If we want to use more algorithms for making comparison, we may add more algorithms. Below are the steps how to add another algorithm to our experiment.
a. You may copy and paste the existing train and score model.
b. Remove the algorithm connector from the copied train model.
c. Add a new predictive algorithm to the new train model.
d. Connect the new score model to the existing Evaluate model.

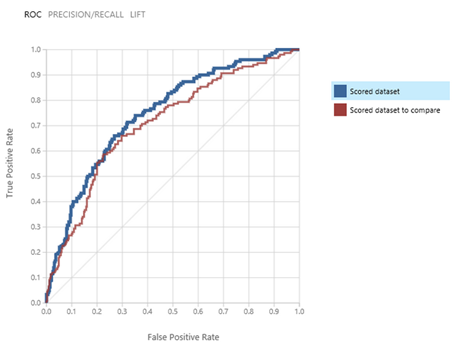
4.2.6 Running and evaluating the results.
Hit Run. Once completed, click on the output port of the evaluate model and click visualize.
Source: [MS Azure]
"The Evaluate Model module produces a pair of curves and metrics that allow you to compare the results of the two scored models. You can view the results as Receiver Operator Characteristic (ROC) curves, Precision/Recall curves, or Lift curves. Additional data displayed includes a confusion matrix, cumulative AUC values, and other metrics. You can change the threshold value by moving the slider left or right and see how it affects the set of metrics." [MS Azure]
"By examining these values you can decide which model is closest to giving you the results you're looking for. You can go back and iterate on your experiment by changing values in the different models". [MS Azure]
5.0 Publishing and create web service
Once we know which algorithm to use, we can now put the experiment to production and create a web service so that we can allow applications to connect and parse data to it.
Below are the steps to deploy a new web service for our experiment.
a. Right click on the model we need and click save as Trained Model

b. Create a new model for publishing.
c. Add the Data Source, Train Model and Score Model. Also, add a missing value scrubber, to replace all missing value from the data set.

d. Define the input and output ports of the score model.

e. Run the experiment and hit publish web service

The web service is now created.
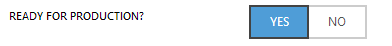
To place it into production, Go to the web service, click on settings and set it as ready for production.
6.0 Testing and consuming the web service.
6.1 Testing
On the web service page, click on the “Test” link as shown below.
Fill in the form with the test values and click OK.

Let’s run the same test with someone with lower income and higher Loan amount.

6.2 Consuming the web service from a client application.
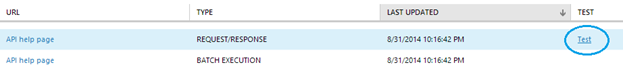
Azure ML generates sample codes to consume your service from C#, R and Python.
To view the codes click on “API help page” from the services page.

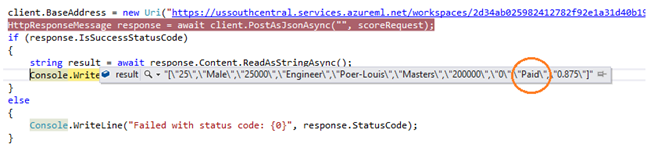
The following changes need to be made to the C# Project.
a Replace the API key with your key

b. Key in the required parameters

c. Run and verify the outcome
Azure ML Free Trial
Azure ML is now available to test free of charge without a subscription or credit card – all you need to get going is a Microsoft account! Click here to get started now!
Even if you do not have any Microsoft account, that is also okay. Going here you can excess guest workspace which is free and valid for 8 hours.
See Also
Another important place to find an extensive amount of Cortana Intelligence Suite related articles is the TechNet Wiki itself. The best entry point is Cortana Intelligence Suite Resources on the TechNet Wiki.