Power BI - Building Relationships Between Tables When Each Has Duplicate, Non-Common Values in Columns
PowerPivot and Power BI Desktop only allow the creation of relationships between tables when one of columns forming the relationship does not have duplicate values. For example, given the following two CSV files:
color1.csv
Color,Value
Red,20
Green,30
Blue,40
Red,10
Green,50
Blue,20
color2.csv
Color,Data
Black,777
Blue,555
Yellow,444
Black,999
Blue,222
Yellow,888
If we import these CSV files into PowerPivot or Power BI Desktop as tables "color1" and "color2", we cannot build a relationship between them based upon "Color" because each contains duplicate "Color" rows. Furthermore, the problem is compounded by the fact that each table contains "Color" values that are not in common with the other.
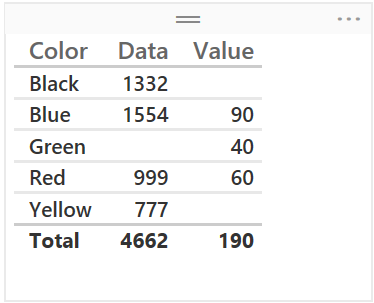
In order to relate these two tables to one another, what we need is a third table with all distinct colors from both tables "color1" and "color2". We could call this table "ColorMaster" and relate this table to both "color1" and "color2" tables based upon the "Color" column. In designing visualizations, we would select the "Color" column from "ColorMaster" and then whatever columns were desired from our other, related tables.
The process for creating this solution is the same for both Power BI Desktop and Excel Power Query:
First, create a query to "color1.csv". After connecting to the file, choose to Edit the query and only import the "Color" column by removing all other columns. Save and load this query as "ColorMaster1".
Next, create a second query to "color2.csv". After connecting to the file, choose to Edit the query and again only import the "Color" column by removing all other columns. Add an "Append Query" step and choose as the append table, "ColorMaster1". Select the "Color" column and add a "Remove Duplicates" step. Save and load this query as "ColorMaster"
Now, you have a single table with all of the distinct "Color" values from both files. By relating this table to the two other tables, you can craft visualizations based upon your category (in this case "Color") that displays data from both tables.*
NOTE: It is critical that the columns in both queries be identical, otherwise the Append Query step will append the queries but create two columns, the first with the data from the current query and the second with the data from the appended query.*