SharePoint Server: How to build a custom report for lists, libraries or sites
Introduction
This article describes how to build a custom report for SharePoint on-premises. The article is referring to the Pages library of a site and building a report to show often the pages are read or edited. The combination of data available in the Usage and Reporting service application, the content database and the pages library is used to build this report. This can only be done on a SharePoint Server i.e. on-premises environment.
Requirements
- SharePoint 2013 server with SQL Server Reporting Service setup and configured.
- Access to the SharePoint 2013 databases on the SQL 2012.
- Access to the pages library.
- Report Builder 3.0.
Setting the scene
We need to build a report to see how often pages are being read and updated. The report should contain the user's names when they accessed it and how long did they spend there. The steps provided here can be done for a list, library a combination of the two or the entire site itself.
Closer look at the data
As mentioned in the introduction, it is a combination of the Usage and reporting service database, the content database and the pages library that are used to build the report.
Usage and Health Data Collection Service Application
As shown below, you will need to have the Usage and Health Data Collection Service Application already setup in your farm.

In this service app, you need to enable usage and data collection as shown below. Once this service app is configured you will need to let it run for an in order to collect some data.

In addition, you will also need the following event options selected.

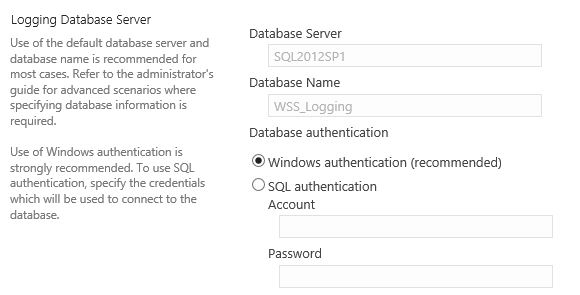
Finally, you will need to make note of the back-end database where all the data is being stored. In this environment the database name is WSS_Logging.
Site collection's content database
You will need to know which content database is storing the data of your site collection. To find out the database name you can go to Central Administration (CA), Application Management and selected View all site collections.

As you can see below, this web application has two site collections and each of them have their own content database. The site collection is using 'WSS_LM_Content' database.

The Pages library
Below is a screenshot of the Pages library for which the report is being built. We will also be using data from this library in the report.

Below is a video which walks you through the three separate locations where data will be pulled to build this report.
Building the report
This section describes how data connections, datasets and finally the table with all the expressions are built.
Data connections
Three separate data connections have been built and stored in a Data Connection library. You can refer to my 'SharePoint 2013: How to Set Up, Configure and Test SQL 2012 SP1 SSRS with SharePoint 2013 SP1' TechNet Wiki article on how to build the data connections.

Datasets
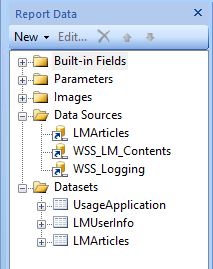
Report Builder 3.0 is used to build this report. Three separate data sets have been built and there connected using Lookup expression to build this report. Let's take a closer look at the datasets.
UsageApplication
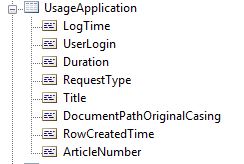
Usage application dataset has been built using the WSS_Logging database. Below is a screenshot of all the fields.
ArticleNumber is a calculated field that have been built specifically to create a successful Lookup expression in the table.
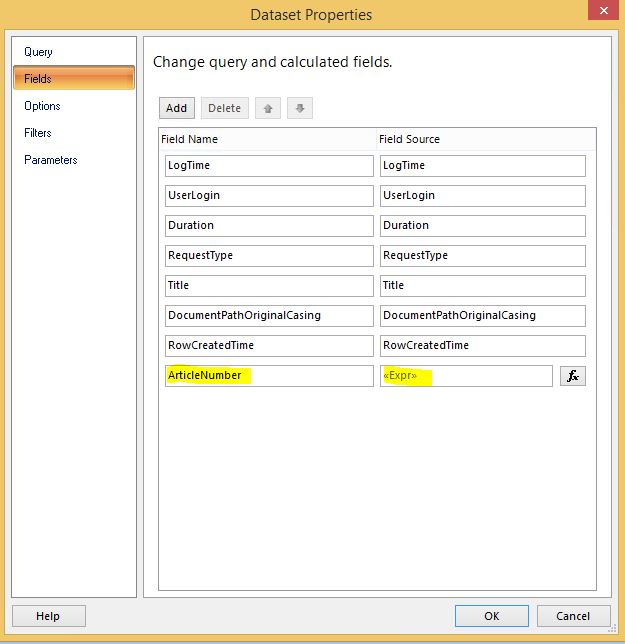
Here is a screenshot of the value used. As you can see we are replacing the '/Pages/' with BLANK

SharePoint's Usage and Health collection database already have a builtin view called RequestUsage. This is the database that is used to build the Usage Application dataset. In addition, there are several filters that have been applied to drill down to the main content needed for the report. In this scenario, we need only the LM site and the Pages library hence filters for both are added. We are also filtering out other accounts such as service accounts which we do not need in our report. It is with this filtering mechanism that you can build reports for only a list, library a combination of the two or the entire site itself.
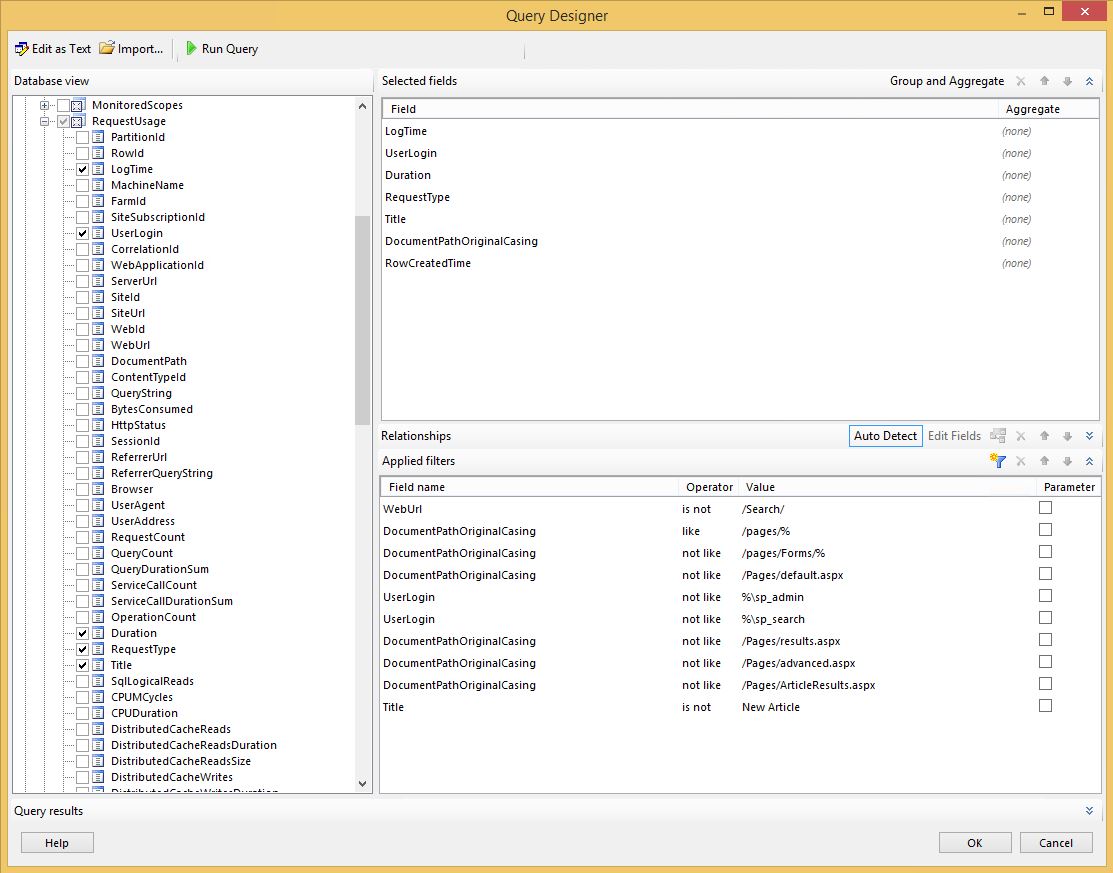
This dataset only provides the user login hence the need to connect to the content database to get the full username. Below is a screen shot that shows the usernames when the query is run. As you can see the entire login name is provided.

LMUserInfo
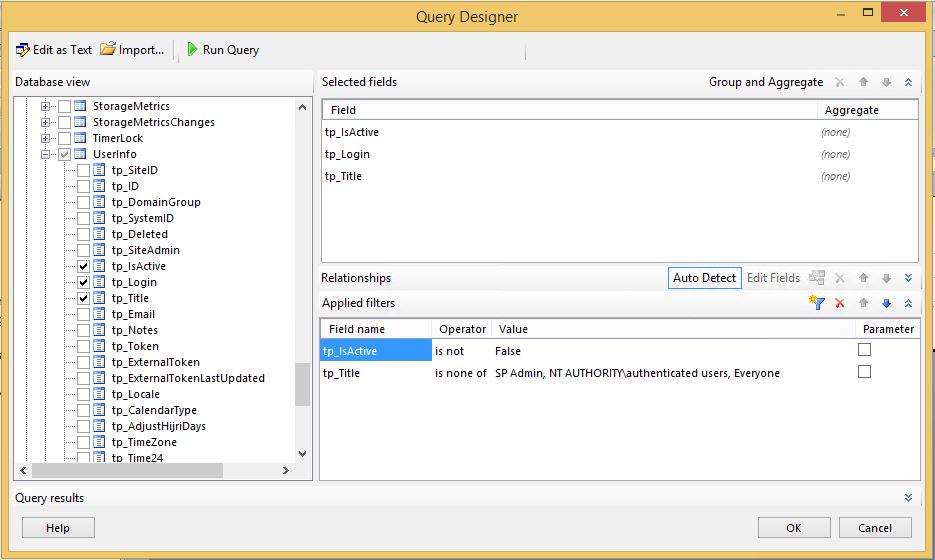
The LMUserInfo dataset is built using the WSS_LM_Content database which is the content database for this site collection. In this dataset, we are using the UserInfo database which has the login and the full name of all the user who have logged into this site collection. Below is a screenshot of all the fields that are selected.
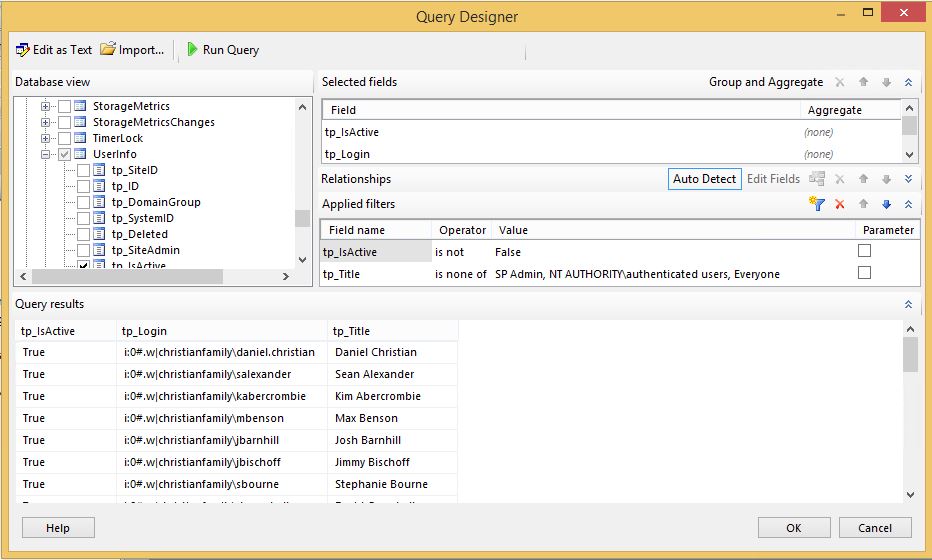
As you can see below, when the query is run we see the login name and the full name. We will be creating a Lookup to match the UserApplication database's login names to this dataset to get the correct full name.
LMArticles
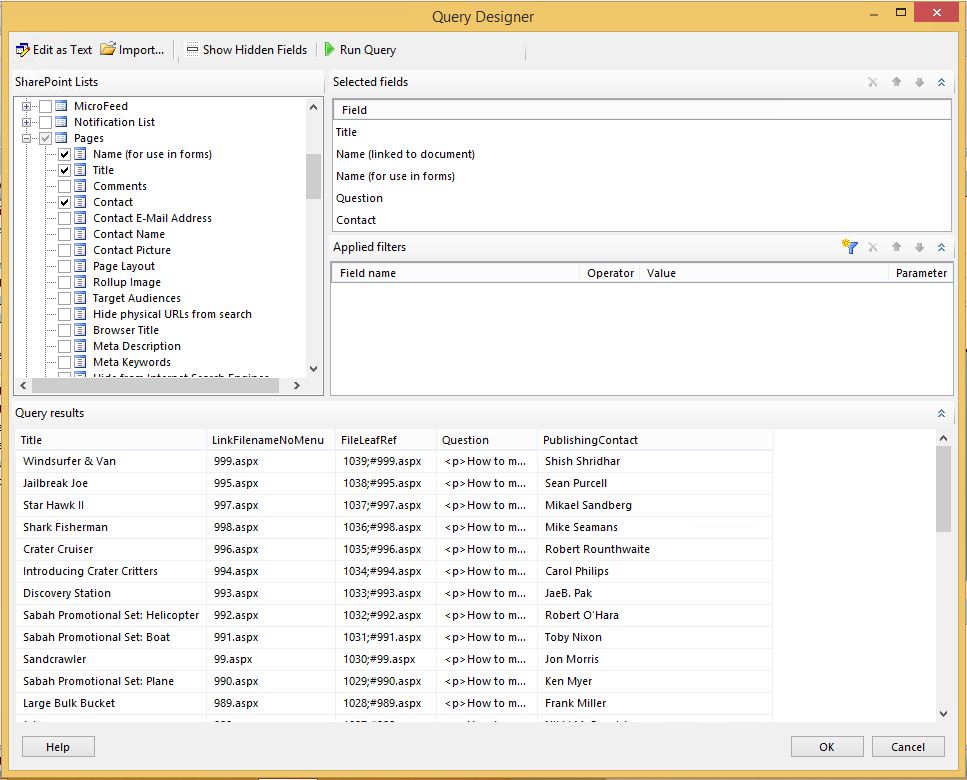
The LMArticles dataset is built using the Pages library. This dataset is required to get the Title of the pages.
We will take the page names from the LinkFileNameNoMenu column to do a Lookup from the ArticleNumber field in the UsageApplication dataset.
Below is a video which walks you through the three datasets will be pulled to build this report.
Building the table
Now that all the datasets have been built we will create a table with expressions to get the required information.
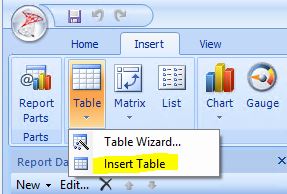
The rows and columns have been created using the Insert Table shown below.
A total of 7 columns have been added which are listed below
- Log Time
- User Login
- User Name
- Request Type
- Duration
- Article Number &
- Title

Log Time and Article Number
Log Time and Article Number columns are added as is without any changes made.
User Login
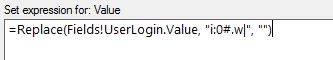
The formatting of the User Login column has been changed such that the 'i:0#.w|' pre-fix has been removed. Below is a screenshot of the expression
User Name
The UsageApplication dataset uses the WSS_Logging database which only records the user login names. Hence to get the entire username we have to build an expression to get the username from the LMUserInfo database i.e. the WSS_LM_Contents database.
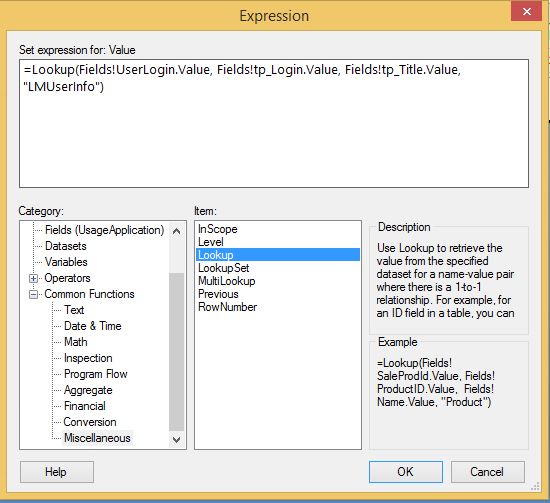
The data value for this column is found using Lookup in an expression shown below. We have used Lookup to retrieve the tp_Title from the LMUserInfo dataset by comparing the UserLogin column from the UsageApplication dataset and the tp_login column from the LMUserInfo dataset.
Request Type
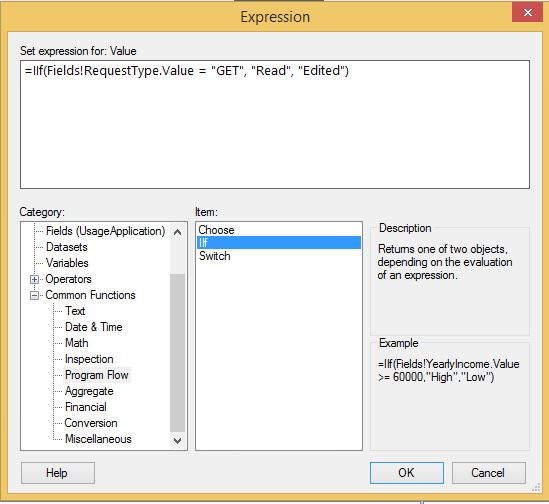
The GET and POST are the default values, however, to make it user-friendly the GET is replaced with Read and the POST is replaced with Edited. IIF is used to make these changes using the expression as shown below
Duration
The duration is calculated in seconds using the expressions shown below. This can be changed to other formats that match your requirements.

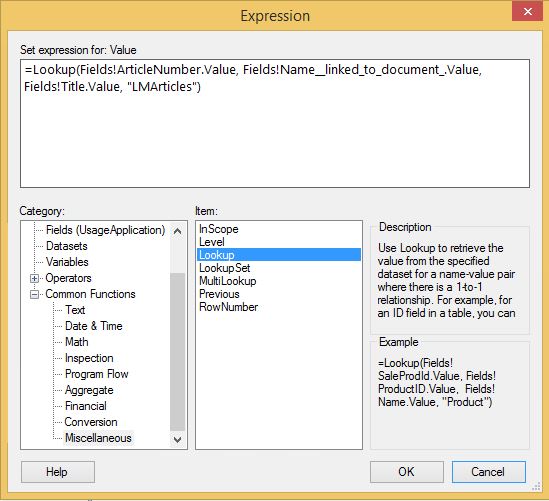
Title
Finally, the UsageApplication dataset uses the WSS_Logging database which only records the page number values . Hence to get the title we have to build an expression to get the title from the Pages library i.e. the LMArticles dataset.
The data value for this column is found using Lookup in an expression shown below. We have used Lookup to retrieve the Title from the LMArticles dataset by comparing the ArticleNumber column from the UsageApplication dataset and the Name_Linked_to_document column from the LMArticles dataset. As a reminder, the ArticleNumber is a function calculated column we created in the UsageApplication dataset.
Below is a video which walks you through the table and all the columns described above. The video also shows how certain parameter options were applied using Report Builder 3.0 to get the desired information.
Conclusion
SharePoint Server already has the 'Popularity and Search Reports' function OOB available in Site Collection Administration, however, if you do need a detailed report which provides time stamps and usernames then building a report as described in the article is an option. In this scenario Report Builder 3.0 has been used, however, you can use other reporting tools which includes Excel as well.