Generate Power BI Business Intelligence Reports using SharePoint Online List
Introduction
Power BI is a cloud based service that provides data visualization options based on the source data. Using Power BI we can create dashboards based on the data. In order to create reports using Power BI make sure that you have a Power BI account. If you don’t have an account you can sign up for it here. You can either work with Power BI online or download the Power BI Desktop version from here.

In this article we will go ahead with the desktop version. Once downloaded and installed, spin up Power BI Desktop.

This will open up the desktop version of Power BI.

Get Started
Power BI is flexible enough to work with multiple data sources. In this article we will see how to create reports using SharePoint Online list as the data source. Click on ‘Get Data’ option to select the data source.

Connect to SharePoint
All the supported data sources from which we can create reports will be listed down as separate tabs. In this blog we will see how to report against SharePoint Online list. From Online Services tab, select SharePoint Online List and click on ‘Connect’.

Specify the location of the SharePoint online list and click on OK.

It will ask for SharePoint Online authentication.

Click on ‘Sign In’.

It will give us the option to sign in to Office 365 subscription. Specify Email/Phone and password.

Click on Sign In.

We will be trying to connect to the below list ‘Product Sales’ in SharePoint Online from Power BI.

It contains the product sales details of manufactured cars.

Power BI is has now connected to SharePoint Online and will list out all the available lists. Select the ‘Product Sales’ list.

Click on OK. This will load the Product sales records into Power BI Desktop.

We can see the list of all columns in the fields pane.

Format the Imported Data
From the table tab, delete the unwanted columns.

Now we have to change the data type of the remaining fields.
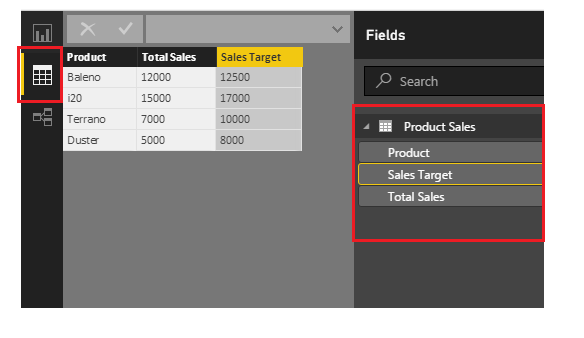
Click on Data type. By default it is set as text.

Change it to Whole Number.

Click on Yes to complete the change in data type.

Do this for all the fields.

Generate Business Intelligence Reports
Now go back to the report tab.

Here we can use the different visualization options varying from pie chart to bar graph to other visualization options.

Let’s select the Bar graph option.

Select the check box against all the fields.
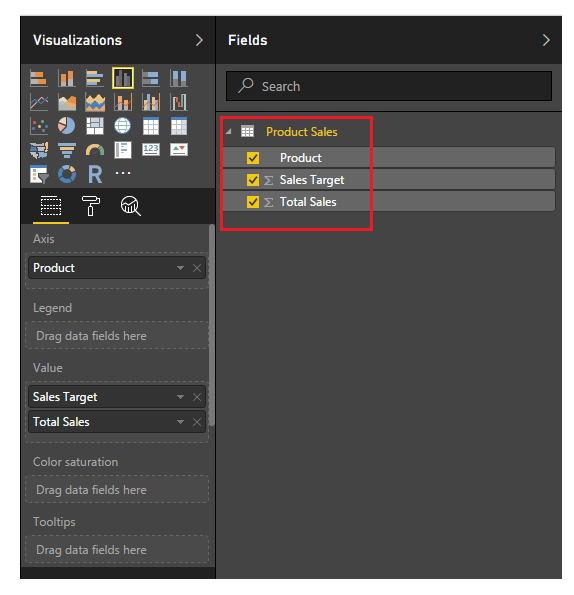
They will be automatically added to the value field in the visualization section.

This will populate the bar graph with the values in the SharePoint list field. We can apply custom styling to the reports and assign color to the bars. We can also apply legends and apply customization to the plot area.

Publish Power BI report Online
Finally once the report is completed we can publish it to online Power BI service.

Ensure that you have an account in Power BI and Select My Workspace.
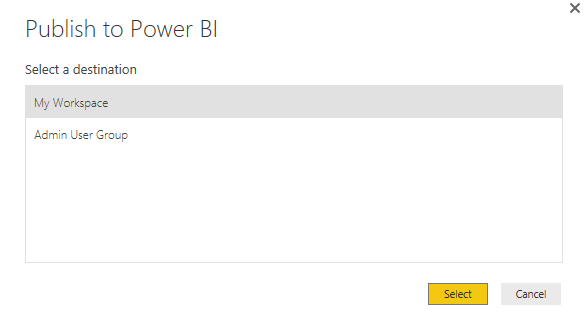
This will start the publishing of the report to Power BI.

Publishing has completed with a success message.

Now let’s head over to the PowerBI site. The SharePoint online report has become available in the reports section.

Summary
Thus we saw how to create Power BI reports using SharePoint Online list as the data source.
See Also
This article can also be viewed from the below link :
Other Languages
The article is available in other languages:
Wygeneruj raport Power BI przy użyciu listy SharePointa Online (pl-PL)
Power BI Business Intelligence-Berichte mit SharePoint Online-Liste (de-DE)