Options For Monitoring Transactional Replication in SQL Server
Introduction:
Monitoring SQL Server transactional replication for latency can sometimes be tedious, especially if w e don’t have a third-party tool that automatically monitors and sends alerts when the latency exceeds a specified threshold. Though there are few out-of-the-box options available but each one of them has its own pros and cons. It is now in the interest of the organization to choose which one is right for them in the sense that which takes very little to no manual intervention and is pretty much self-resolving. In this article, we will look briefly at some of the possible monitoring solutions that quickly come to our mind when dealing with transactional replication along with their pros and cons.
Just an FYI, as the title reads, this article talks about transactional replication in particular and there is no mention of merge or any other replication type.
Option 1: Replication Monitor GUI:
This is one of the basic ways to monitor replication of any type. It is simply the GUI that pops up when we right-click the publication and select “launch replication monitor” in SSMS. We don’t have to RDP into the publisher or subscriber to be able to pull up the replication monitor user interface, our locally installed SSMS will do. Though it provides a graphical representation of the replication latency information, it uses up resources and puts some load on the server being monitored due to frequent automatic refreshes. By default, the main replication window and all its tabs refresh every 5 seconds which is too frequent for a critical and busy server. Automatic refreshes do not trigger the refresh of the cache; it displays the most recent version of the data from the cache. Also, the automatic refreshes can be disabled or tweaked using the publisher settings.
As per Books Online, all the queries the replication monitor executes under the covers are cached and refreshed periodically. The refresh of the cache is managed by a SQL agent job called “Replication monitoring refresher for distribution”. Though this job runs continuously, the cache refreshed is based on the following conditions:
- From the time the cache was last created, if there were any agent history changes, the wait time is either 4 seconds or the amount of time taken to create the previous cache, whichever is minimum.
- If there were no agent history changes since the cache last creation time, the wait time is the maximum of: 30 seconds or the amount of time taken to create the previous cache.
Navigating the replication monitor:
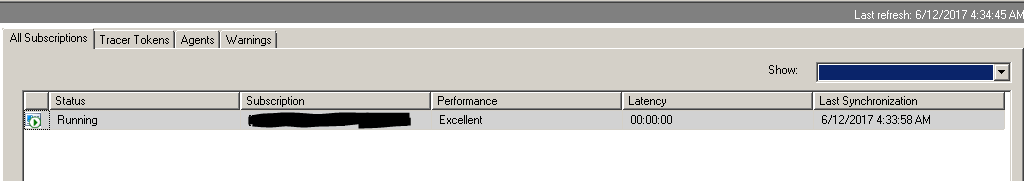
When we select a publication on the left-hand side of the replication monitor screen, the following window appears on the right-hand side with four fields corresponding to the selected publication on the left. The very first tab namely “All Subscriptions” lists all subscriptions corresponding to the selected publication.
If we double-click on any of the listed subscriptions, the following window pops up. It further has three tabs. The first one is the status of the “Publisher To Distributor”. As a reminder, this is taken care of by the log reader agent. We may drop-down the “view” tab and select the range we would like.

The next item is “Distributor To Subscriber”. As the name says, it gives some insight into the commands flowing from the distributor to the subscriber and this task is accomplished by the “distribution agent”.

The last tab shows the number of undistributed or outstanding commands in the distribution database that are waiting to be sent out to the subscriber along with an estimated time it takes to apply all these commands on the subscriber.
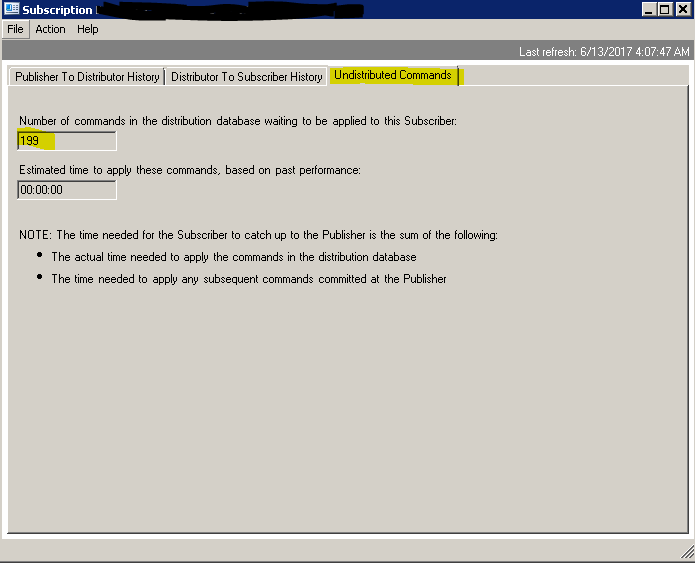
Please note that it shows an “estimated” time as opposed to the actual time. What this means is, it is the time SQL Server thinks it needs to send the records currently waiting to be sent to the subscriber. It is the sum of the actual time needed to apply the commands waiting in the distributor and the time it takes to apply any subsequent commands committed at the publisher. So one shouldn’t be surprised if they see outstanding commands in thousands with an estimated time in several minutes or even hours suddenly drop down drastically and sync up with publisher in the next minute or so. It fluctuates with the factors such as current network speed etc.
The next tab in the main window is tracer tokens (discussed below).

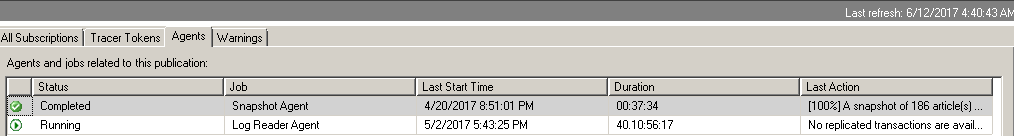
Third field displays the two agents i.e. the snapshot and the log reader agent current status. Remember Log Reader agent scans the T-log of the publication database and moves the records to the distribution database from where the Distribution Agent further moves them to the subscriber.
Lastly, the fourth one is about the warnings. We can customize it to send alerts.

Windup:
Replication Monitor, although good for real-time or ad hoc monitoring, kind of lacks an easy historical latency analysis or trend analysis and consumes resources as it runs queries under the hood. It’s known to have caused some performance issues when multiple sessions are opened in parallel. Though we could disable the automatic refresh and choose to refresh manually, it still doesn’t make it fully convincing. Still one cannot deny the fact that it proves useful in times of real-time monitoring.
Option 2: Tracer Tokens:
Tracer tokens existed since SQL Server 2005. It’s one of the methods still used by many people to monitor the transactional replication. The way it works is SQL Server sends a token (nothing but a small amount of data) to the T-log of the database acting as publication as though it were a real DML transaction (INSERT, UPDATE & DELETE) and commits it. It is then dumped into the Distribution database on the distributor. Remember, our distributor could be on the publisher or we could have a separate dedicated distributor server. The distribution agent then grabs it from there and sends it to the final destination i.e. the subscriber and commits it. This is just to reproduce a scenario of a DML operation to see how it performs. As a reminder, in push subscriptions, distribution agent runs off the distributor whereas in pull subscriptions, it runs on the subscriber.
By doing this, tracer token calculates two time duration,
Firstly, the time elapsed from the moment the token was committed on the T-log of the publication database to the time when it was available in the distribution database.
Secondly, the time elapsed since the transaction was available in the distribution database to the time when it finally makes it to the subscriber. The token history is retained and can be looked into to get any historical latency information. The historical information is governed by the “history retention period” parameter of the distribution property.
Configuring Tracer tokens:
Tracer tokens can be configured either by using replication monitor GUI or by T-SQL system stored procedures.
To configure it via replication monitor GUI,
- Simply right click the publication under replication tab on SQL Server Management Studio and select launch replication monitor. The following screen shows up.
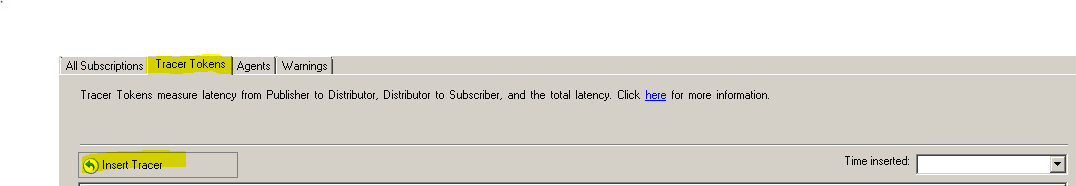
- Click on Insert Tracer, it will start the above discussed procedure i.e. commits a small amount of data on the T-log of the publication database followed by sending it to the distribution database and finally to the subscriber. It records the time it takes at each point. Notice the “Pending” status in the example below which means publisher to distributor was completed in 3 seconds whereas from distributor to subscriber was taking a little bit. Also notice the “Time Inserted” box. This is the time the token was run. There will be one entry for each run.

3. Below are the latency values:

Obviously, we wouldn’t want to do things manually and would like this to be automated so alerts are generated only when there is an issue and not otherwise. To do that, we would have to use the system stored procedures the replication monitor GUI runs under the hood. These stored procedures can be customized and run as SQL agent job at regular intervals so to automate the process.
The four key system stored procedures that will get us going are as follows:
sp_posttracertoken: This one sends the token (small data) to the publication database’s T-log.
sp_helptracertokenhistory: To get the historical latency information.
sp_deletetracertokenhistory: To delete token history from the records.
sp_helptracertokens: Returns an entry for each tracer token that has been inserted on a publisher.
Windup
The problem with tracer tokens is, sometimes they are too slow in responding. As in the above screenshot, the “Distributor to Subscriber” was stuck as pending and I had to run the tracer token against another publication to use in the example. Remember it is sending small piece of data and committing on the T-log of the publication database. It doesn’t give any information about the number of in-transit or outstanding commands in the distribution database waiting to be shipped to the subscriber. Even if the monitoring process is automated using SQL agent job, it still has to be ‘one token per publication’ on the publisher. So, if we are developing a homegrown script, we will have to write it in a way that it loops through all the publications or else, we will have to go with one job per publication. Some other gotchas are mentioned in the Books Online. Nevertheless, tracer tokens is still liked and adopted by many users.
Option 3: Canary Tables:
A canary table is nothing but a regular table normally with only a single [DateTime] column. The logic is to be able to add this table to the publication and replicate to the subscriber. It follows a pretty straightforward approach as given below:
Configuring Canary Tables:
- Have a table with a single [DateTime] column created in the publication database and name it such that it reflects its function or publication it is going to be added to.
- Add the table to the publication.
- Create a SQL agent job on the publisher that runs every minute or so and populates this table with current timestamp.
- Create another SQL job on the subscriber which compares the current time to the MAX [DateTime] value in this replicated table and write a condition to send an alert if the latency exceeds certain limit.
- Add a step to both jobs to delete historical datetime values so the table is not filling up.
Another easy way would be to replace INSERT with UPDATE so there is no hassle of purging old records.
Windup
Though the process is fairly simple, we still have to go through the hassle of adding the canary table to each and every publication. Imagine a publisher with 200 publications; it takes lot of time and effort to get it completed. Not to mention it doesn’t give any clue about the number of undistributed commands or the estimated time it takes to sync them up. However, to minimize the effort, we could write a custom script for the SQL job to loop through the publications and work on the canary tables to update the [datetime] column. That way, you’re not doing one job per publication. Same goes for the job on the subscriber. Simply write logic so it loops through all the canary tables in the subscription database and sends alerts if the threshold condition is met. All in all, it has proved useful for servers with small number of publications.
Conclusion:
There is no best and worst way of monitoring transactional replication and there are pluses and minuses of using each method. It all boils down to the criticality of the application that uses the subscription database and how current it needs the database to be and some other factors that are beyond the scope of this article.
See Also
Caching, Refresh, and Replication Monitor Performance
Measure Latency and Validate Connections for Transactional Replication