Generate Power BI reports from data in JSON file
Introduction
Power BI is a cloud-based Service, which provides data visualization options, based on the source data. Using Power BI, we can create dashboards, based on the data. In order to create the reports. Using Power BI, make sure that you have a Power BI account. If you don’t have an account, you can sign up for it here . You can either work with Power BI online or download the Power BI Desktop version here.

Power BI has the flexibility to consume numerous data sources and generate business intelligence reports from the source data. In this article, we will see how to consume JSON data from a JSON file within Power BI and create reports using that data. The JSON file that we will be using contains the Q1-Q4 sales data of cars as shown below.

Connect to Data source
In order to derive business intelligence reports, we will have to first connect to the data source. Click on ‘Get data’ to connect to the JSON file that has the source data.

This will open up the Get Data window, Select JSON option and click on Connect.

Browse to the JSON file which we will use as the data source.

Upon clicking on Open, the JSON data will be loaded into the Query Editor window. The loaded data will be present as a single row which represents the JSON root node. Click on ‘Record’ to drill down to the list of records.

Further, drill down to individual records by clicking on ‘List’.
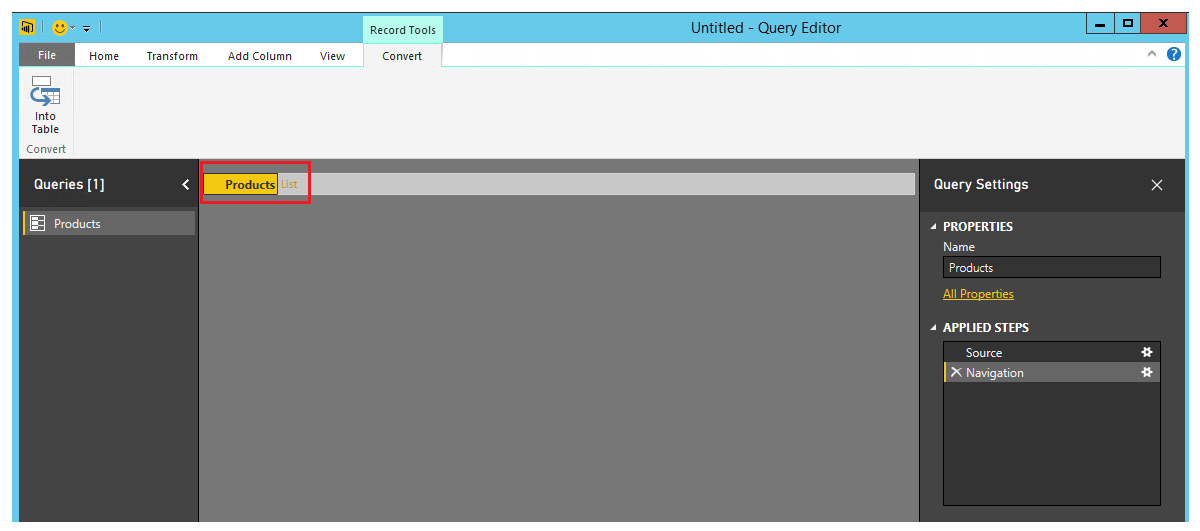
Convert JSON to table data
Thus we have a record for each item in the JSON File. We can now convert this to the Power BI table by selecting the ‘To Table’ option.

Select the below-highlighted column mark.

It will give us the option to select which column should be part of the table. Ensure that you uncheck the check box ‘Use original column name as prefix’. If it is checked, the generated column will have the naming convention ‘Column1.NewColumnName’.
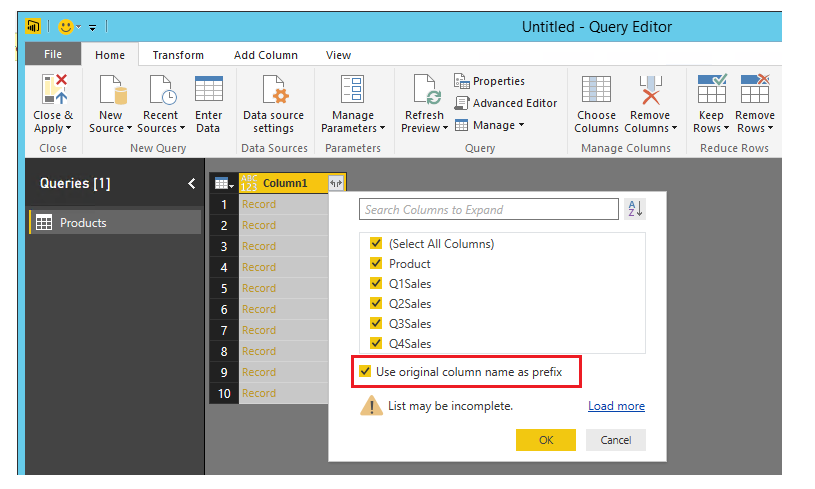
Upon clicking on OK, the table has been generated from the JSON file.
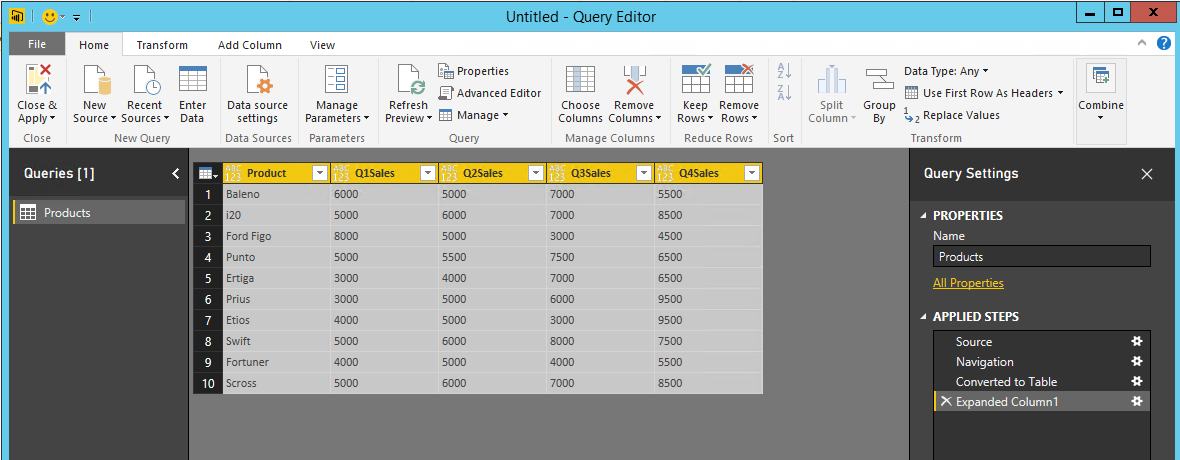
Let’s save the table by clicking on ‘Close and Apply’ in the Query Editor. This will enable us to generate reports from the table using the available templates.

The fields from which we can generate the Power BI report has become available in Power BI Desktop Designer.

Format the Data
Before we can create reports, we should format the data by changing the data type of Q1-Q4 Sales data from Text to Whole number. From the designer select the table icon and select the column ‘Q1Sales’. By default, it is of the data type ‘Text’.

Let’s convert it to a Whole Number so that we can use it to plot a chart.

Click on Yes to start the data type change. Repeat the data type change process for Q1-Q4 Sales column.

Generate Business Intelligence Reports
Head back to the report designer by clicking on the below icon.

Now we can select from multiple Visualization options. Let go with a bar chart for the time being.
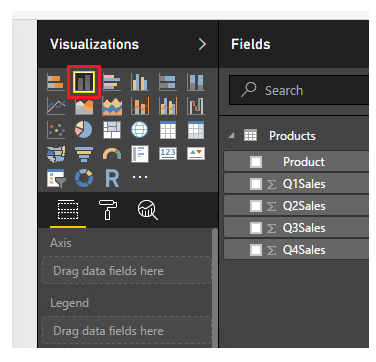
Drag and drop ‘Product’ field to the ‘Axis’ section which will form the X-Axis of the bar chart. Drag and drop the fields Q1-Q4 Sales to Values section so that it will come up on the Y-Axis of the bar chart.

This will result in the Power BI bar chart as shown below. Hovering over the bars will show us their respective values.

We can also customize the existing chart by changing the colour, legend and font size by selecting the option below.

Publish to Power BI Online
We can now publish the report from Power BI Desktop to Power BI Online, provided we have registered an account with Power BI. Click on ‘Publish’ from the Power BI Desktop designer.

This will publish the report to Power BI Online.
Heading over to Power BI online, we can view the report as shown below.

Summary
Thus we saw how to generate Power BI reports based on the data from the JSON file.