SharePoint Framework Troubleshooting: Debugging Solutions using Visual Studio Code
Introduction
As SharePoint Framework (SPFx) Solutions are gaining popularity, it is important for developers to know how to debug the SPFx solutions. This article provides steps on “How to debug SharePoint Framework (SPFx) Solution”.
Getting Started
Open solution
Open the SPFx solution which requires debugging using Visual Studio Code. (In this article, a sample OOTB hello world web part is taken as a reference.)
Download Debugger for Chrome Visual Studio Code Extension
Inside the Visual Code, under Extensions look for Google Chrome debugger and install Debugger for Chrome.
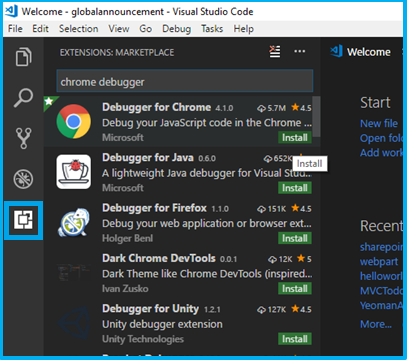
Click Reload to activate it.

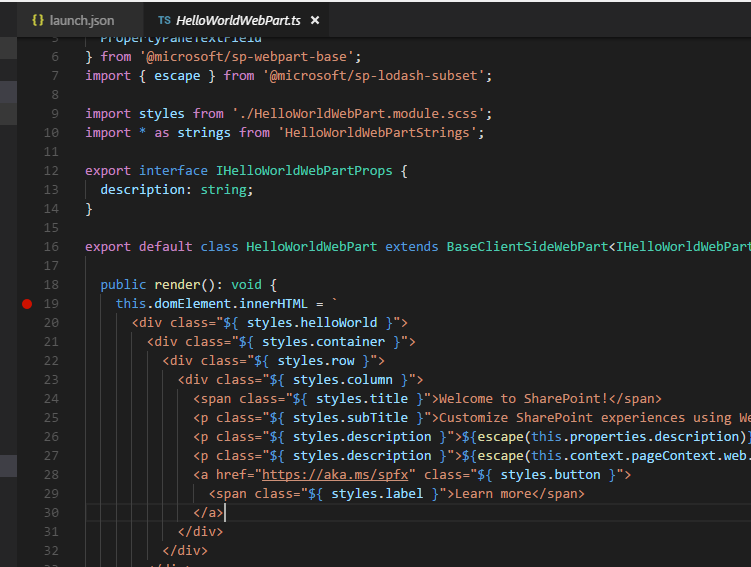
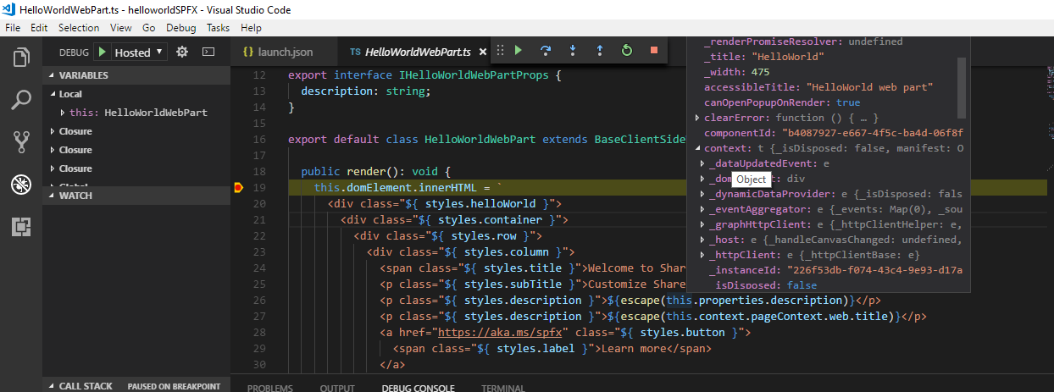
Set Breakpoint.
Here, for example, a breakpoint is set on render function.
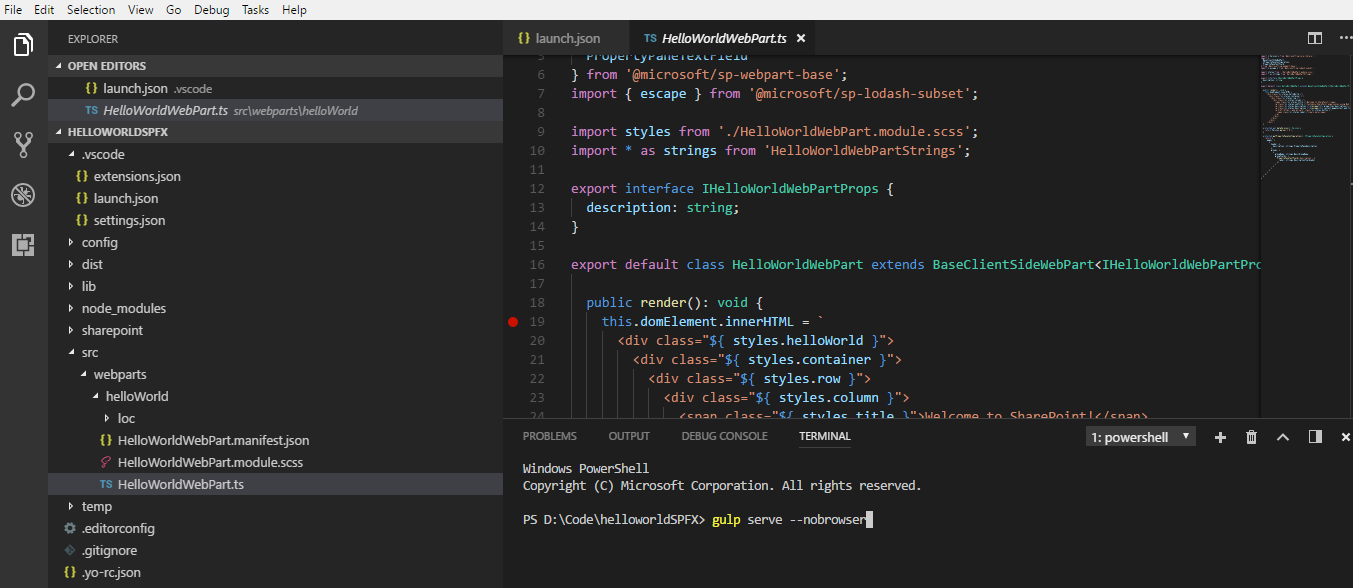
Terminal
Inside the Visual Code, click View -> Integrated Terminal.
 GUlp
GUlp
Under Terminal tab, run gulp serve --nobrowser
Configure launch.json file
Open file explorer and inside the SPFx solution, expand .vscode folder and open launch.json
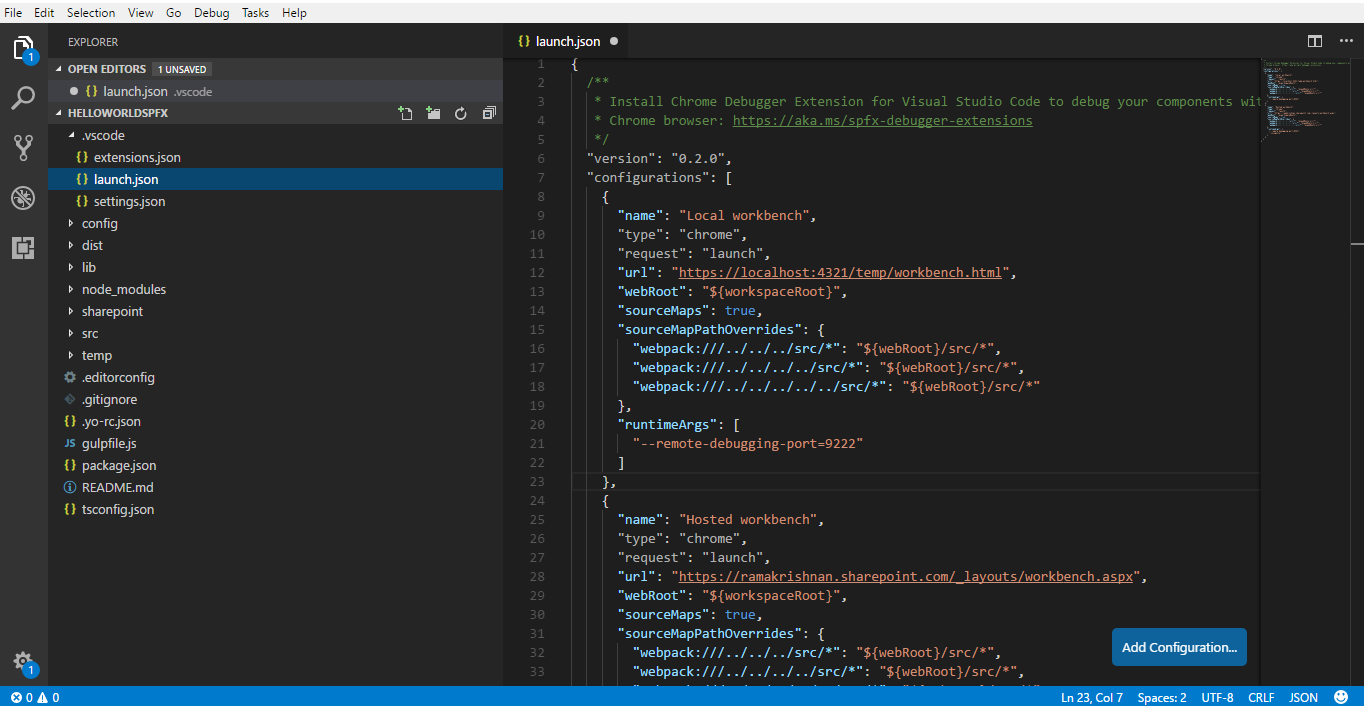
Replace code
Replace the content inside launch.json with below code and also replace the URL with actual Tenant URL for e.g. "url": "https://ramakrishnan.sharepoint.com/_layouts/workbench.aspx", inside Hosted workbench tag.
{
 /**
 * Install Chrome Debugger Extension for Visual Studio Code to debug your components with the
 * Chrome browser: https://aka.ms/spfx-debugger-extensions
 */
 "version": "0.2.0",
 "configurations": [{
 "name": "Local workbench",
 "type": "chrome",
 "request": "launch",
 "url": "https://localhost:4321/temp/workbench.html",
 "webRoot": "${workspaceRoot}",
 "sourceMaps": true,
 "sourceMapPathOverrides": {
 "webpack:///../../../src/*": "${webRoot}/src/*",
 "webpack:///../../../../src/*": "${webRoot}/src/*",
 "webpack:///../../../../../src/*": "${webRoot}/src/*"
 },
 "runtimeArgs": [
 "--remote-debugging-port=9222"
 ]
 },
 {
 "name": "Hosted workbench",
 "type": "chrome",
 "request": "launch",
 "url": "https://enter-your-SharePoint-site/_layouts/workbench.aspx",
 "webRoot": "${workspaceRoot}",
 "sourceMaps": true,
 "sourceMapPathOverrides": {
 "webpack:///../../../src/*": "${webRoot}/src/*",
 "webpack:///../../../../src/*": "${webRoot}/src/*",
 "webpack:///../../../../../src/*": "${webRoot}/src/*"
 },
 "runtimeArgs": [
 "--remote-debugging-port=9222",
 "-incognito"
 ]
 }
 ]
}
or copy the content from
/en-us/sharepoint/dev/spfx/debug-in-vscode#create-debug-configuration-for-hosted-workbench
Run debug
Press F5 or click Start Debugging

Local workbench
Local workbench is launched in Chrome browser and once the web part is added and edited.

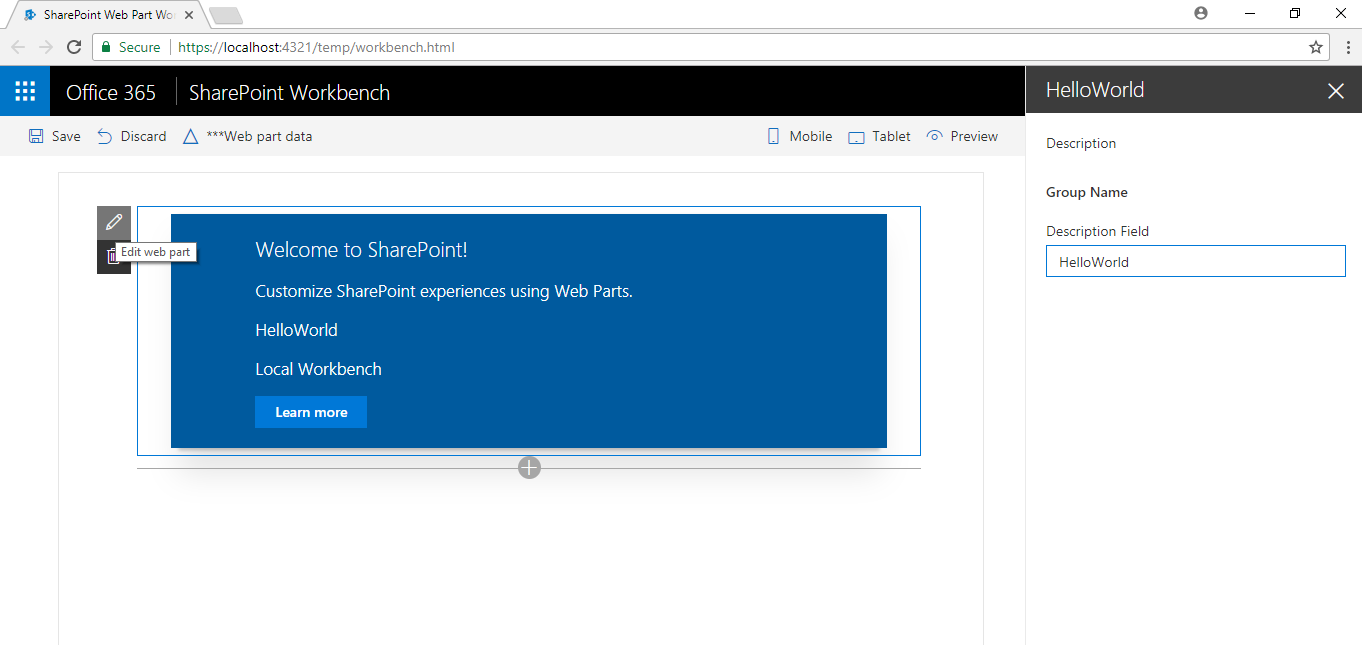
Breakpoint is being hit. In this way, debugging of SPFx solution can be performed using local workbench.

Stop the debugging (Shift+F5)
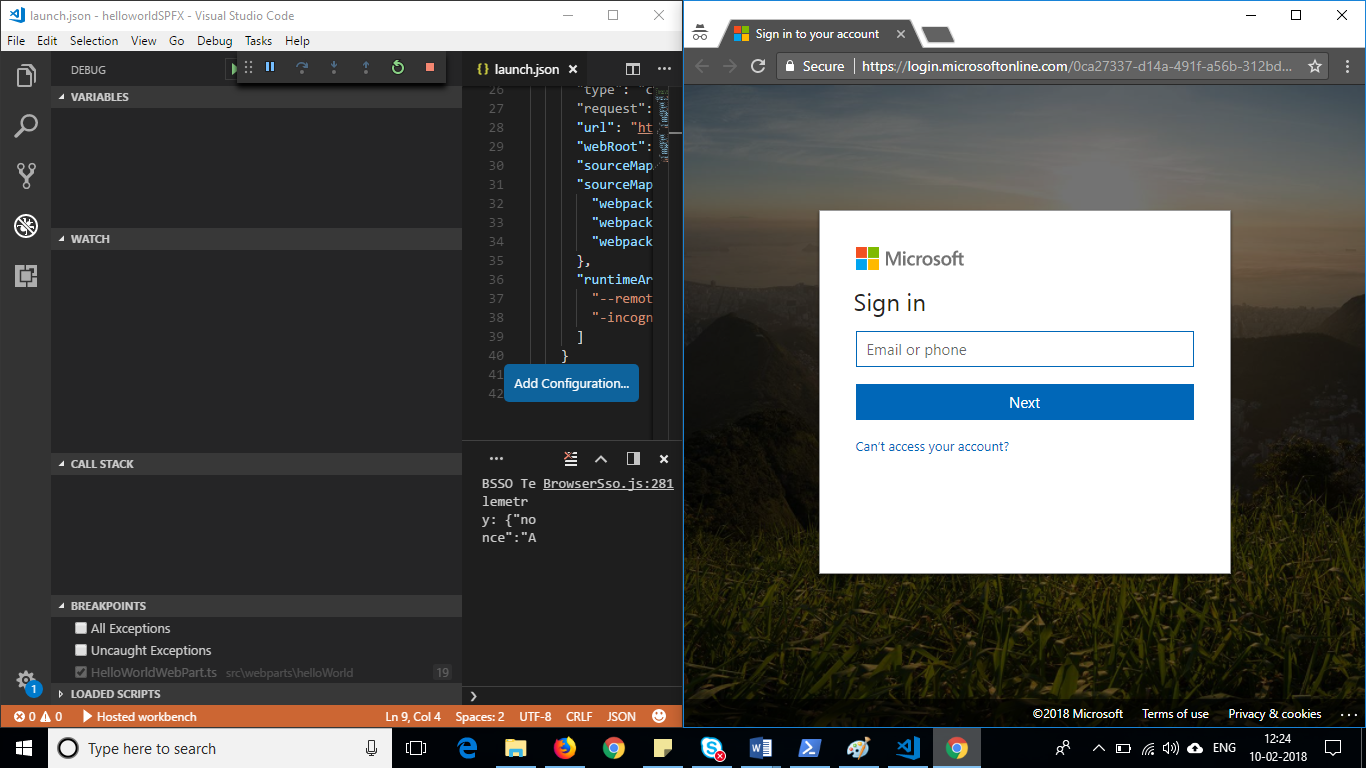
Switch to hosted workbench
Now run the solution to the actual SharePoint Context. For this, switch to Hosted workbench and start debugging.

Sign in to the portal
Add and Edit SPFx web part.

Breakpoint is hit displaying actual SharePoint Context.
Conclusion
Therefore, by following the above steps, developers can debug SharePoint Framework solution with ease./p>
References
- /en-us/sharepoint/dev/spfx/debug-in-vscode
- https://www.youtube.com/watch?v=oNChcluMrm8&list=PLR9nK3mnD-OXZbEvTEPxzIOMGXj_aZKJG