BizTalk:Understanding BizTalk Oracle Adapter Performance Counter
Introduction
Performance counters are very important when an admin/developer want to understand how the system is behaving. They establish a baseline value to which the actual measured values can be compared and then a reasonable conclusion about the environment-behavior can be drawn.
As per MSDN documentation
"Counters are used to provide information as to how well the operating system or an application, service, or driver is performing. The counter data can help determine system bottlenecks and fine-tune system and application performance. The operating system, network, and devices provide counter data that an application can consume to provide users with a graphical view of how well the system is performing."
Problem Statement
This article based on a real scenario where Oracle adapter is used to consume the stored procedures from an Oracle database. The stored procedure was a standard stored procedure invoking a select statement. When the code was promoted to the testing environment and subjected to heavy testing, it was observed that the stored procedure was taking extra time for execution from the BizTalk application while its normal execution time from SQL developer was in milliseconds. In order to investigate the issue, it was decided to monitor the BizTalk performance counters and understand the reason behind this performance degradation. The details and understanding provided below are the findings from collecting a large set of perfmon counters for our BizTalk application.
Initial Observations
After querying the BizTalk tracking database, the initial duration taken between the message sent and the message received by the orchestration was found out. This was the initial point for the basis of the performance degradation as the total trip from and to, to the port was taking more than the expected time. It was found that the average total time between the two port events of, send and receive, as tracked against a service instance was around 7 to 20 secs. But when the stored procedure was executed using SQL developer and identical data, the average time of execution was around 1.4 secs. Clearly, this was an indication of something bad happening in the BizTalk environment. The only option to understand this phenomenon was to gather performance counters.
Perfmon Counters And Observations
The first counter that was tracked was the performance counter available for the Oracle adapter. This is LOB Time(Cumulative) and as per MSDN documentation
"The BizTalk .NET Adapter for Oracle DB category has one performance counter called the “LOB Time (Cumulative).” This performance counter denotes the time, in milliseconds, that the LOB client library takes to complete an action that the adapter initiates"
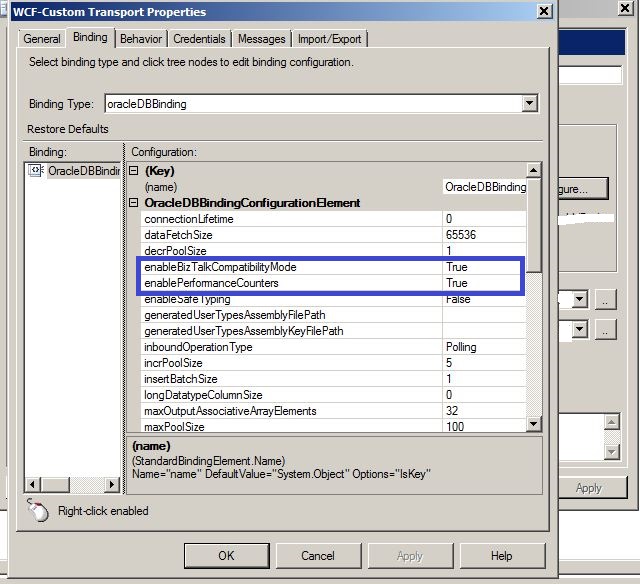
In order to collect the performance counters for the Oracle adapter, it is necessary that the collection of performance counters is enabled on the port level. It can be enabled as shown in the sample screenshot below. enable BizTalkCompatibilityMode is set to true as the adapter was used with a BizTalk application.
Observation Set 1
An important observation about the Oracle Adapter perfmon counter is that it is a cumulative time and with each call to the oracle stored procedure, the new execution time of the oracle class library gets added to the previously tacked time. Meaning the counter will start from zero on the first call and for subsequent calls, the time will be added to to the previous call. Hence the actual execution time of the oracle class library is the difference between two consecutive time readings. Refer sample below.

Following is the set of few sample data collected from the BizTalk tracking database and the performance counter.
| Port Execution Duration as noted from DTA Db(ms) | LOB Timeout(ms) |
| 20500 | 1529 |
| 7000 | 1607 |
| 5800 | 1451 |
| 19300 | 1497 |
Clearly, the timing derived from the DTA DB and the LOB timeout is not matching, thus indicating that there some other parameters at play when the port events are tracked.
Following perfmon Counters were also enabled to track data.
Outbound Adapter Latency: This performance counter is available under the BizTalk: Messaging Latency object and is described in MSDN documentation as
"Average latency in milliseconds from when the adapter gets a document from the Messaging Engine until the time it is sent by the adapter."
**Inbound Latency: ** This performance counter is available under the BizTalk: Messaging Latency object and is described in MSDN documentation as
"Average latency in milliseconds from when the Messaging Engine receives a document from the adapter until the time it is published to Message Box"
These performance counters were enabled(Only for the send handler attached to the port executing oracle stored proc under question) and then again data was collected using the collector sets. Following are the observations
Observation Set 2
Following is a snapshot which tracks the LOB Time and the Outbound Adapter Latency and Inbound Latency in one go.
![]()
As evident from above each time there is a call to the oracle stored procedure, there are three values that are underplay
- Oracle Class Library execution time (LOB Time)
- OutBound Adapter latency
- Inbound Latency
Hence the total duration recorded in the DTADB for the port activities is the sum of all the three times mentioned above. It is evident from the following data.
| Port Execution Duration as noted from DTA Db(ms) | LOB Timeout(ms) | Outbound Adapter Latency(ms) | Inbound Latency(ms) | Total Duration(ms) |
| 20500 | 1529 | 16941 | 2106 | 20576 |
| 7000 | 1607 | 4196 | 1202 | 7005 |
| 5800 | 1451 | 3947 | 437 | 5835 |
| 19300 | 1497 | 16302 | 1529 | 19328 |
Conclusion
As evident from the observations made from the data collected, it can be concluded that in order to understand the performance of the Oracle Adapter in a BizTalk application, the following parameters need to be tracked.
- Oracle Class Library execution time
- OutBound Adapter Latency
- Inbound Latency
See Also
A starting point to explore BizTalk related resources on TechNet wiki is BizTalk Server Resources on the TechNet Wiki
Performance Analysis of Logs (PAL) Tool on Github: PAL Tool Github
References
Following articles were referred while writing this article.
- Performance Counters
- Messaging Performance Counters
- Use performance counters with the Oracle Database adapter
- How to: Collect Windows Counter Data
- PerfMon Usage Video