Power BI : Create Business Intelligence Reports from PDF Data Source using Microsoft R Open
Introduction
Power BI is a cloud-based service that provides data visualization options based on the source data. Using Power BI we can create dashboards based on the data. Power BI has the capability to connect to various data sources to derive data and create business intelligence reports. PDF is one such data source that is still in preview mode. In this article, we will see how to import PDF data to Power BI and use R Programming within Power BI to create a bar chart business intelligence report out the PDF data.
Prerequisites
- Power BI Desktop
- Microsoft R Open
Power BI Desktop
If you don’t have an account you can sign up for it here . We can either work with Power BI online or download the Power BI Desktop version from here . Once downloaded, we can install it in the local machine.
Microsoft R Open
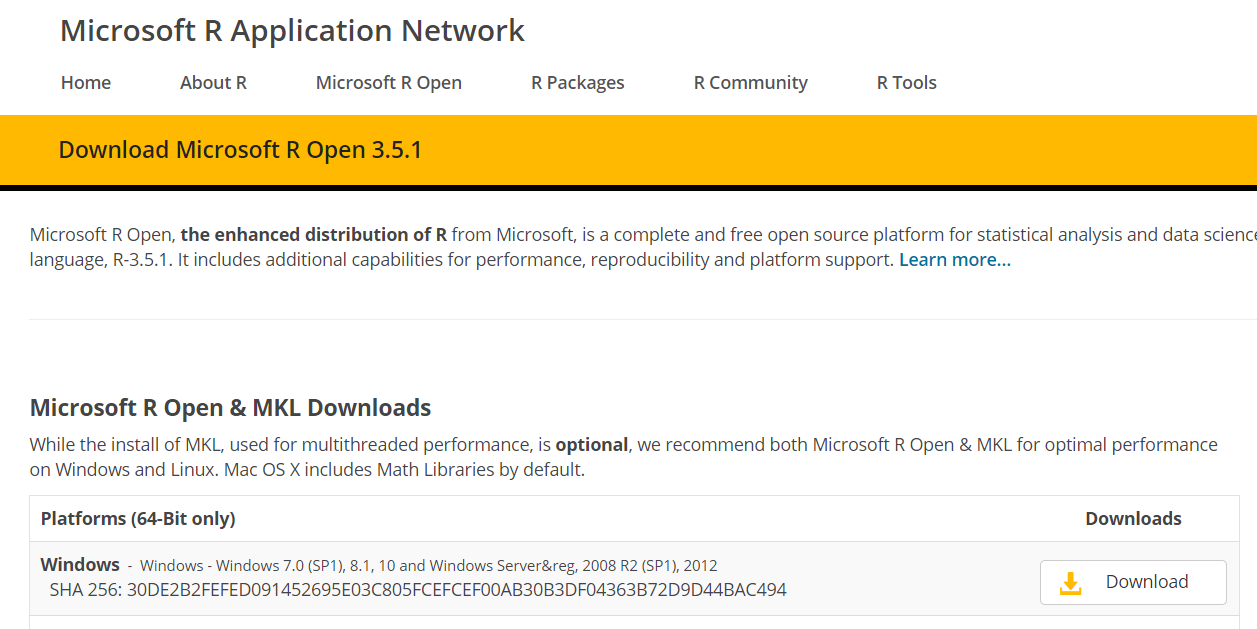
Microsoft R Open is the distribution of R from Microsoft Corporation. It is a complete open source platform for statistical analysis and data science. You can download it from here .
Now let’s go ahead and install R Open in the local machine.
Specify the location where R Open would be installed in the local machine.
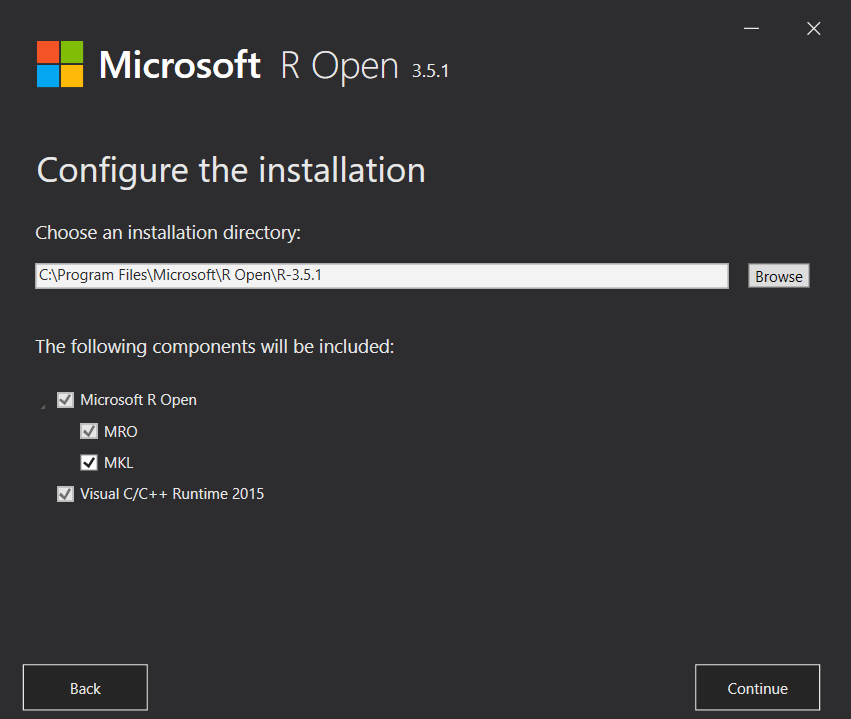
The default location is - C:\Program Files\Microsoft\R Open\
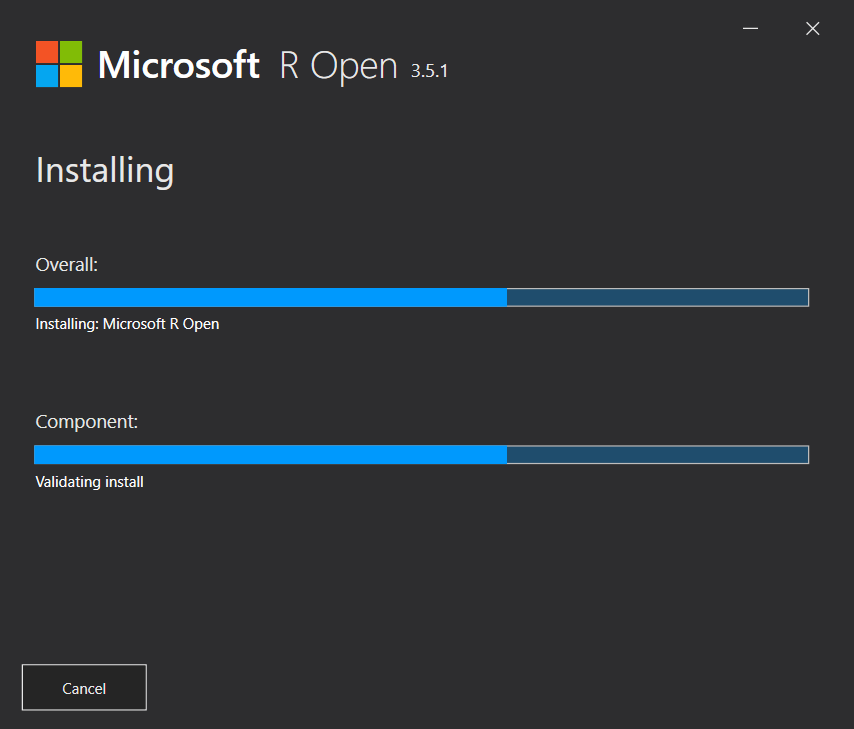
This will complete the installation of R Open in the local machine.
Install R Studio
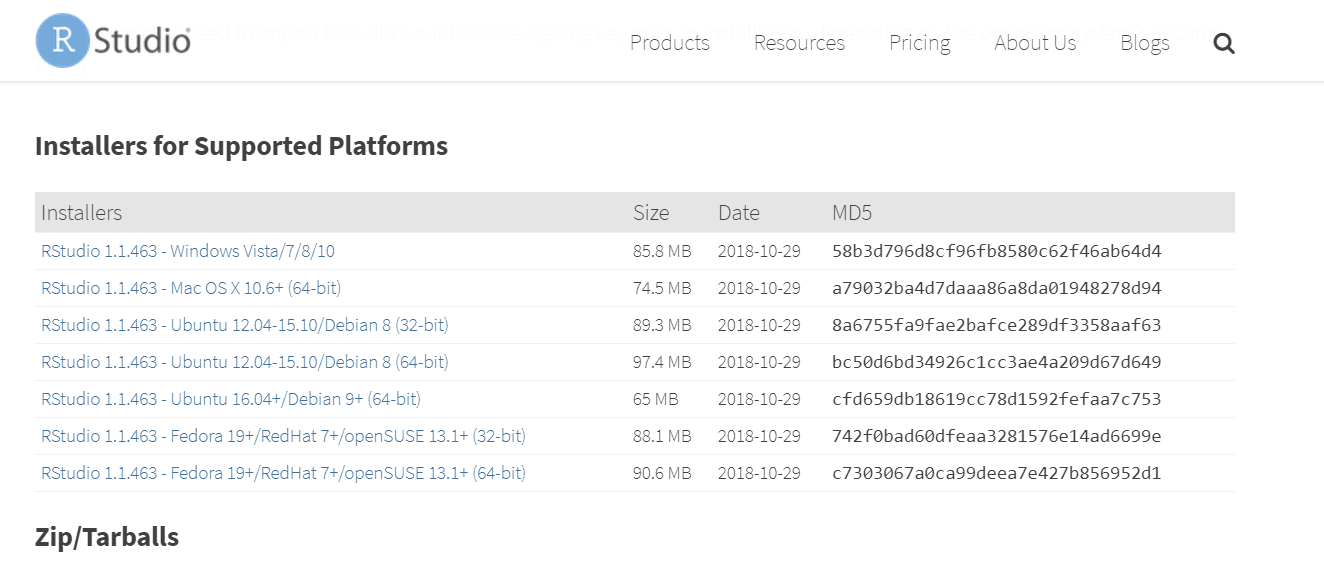
You can download R Studio from here .
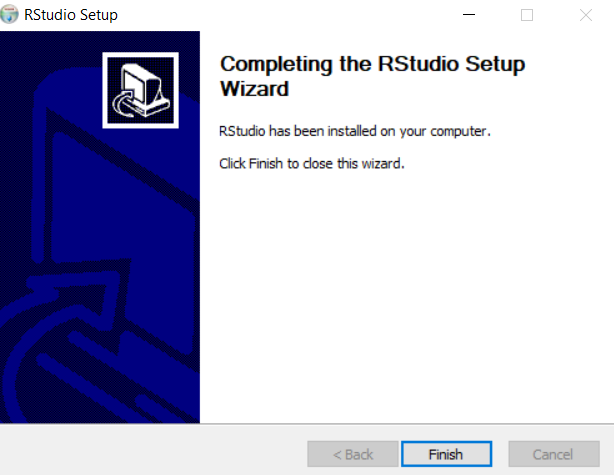
After downloading it, install it in the local machine.
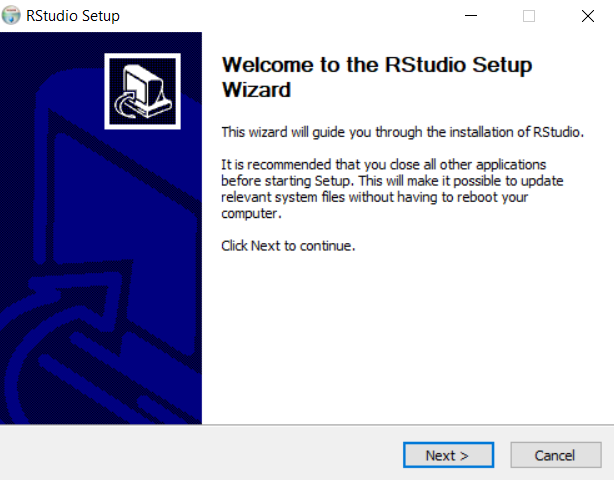
Proceed to install R Studio.
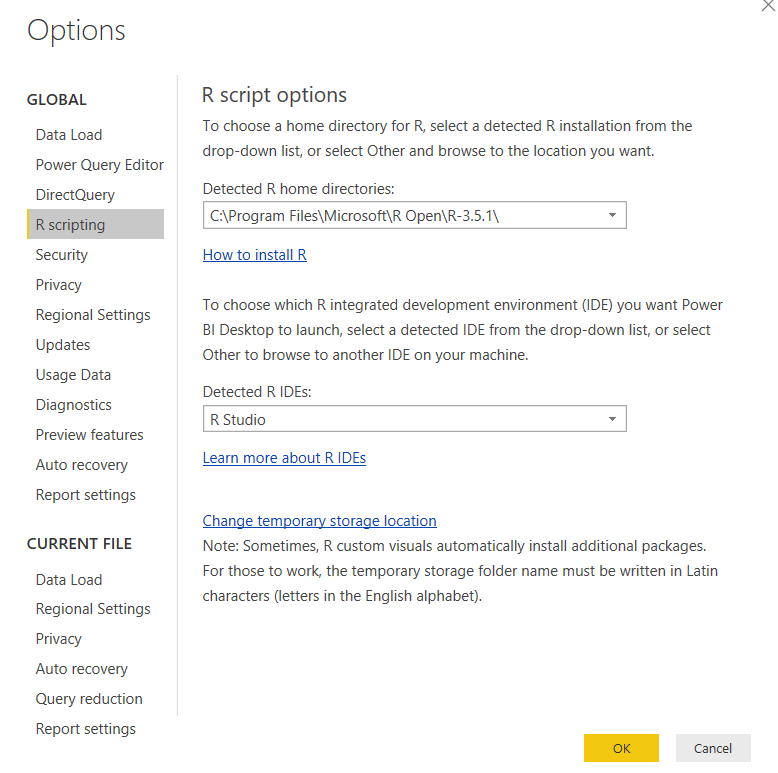
Configure R Open in Power BI
Now lets head over to Power BI
Ensure that the R Script options has the correct directory listed.
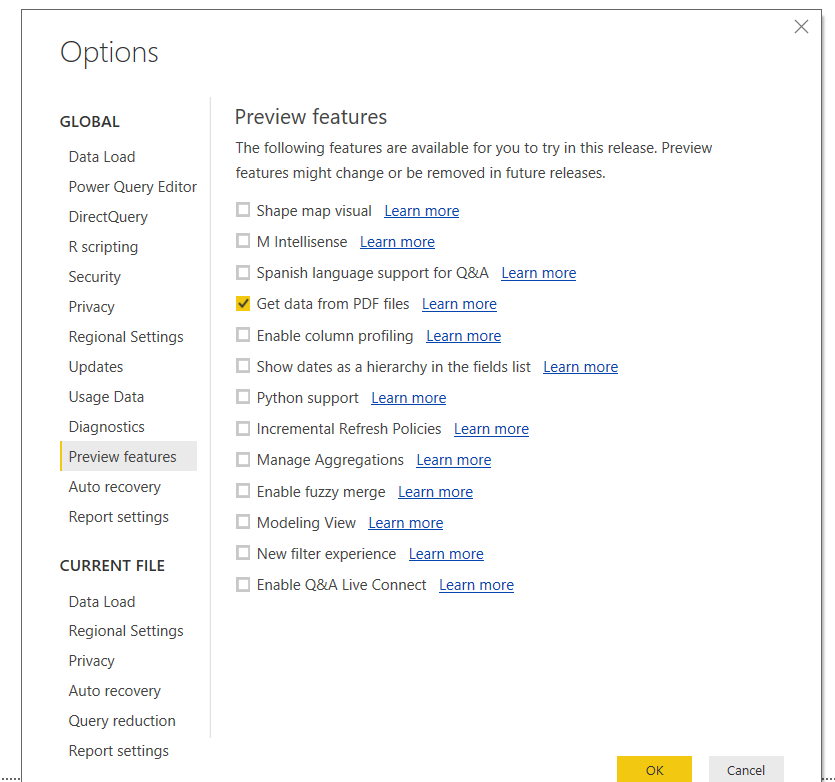
Allow PDF as a Data Source
Since PDF Data source is still in preview, we have to enable it from Preview features to use within the Power BI.
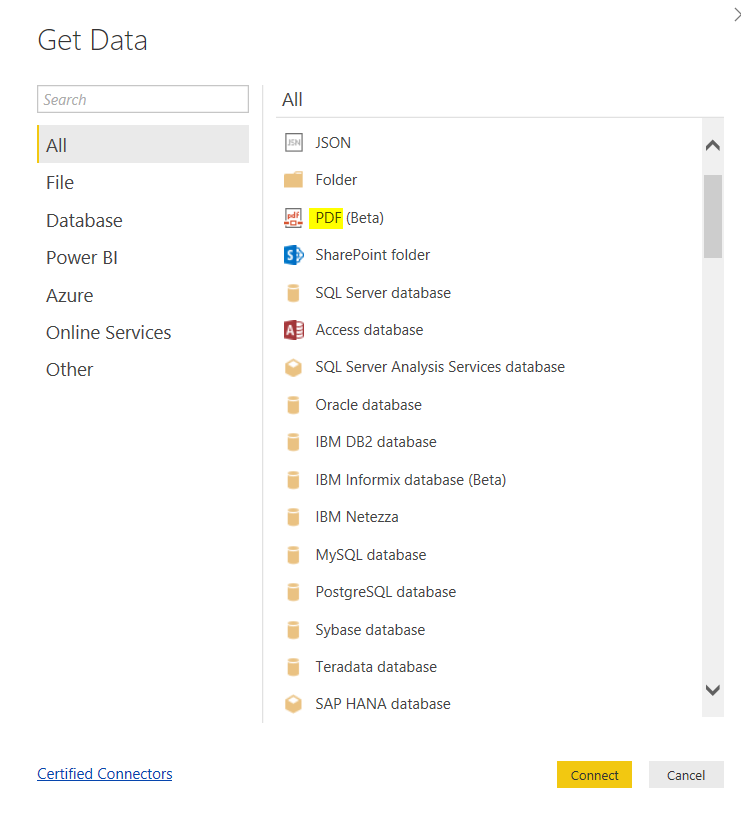
Connect to Data Source
Select Get Data option from Power BI. This will enable us to connect to various data sources.Search for PDF data source from the given list and select it.
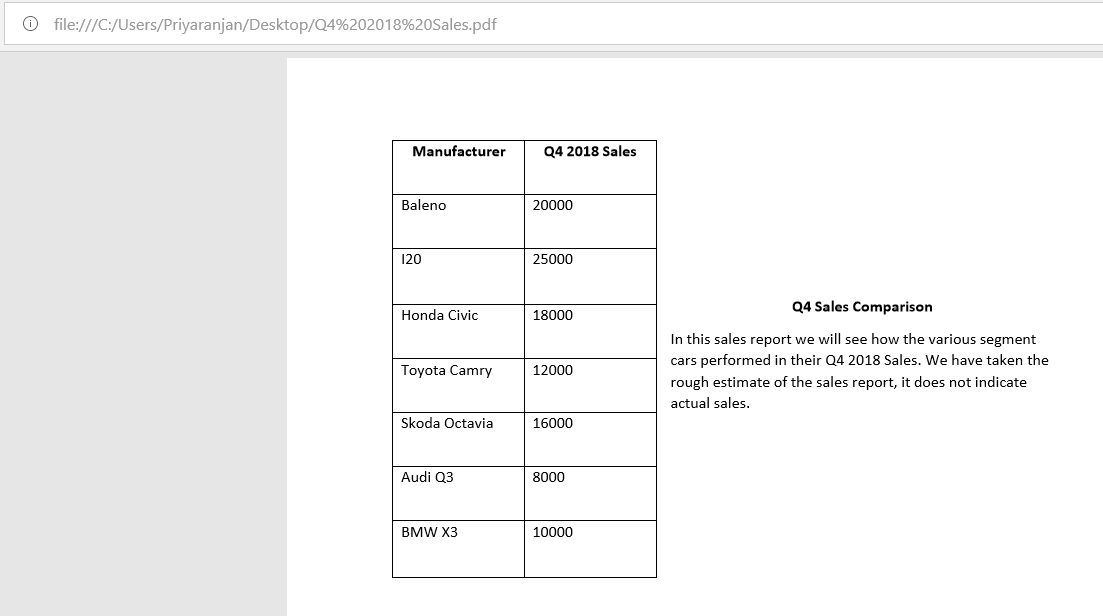
This will list out the Table that is present within the PDF.
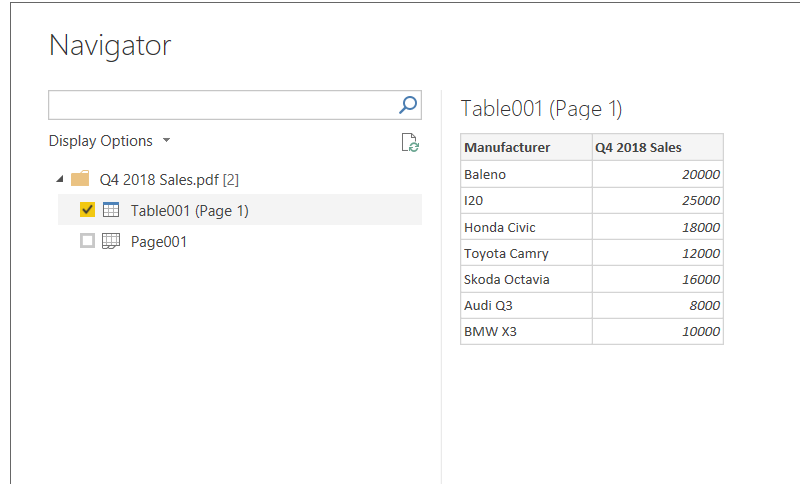
Choose the table and click on Load. It will add the table to Power BI Workspace
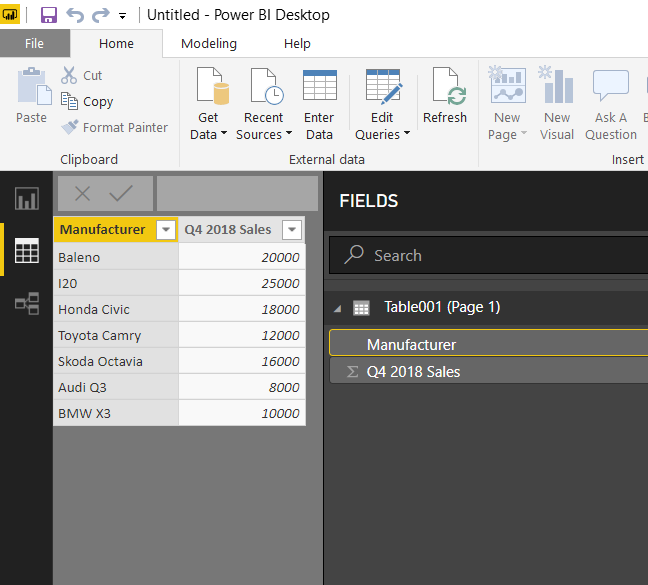
In order to visualize the data using R, we will select the R option from the visualization options.
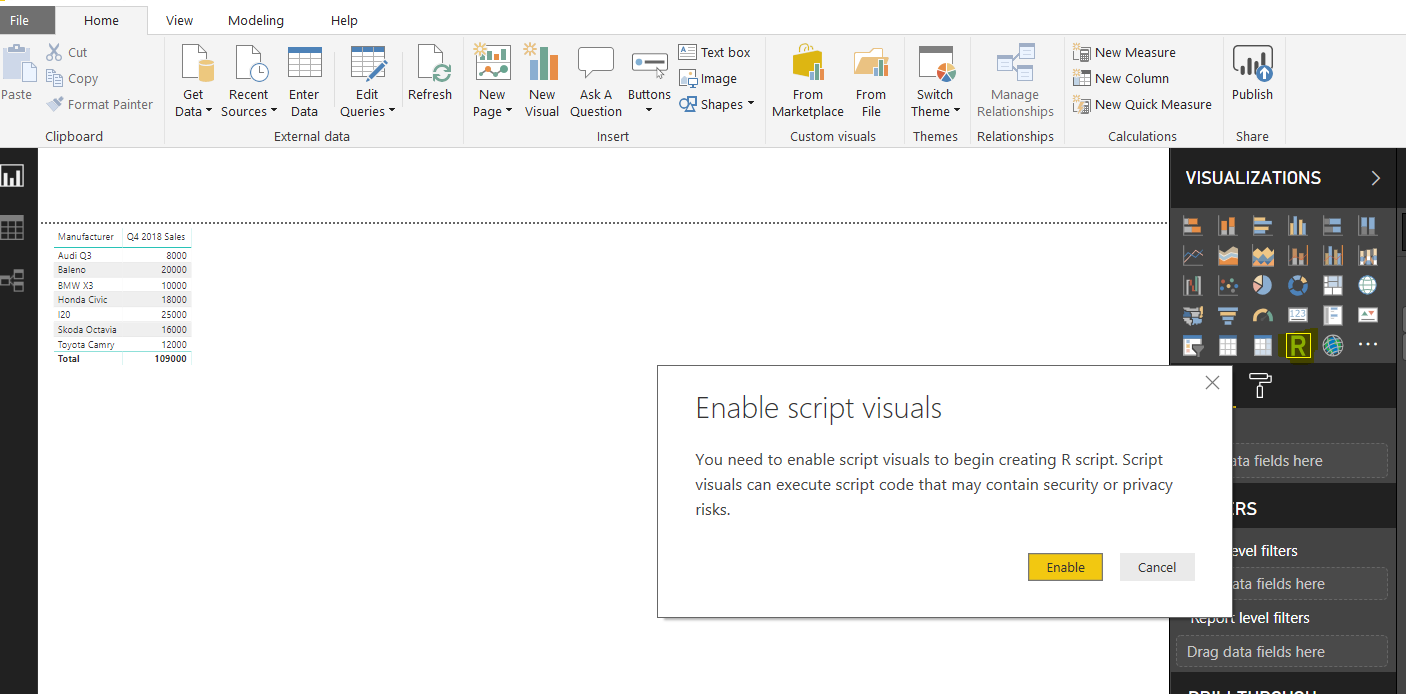
Click Enable to enable script visuals.This will open up the R Script Editor as well as the Visualization Display.I have renamed Q4 2018 Sales to Q4Sales so that whitespace issue doesn’t crop up.
Plot Bar Chart using R
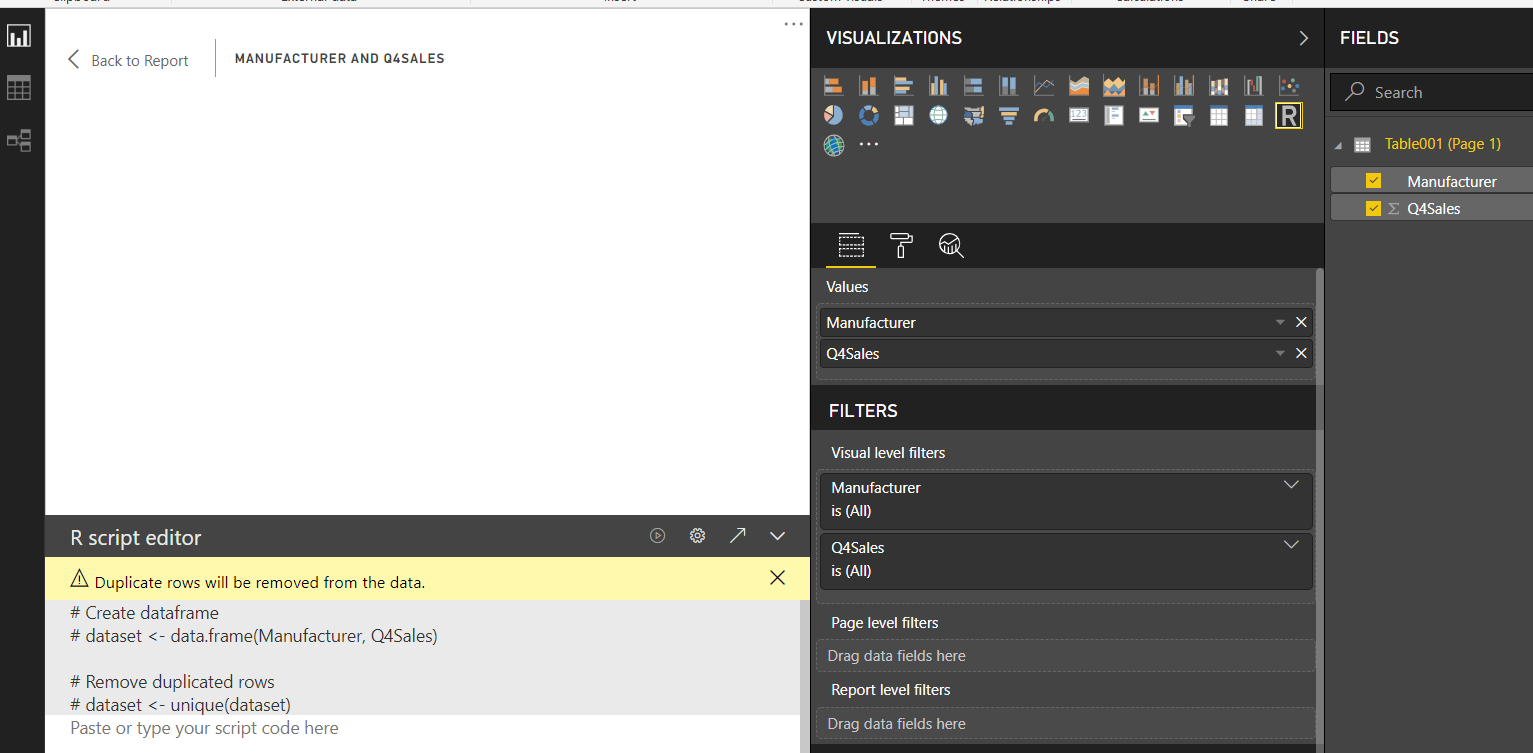
Now lets plot a bar chart using the loaded data with the command
barplot(dataset$Q4Sales, names.arg=dataset$Manufacturer)
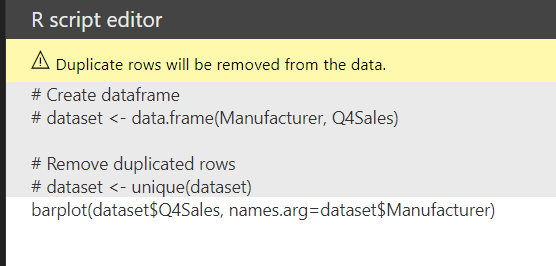
This command will create a bar chart with Q4Sales along the Y-Axis and Manufacturer along with the X-axis.Click on Run button to execute the script
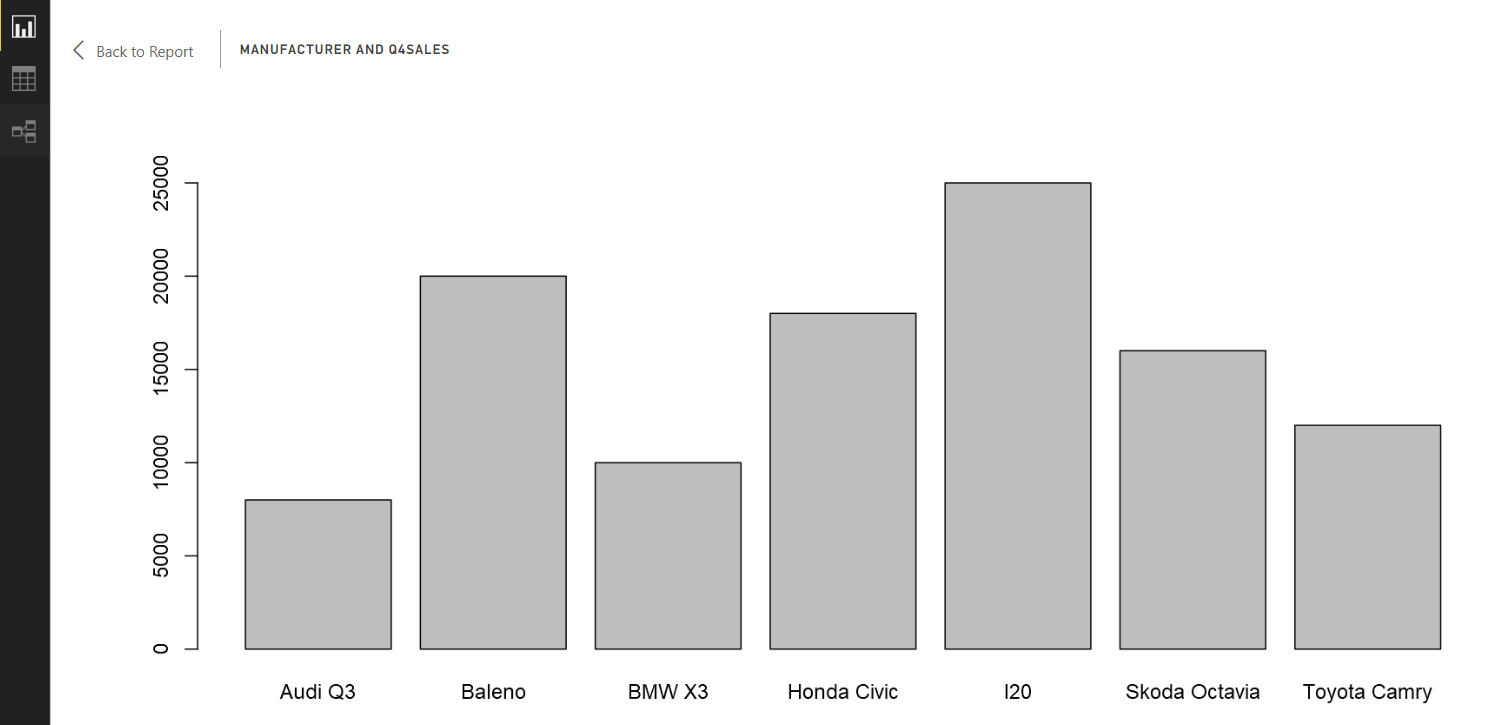
This is what we get out of the box. But we can load external packages that would help us create interactive charts. We will try to use one such package - “ggplot”. Run the below command to install ggplot.
install.packages("ggplot2")
In case you come across some error as shown below, it is mainly because of right permission issues in the R Open installation folder.
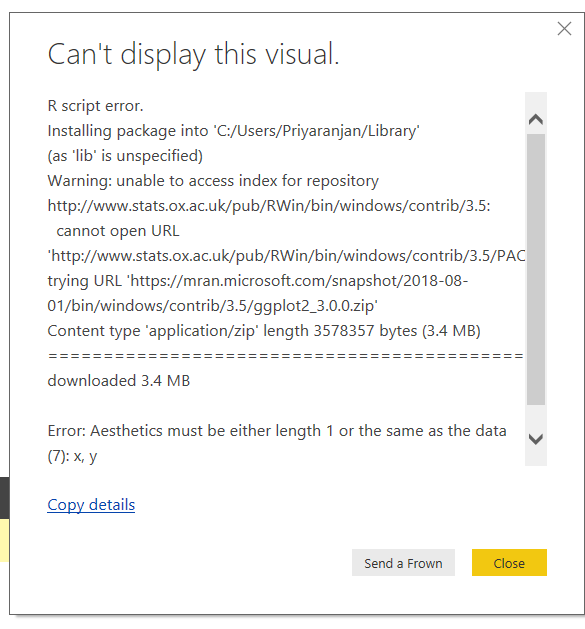
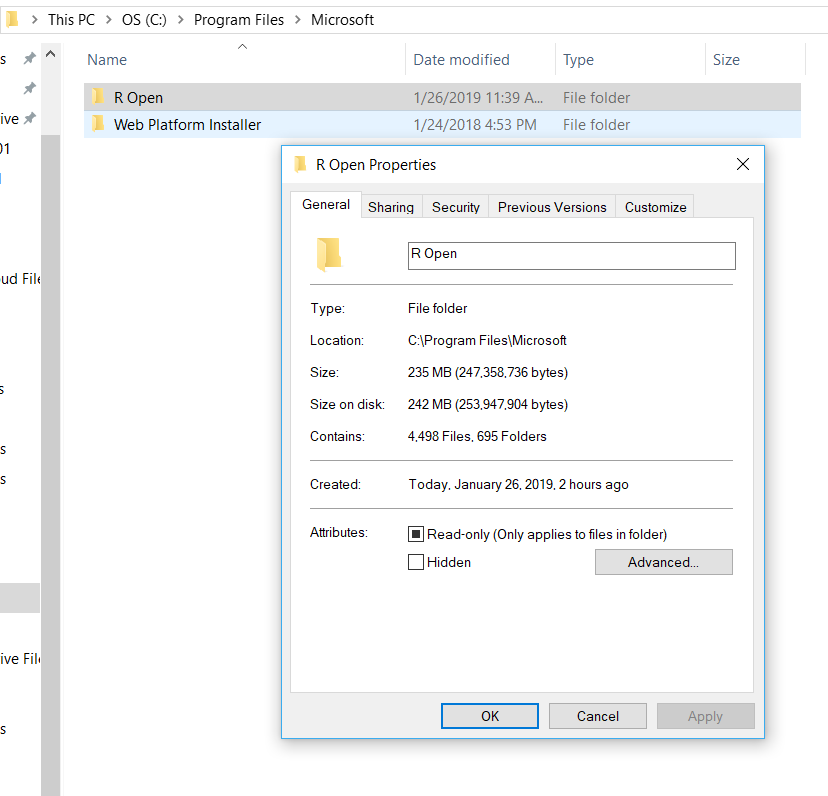
In order to resolve this, you can head over to the R Open installation folder and remove the Read Only restriction.
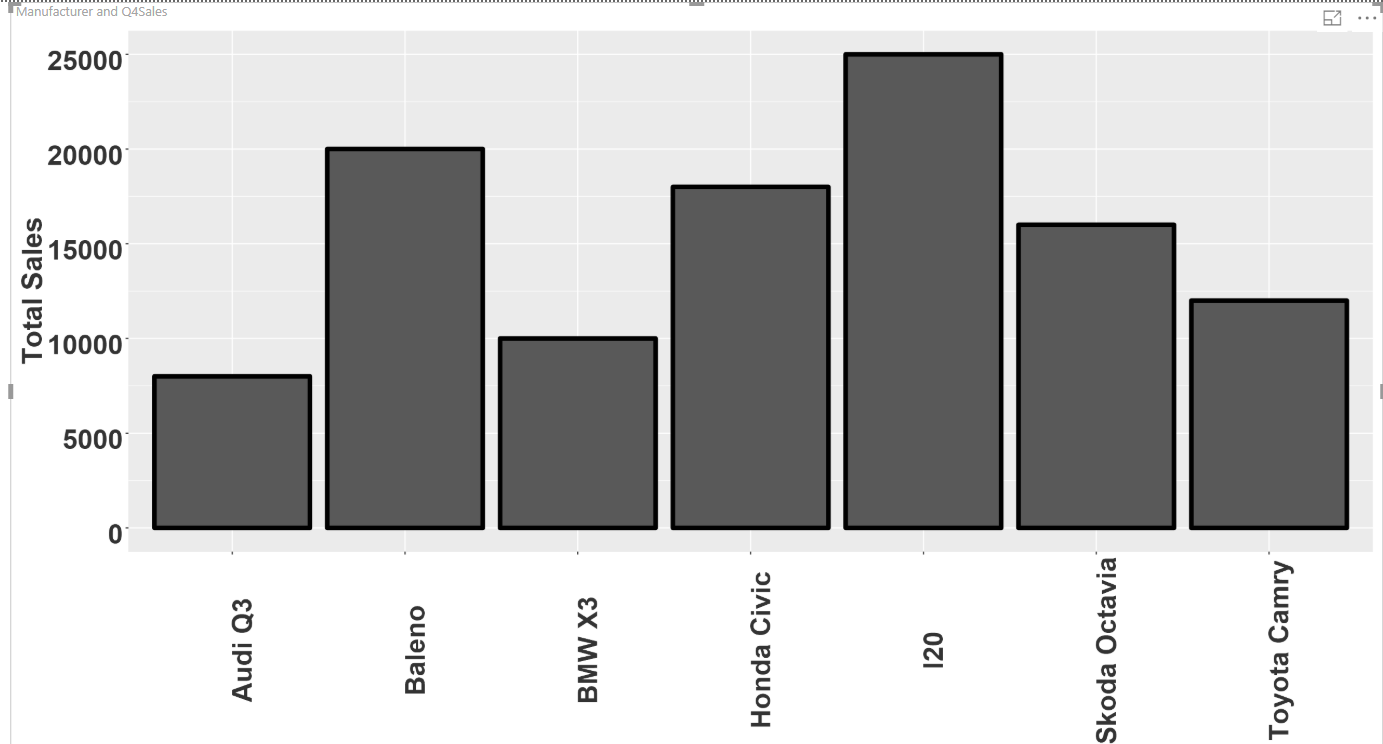
Once it is done, running the below command will install ggplot2 and set up the bar chart based on the customizations that we have specified in the Query as shown below.
install.packages("ggplot2")
library(ggplot2)

ggplot(dataset, aes(x=dataset$Manufacturer, y=dataset$Q4Sales)) + geom_bar(stat="identity",colour="black", size=2) +

labs(x="Car", y="Total Sales")+theme(axis.text.x=element_text(angle=90, colour="grey20", face="bold", size=25),

 axis.text.y=element_text(colour="grey20", face="bold", hjust=1, vjust=0.8, size=25),

 axis.title.x=element_text(colour="grey20", face="bold", size=26),

 axis.title.y=element_text(colour="grey20", face="bold", size=26))
Now let's run the script and see the rendering of the bar chart
Summary
Thus we saw how to setup R Open , R Studio and use PDF as a data source to create business intelligence reports in Power BI.
Note : PDF Data Source is still in preview mode