SCCM Deployment PowerBI Dashboard
Earlier in the year the had released the SCCM Software Update PowerBI dashboard which was a side by side version of the SCCM Software Update Dashboard which is compatible with report builder and SSRS.
Now the same revamping has been done with the new and improved SCCM Deployment PowerBI dashboard with some huge advancements and slightly different layout to the other version.
New Feature - High Priority Affected Departments/OUs
In the previous version there was a table and gauge which focused on the severity of the deployments that were currently running as well as the forecasts which could give an idea on how potentially dangerous it would be to roll out any deployments to them.
This has now been revamped so now instead of calculating the severity by the number of departments are affected, it will now go by which high priority departments and OUs are included within the deployment.
How it works
So here is how its configured, firstly you run a query to obtain all of the departments and OUs which you have i..e.
For Departments
select distinct department0 from v_r_user
For OUs
*select distinct system_ou_name0 from v_ra_system_ou_Name
*
Next we want to edit the two tables which are already created called "OU Severity" and "Department Severity" and perform the following;
- Copy the Departments from the queries above into the column which is marked "Departments" in the "DepartmentSeverity" data set
- Copy the OU's from the queries above into the column which is marked "Departments" in the "OUSeverity" data set
Apply and close those queries and let them update, and you will see all of your high priority OUs and Departments show throughout the dashboard
Inside the Power BI Dashboard
Front Page
https://irp-cdn.multiscreensite.com/c1f89e50/dms3rep/multi/desktop/FrontpAge1_BFpeKZGgRtWosPCkcnqB-1923x1080.PNGFigure 1.1 - Screenshot of the front page of the dashboard
Table of contents page showing a description of each potential page you can browse directly to.
Each button represents the bookmark of each page within the dashboard
Software Library Compliance
https://irp-cdn.multiscreensite.com/c1f89e50/dms3rep/multi/desktop/Softlib-1942x1081.PNGFigure 1.2 - Screenshot of the Software Library Compliance page
So this page is a full estate breakdown of everything you would have contained within your Software Library which would be everything from;
- Applications - Sorted by Vendor and type
- Packages - Sorted by Vendor
- Software Updates - Sorted by Severity
- Software Update Deployment Packages - Sorted by Vendor
- Driver Packages - Sorted by Vendor
- Boot Images - Sorted by Vendor
- Script Packages - Sorted by Author
- Image Packages - Sorted by OS
Below are also two handy tables which give a breakdown on the top 5 most installed applications within your SCCM estate by both device and user if utilizing both deployment methods which would be aimed at device collections or user collections which have the device affinity configured.
Collection Severity Forecast
https://irp-cdn.multiscreensite.com/c1f89e50/dms3rep/multi/desktop/CollSeverity-1931x1083.PNGFigure 1.3 - Screenshot of the Collection Severity Forecast page
The collection severity forecast page is designed to show the potential of what a new deployment can cause by giving an in-depth look at;
- Total Devices in the Collection
- Total Users affected in the Collection
- Total Departments affected in the collection
- Collection which the desired collection is limited to.
Within the SCCM console sometimes its difficult to gauge who is in each collection whether by device or user, so this page gives a SPOG (Single pane of glass view) of everything so you can understand if it affects any key areas.
Also having the addition of the "High Priority" tables which outline which OUs or Departments which were specified with high priority will also be shown to give an idea of who it will go to if it were to potentially go wrong.
Finished off with the forecast table that shows all online devices and offline devices to know what the success rate of your deployment would potentially be.
Application Deployment Compliance
https://irp-cdn.multiscreensite.com/c1f89e50/dms3rep/multi/desktop/AppDeploymentCOmplince-1928x1054.PNGFigure 1.4 - Screenshot of the Application Deployment Compliance page
First of few compliance pages within the dashboard which outline the details of a current application deployment running, gauge an understanding on what the current success/compliance level is on your application deployment with the following details;
- Assignment Details - Shows all of the assignment details of the current deployment
- Summarization of Deployment - Bar chart detailing the compliance levels of the current deployment
- Affected Charts - Charts showing the Affected OUs and Affected Departments within the deployment to see where the application will potentially be installed to.
- High Priority Charts - Related to the new severity feature which shows which high priority areas will be affected
- Machines in Deployment Table - Table shows all of the machines within the collection which the application deployment is aimed it so you can see and search each individual asset where necessary.
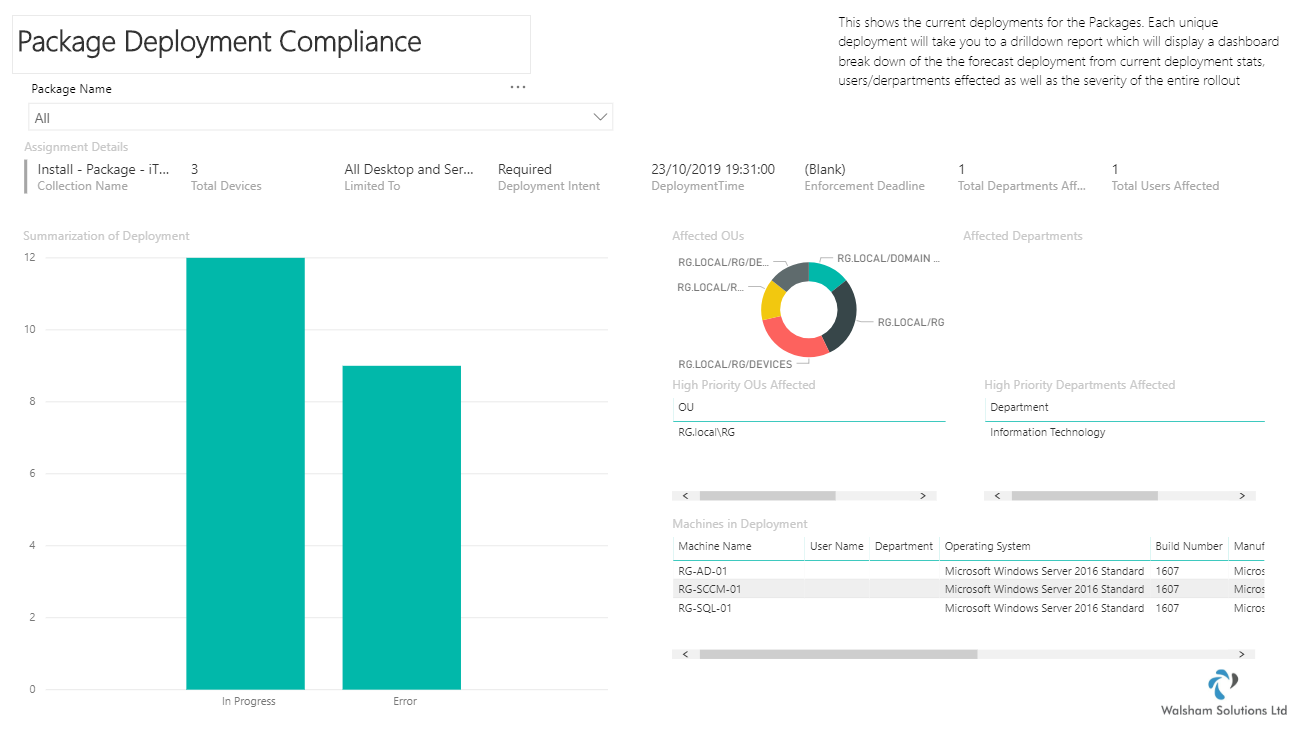
Package Deployment Compliance https://lirp-cdn.multiscreensite.com/c1f89e50/dms3rep/multi/opt/PackageDep-1298x734-1920w.PNG
Figure 1.5 - Screenshot of the Package Deployment Compliance page
Outlines the details of a current package deployment running, gauge an understanding on what the current success/compliance level is on yourpackagedeployment with the following details;
- Assignment Details - Shows all of the assignment details of the current deployment
- Summarization of Deployment - Bar chart detailing the compliance levels of the current deployment
- Affected Charts - Charts showing the Affected OUs and Affected Departments within the deployment to see where thepackagewill potentially be installed to.
- High Priority Charts - Related to the new severity feature which shows which high priority areas will be affected
- Machines in Deployment Table - Table shows all of the machines within the collection which thepackagedeployment is aimed it so you can see and search each individual asset where necessary.
Software Update Deployment Compliance
https://irp-cdn.multiscreensite.com/c1f89e50/dms3rep/multi/desktop/SoftwareUpdate-1939x1091.PNGFigure 1.6 - Screenshot of the Software Update Deployment Compliance page
Outlines the details of a current software update deployment running, gauge an understanding on what the current success/compliance level is on yourpackagedeployment with the following details;
- Assignment Details - Shows all of the assignment details of the current deployment
- Summarization of Deployment - Bar chart detailing the compliance levels of the current deployment
- Affected Charts - Charts showing the Affected OUs and Affected Departments within the deployment to see where thesoftware updatewill potentially be installed to.
- High Priority Charts - Related to the new severity feature which shows which high priority areas will be affected
- Machines in Deployment Table - Table shows all of the machines within the collection which thesoftware updatedeployment is aimed it so you can see and search each individual asset where necessary.
Operating System Deployment Compliance
https://irp-cdn.multiscreensite.com/c1f89e50/dms3rep/multi/desktop/OS_6SLyHp1TTuRe6hM1TQXX-1946x1096.PNGFigure 1.7 - Screenshot of the Operating System Deployment page
The Operating System Deployment Compliance page is quite detailed taking on a similar view to the other compliance pages where the assignment details and summarization of deployment is concerned.
But we find most of the issues we face when it comes to Task Sequence deployments tends to vary from Task Sequence references or machines failing at particular steps.
Select from a drop-down list of all of the task sequences which are available to see further compliance details.
With this page we can crack open a consolidated view over all of it within the following features;
- Task Sequence References - Details all of the referenced applications & packages which are contained within the Task Sequence. So if you experience any issues where the task sequence fails and quotes a specific package ID you should be able to easily identify it
- Current Machine Deployments - This table contains a slicer which you can select from its IP address to see the exact status of a currently building machine. It's done by IP address due to the fact that where a machine can possibly fail at a very early stage where a machine name has not even been decided, the IP address is really another way of finding out which machine is affected.
- Machines built in 24 Hours - This table shows a list of all of the machines which have been built by a certain task sequence within 24 hours or if they are in progress of perhaps failed.
Upgrade Deployment Compliance
https://irp-cdn.multiscreensite.com/c1f89e50/dms3rep/multi/desktop/UpgradeDeployment-1938x1088.PNGFigure 1.8 - Screenshot of the Upgrade Deployment Compliance page
This page focuses on two upgrade paths which will be quite a continuous process both being the Configuration Manager Client Upgrades and also the Windows 10 Build upgrades.
At the bottom is a universal table that shows all of the machines including both Windows 10 build number versions and also the SCCM client versions.
Deployments for both referring to the below can be analysed on the Software Update Deployment Compliance and Package Deployment compliance pages respectively.
*Configuration Manager Client Upgrades
*This section shows a pie chart of all of the client versions as well as the latest client version which is available according to your SCCM environment and details showing how many clients are currently deployed with the latest version and how many are still using older versions.
*Windows 10 Build Servicing Upgrades
*This section shows a pie chart of all of the Windows 10 build versions which are currently within the SCCM estate. Instead of displaying the latest build version available, we understand that every organisation may have a different build number target, so instead this section will have a filter which will allow you to choose which will be your target build number which will then show all of the machines which are currently on that version and which are using the lower version of your target build number.
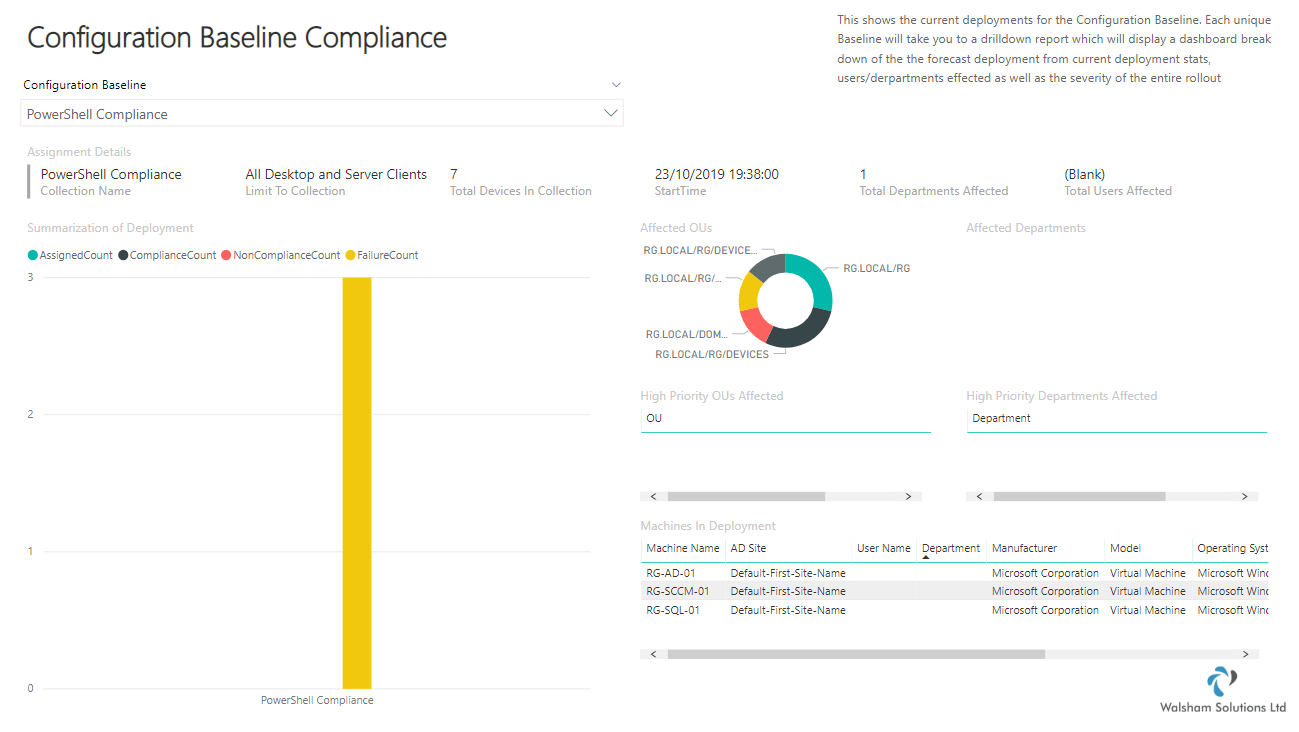
Configuration Baseline Compliance https://lirp-cdn.multiscreensite.com/c1f89e50/dms3rep/multi/opt/ConfigBaseline_QckdHMLbQ2rLvXs0dE54-1299x732-1920w.PNG
Figure 1.9 - Screenshot of Configuration Baseline Compliance page
Outlines the details of a current configuration baseline running, gauge an understanding on what the current success/compliance level is on yourpackagedeployment with the following details;
- Assignment Details - Shows all of the assignment details of the current deployment
- Summarization of Deployment - Bar chart detailing the compliance levels of the current deployment
- Affected Charts - Charts showing the Affected OUs and Affected Departments within the deployment to see where theconfiguration baseline will potentially be installed to.
- High Priority Charts - Related to the new severity feature which shows which high priority areas will be affected
- Machines in Deployment Table - Table shows all of the machines within the collection which theconfiguration baselinedeployment is aimed it so you can see and search each individual asset where necessary.
Where to Download
The SCCM Deployment PowerBI Dashboard can be download on the Technet Gallery on the following link
https://gallery.technet.microsoft.com/SCCM-Deployment-Dashboard-f2b395f5