Power BI : Analyze Performance
Introduction
In this article, we will explain How to measure the Power BI report using Performance Analyzer?

What's the Performance Analyzer
The Performance Analyzer is an awesome feature in Power BI Desktop that helps you to
- Analyze and measure the performance of each visuals in your Power BI dashboard / report.
- Record logs that measure the performance of each element when the user interact with them by filtering,cross highlighting, visual refresh ...etc.
- Help you to identify the visuals that impact the report performance and the reason of this impact.
Enable Performance Analyzer
To enable the Performance Analyzer,
- Go to View tab,
- Check the Performance Analyzer option.
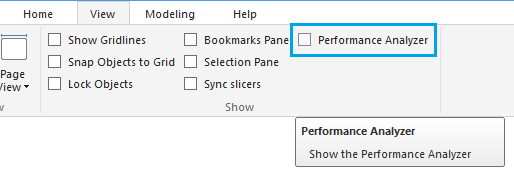
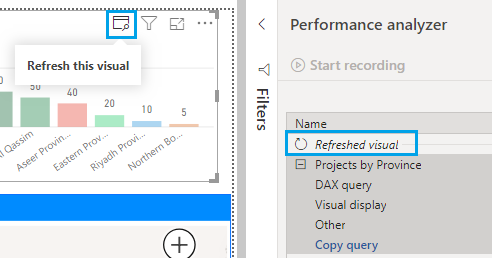
- The Performance Analyzer pane would be shown on the right side as shown below.
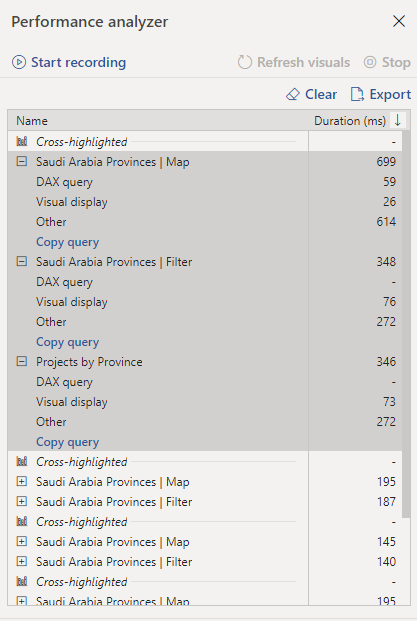
Monitor the Report Performance
The Performance analyzer measures the processing time as per user interaction!
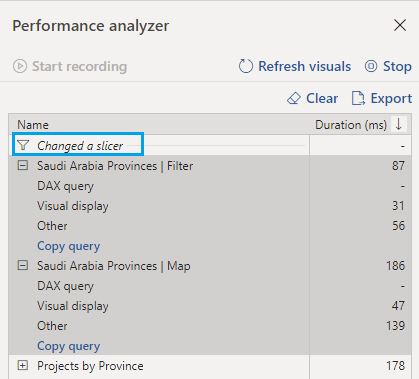
Any interaction taken like filters will be logged in the Performance Analyzer pane as shown below.
Note
The performance analyzer gathers and shows the performance measurement info in real-time.
Performance Analyzer Functionalities
To use Performance Analyzer, you should know its main functionalities:
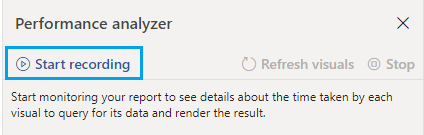
Start Recording
To start analyzing your visual interactions performance, you should first click on "Start Recording" button.
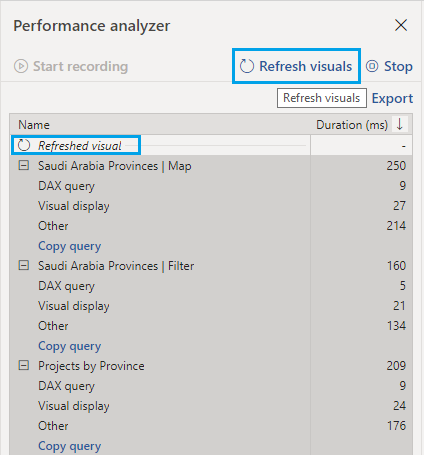
Refresh Visuals
After clicking on "Start Recording" button, you can do the following interactions to measure its performance impact:
- Refresh all Visuals.
- Refresh Specific Visual.
- Perform Cross Highlighting by clicking on a visual to filter or highlight other visuals.
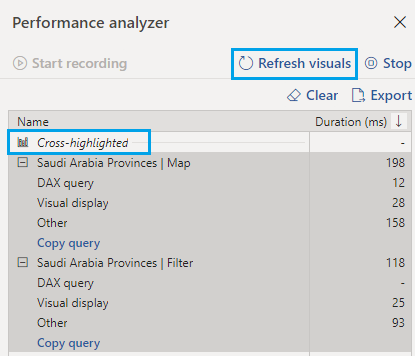
- Change slicer by using slicer to filter other visuals.
- Other.
Stop
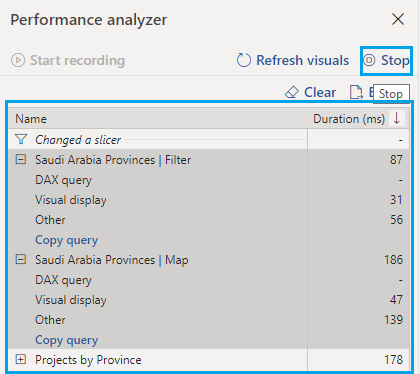
After performing the required interaction that you want to measure, click "Stop" button.
Don't worry, after clicking stop button, the log info will remain displayed in the pane.
Copy Query
If you would like to copy the query details for specific element, click on the "Copy Query" below each visual.
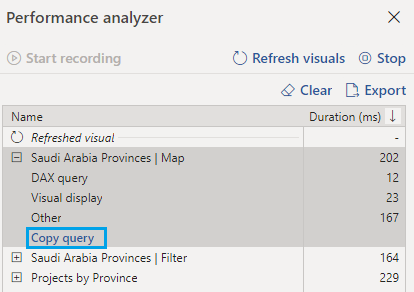
The copy query show the DAX Query structure if it's available!
The result looks like:
// DAX Query
DEFINE VAR __DS0FilterTable =
  FILTER(
    KEEPFILTERS(VALUES('Saudi Arabia Provinces'[Province])),
    AND(
      'Saudi Arabia Provinces'[Province] IN {"Al Bahah Province"},
      'Saudi Arabia Provinces'[Province] IN {"Al Bahah Province"}
    )
  )

EVALUATE
  TOPN(
    3502,
    SUMMARIZECOLUMNS(
      'Saudi Arabia Provinces'[Province],
      __DS0FilterTable,
      "SumProjects", IGNORE(CALCULATE(SUM('Saudi Arabia Provinces'[Projects]))),
      "AverageLon", CALCULATE(AVERAGE('Saudi Arabia Provinces'[Lon])),
      "AverageLat", CALCULATE(AVERAGE('Saudi Arabia Provinces'[Lat])),
      "MinColor", IGNORE(CALCULATE(MIN('Saudi Arabia Provinces'[Color])))
    ),
    'Saudi Arabia Provinces'[Province],
    1
  )

ORDER BY
  'Saudi Arabia Provinces'[Province]
Clear
After you finish, you can clear the log info by clicking on the "Clear" button.
Note
The cleared information is not saved, and you can't retrieve it back!
Export
To save a copy from the Performance Analyzer result, click on the "Export" button.
When click on the Export button, a new generated josn file will be exported "PowerBIPerformanceData.json" and you will be asked to save it in your prefer location.
**The exported file looks like **
{"version":"1.0.0","events":[{"name":"User Action","component":"Report Canvas","start":"2019-11-30T23:49:01.884Z","id":"d7fd7a5a0c67909140e1","metrics":{"sourceLabel":"UserAction_Refresh"}},{"name":"Visual Container Lifecycle","component":"Report Canvas","start":"2019-11-30T23:49:01.893Z","end":"2019-11-30T23:49:02.095Z","id":"85e80fe45c842e64eb3a","metrics":{"status":"finished","visualTitle":"Saudi Arabia Provinces | Map"}},{"name":"Query","component":"Report Canvas","start":"2019-11-30T23:49:01.894Z","end":"2019-11-30T23:49:02.072Z","id":"76da8f423590b217dc13","parentId":"85e80fe45c842e64eb3a"},{"name":"Render","component":"Report Canvas","start":"2019-11-30T23:49:02.072Z","end":"2019-11-30T23:49:02.095Z","id":"c0f90453b6e9a0d4a1a0","parentId":"85e80fe45c842e64eb3a"},{"name":"Data View Transform","component":"Report Canvas","start":"2019-11-30T23:49:02.087Z","end":"2019-11-30T23:49:02.088Z","id":"e62721c8d041c40d6b01","parentId":"c0f90453b6e9a0d4a1a0"},{"name":"Query Generation","component":"Report Canvas","start":"2019-11-30T23:49:01.934Z","end":"2019-11-30T23:49:01.937Z","id":"019a3a3d7559b75c1db1","parentId":"76da8f423590b217dc13"},{"name":"Execute Semantic Query","component":"DSE","start":"2019-11-30T23:49:02.026Z","end":"2019-11-30T23:49:02.042Z","id":"4e5c213d-125f-4454-b8b5-3ef3ef325aa3","parentId":"76da8f423590b217dc13"},{"name":"Execute DAX Query","component":"DSE","start":"2019-11-30T23:49:02.029Z","end":"2019-11-30T23:49:02.041Z","id":"ddcec87c-be0f-4409-84fc-3a78dba0723e","parentId":"4e5c213d-125f-4454-b8b5-3ef3ef325aa3","metrics":{"QueryText":"DEFINE VAR __DS0FilterTable = \r\n FILTER(\r\n KEEPFILTERS(VALUES('Saudi Arabia Provinces'[Province])),\r\n AND(\r\n 'Saudi Arabia Provinces'[Province] IN {\"Al Bahah Province\"},\r\n 'Saudi Arabia Provinces'[Province] IN {\"Al Bahah Province\"}\r\n )\r\n )\r\n\r\nEVALUATE\r\n TOPN(\r\n 3502,\r\n SUMMARIZECOLUMNS(\r\n 'Saudi Arabia Provinces'[Province],\r\n __DS0FilterTable,\r\n \"SumProjects\", IGNORE(CALCULATE(SUM('Saudi Arabia Provinces'[Projects]))),\r\n \"AverageLon\", CALCULATE(AVERAGE('Saudi Arabia Provinces'[Lon])),\r\n \"AverageLat\", CALCULATE(AVERAGE('Saudi Arabia Provinces'[Lat])),\r\n \"MinColor\", IGNORE(CALCULATE(MIN('Saudi Arabia Provinces'[Color])))\r\n ),\r\n 'Saudi Arabia Provinces'[Province],\r\n 1\r\n )\r\n\r\nORDER BY\r\n 'Saudi Arabia Provinces'[Province]","RowCount":1}},{"name":"Execute Query","component":"AS","start":"2019-11-30T23:49:02.033Z","end":"2019-11-30T23:49:02.040Z","id":"BBF910DF-F2A8-4CF8-AD34-A56BA64AA2DB","parentId":"ddcec87c-be0f-4409-84fc-3a78dba0723e"},{"name":"Serialize Rowset","component":"AS","start":"2019-11-30T23:49:02.040Z","end":"2019-11-30T23:49:02.040Z","id":"42388EB0-E577-4E62-8DE8-66694FB111A2","parentId":"BBF910DF-F2A8-4CF8-AD34-A56BA64AA2DB"},{"name":"Visual Container Lifecycle","component":"Report Canvas","start":"2019-11-30T23:49:01.902Z","end":"2019-11-30T23:49:02.066Z","id":"0acebcf656d51790e120","metrics":{"status":"finished","visualTitle":"Saudi Arabia Provinces | Filter"}},{"name":"Query","component":"Report Canvas","start":"2019-11-30T23:49:01.903Z","end":"2019-11-30T23:49:02.044Z","id":"9fed0d341a0ce7c4b5e5","parentId":"0acebcf656d51790e120"},{"name":"Render","component":"Report Canvas","start":"2019-11-30T23:49:02.041Z","end":"2019-11-30T23:49:02.066Z","id":"3c1ea9d610552078a2bc","parentId":"0acebcf656d51790e120"},{"name":"Data View Transform","component":"Report Canvas","start":"2019-11-30T23:49:02.051Z","end":"2019-11-30T23:49:02.053Z","id":"5a7130d313dbe96c2419","parentId":"3c1ea9d610552078a2bc"},{"name":"Query Generation","component":"Report Canvas","start":"2019-11-30T23:49:01.938Z","end":"2019-11-30T23:49:01.942Z","id":"fb72a4c61eda7d7c6a98","parentId":"9fed0d341a0ce7c4b5e5"},{"name":"Execute Semantic Query","component":"DSE","start":"2019-11-30T23:49:02.026Z","end":"2019-11-30T23:49:02.034Z","id":"d0a81ce2-c2e8-44b7-ad8f-11a657ba732e","parentId":"9fed0d341a0ce7c4b5e5"},{"name":"Execute DAX Query","component":"DSE","start":"2019-11-30T23:49:02.028Z","end":"2019-11-30T23:49:02.033Z","id":"0ef73e70-5dd9-446d-b761-2dc9776128bb","parentId":"d0a81ce2-c2e8-44b7-ad8f-11a657ba732e","metrics":{"QueryText":"EVALUATE\r\n TOPN(\r\n 101,\r\n VALUES('Saudi Arabia Provinces'[Province]),\r\n 'Saudi Arabia Provinces'[Province],\r\n 1\r\n )\r\n\r\nORDER BY\r\n 'Saudi Arabia Provinces'[Province]","RowCount":13}},{"name":"Execute Query","component":"AS","start":"2019-11-30T23:49:02.030Z","end":"2019-11-30T23:49:02.033Z","id":"102C0632-046D-458A-ACAE-6EF696B46CA4","parentId":"0ef73e70-5dd9-446d-b761-2dc9776128bb"},{"name":"Serialize Rowset","component":"AS","start":"2019-11-30T23:49:02.033Z","end":"2019-11-30T23:49:02.033Z","id":"E5CF7FFF-BDB4-4317-830F-E78C3A4690AF","parentId":"102C0632-046D-458A-ACAE-6EF696B46CA4"},{"name":"Visual Container Lifecycle","component":"Report Canvas","start":"2019-11-30T23:49:01.906Z","end":"2019-11-30T23:49:02.135Z","id":"c54d0553a07c02ca4605","metrics":{"status":"finished","visualTitle":"Projects by Province"}},{"name":"Query","component":"Report Canvas","start":"2019-11-30T23:49:01.907Z","end":"2019-11-30T23:49:02.115Z","id":"e5274512b50184c98317","parentId":"c54d0553a07c02ca4605"},{"name":"Render","component":"Report Canvas","start":"2019-11-30T23:49:02.115Z","end":"2019-11-30T23:49:02.135Z","id":"1bd640aa336246ecab0e","parentId":"c54d0553a07c02ca4605"},{"name":"Data View Transform","component":"Report Canvas","start":"2019-11-30T23:49:02.120Z","end":"2019-11-30T23:49:02.122Z","id":"9d61f52a7aca56190568","parentId":"1bd640aa336246ecab0e"},{"name":"Query Generation","component":"Report Canvas","start":"2019-11-30T23:49:01.943Z","end":"2019-11-30T23:49:01.945Z","id":"06fd8460610b90b8c684","parentId":"e5274512b50184c98317"},{"name":"Execute Semantic Query","component":"DSE","start":"2019-11-30T23:49:02.027Z","end":"2019-11-30T23:49:02.055Z","id":"dfd6335e-44b6-4d79-a280-791bd23b9219","parentId":"e5274512b50184c98317"},{"name":"Execute DAX Query","component":"DSE","start":"2019-11-30T23:49:02.029Z","end":"2019-11-30T23:49:02.049Z","id":"ce5bede8-ebe8-4595-8111-b26f3ccc408e","parentId":"dfd6335e-44b6-4d79-a280-791bd23b9219","metrics":{"QueryText":"DEFINE VAR __DS0FilterTable = \r\n TREATAS({\"Al Bahah Province\"}, 'Saudi Arabia Provinces'[Province])\r\n\r\nEVALUATE\r\n TOPN(\r\n 1001,\r\n SUMMARIZECOLUMNS(\r\n 'Saudi Arabia Provinces'[Province],\r\n __DS0FilterTable,\r\n \"SumProjects\", CALCULATE(SUM('Saudi Arabia Provinces'[Projects])),\r\n \"MinColor\", IGNORE(CALCULATE(MIN('Saudi Arabia Provinces'[Color])))\r\n ),\r\n [SumProjects],\r\n 0,\r\n 'Saudi Arabia Provinces'[Province],\r\n 1\r\n )\r\n\r\nORDER BY\r\n [SumProjects] DESC, 'Saudi Arabia Provinces'[Province]","RowCount":1}},{"name":"Execute Query","component":"AS","start":"2019-11-30T23:49:02.037Z","end":"2019-11-30T23:49:02.040Z","id":"E0A26444-6299-4BE6-8B9F-0D4014795173","parentId":"ce5bede8-ebe8-4595-8111-b26f3ccc408e"},{"name":"Serialize Rowset","component":"AS","start":"2019-11-30T23:49:02.040Z","end":"2019-11-30T23:49:02.040Z","id":"2EBB809A-0A32-4052-B66A-D92A62ECF847","parentId":"E0A26444-6299-4BE6-8B9F-0D4014795173"}]}
Performance Analyzer Categories
The duration log information that produced from the Performance Analyzer report categorized to three main categories:
- DAX Query.
- Visual Display.
- Other.
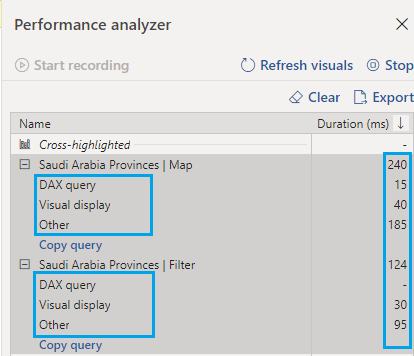
DAX Query
The time between the visual sending its query and the result being returned.
Visual Display
The time taken by the visual to render, including any external calls it made.
Other
Time spent waiting in a queue, or for the system to finish other background processing.
Applied to
- Power BI Desktop.
- Power BI Desktop for Report Server.
Conclusion
In this article, we have explained in details how to analyze and measure the Power BI dashboard / Report using Performance Analyzer.