SCOM - Alert basics
1. Introduction
In this Wiki article we’ll go through some basics about alerts in SCOM. An alert are for many just a simple “alert”, however an alert can actually tell us much more than the actual problem itself, it can provide us information of something bigger going on. Alert happens for a reason, most of the times it is due to a failure in a software or in the hardware, but it may also be a configuration error that we may have missed when setting up something.
We’ll also go through how the alerts are generated and how the alert process works.
2. Alerts 
Alerts help us to identify ongoing or upcoming issues that we may get within our data center, it may be either software or hardware related issues. It is important to fully understand the meaning of the alert(s) that we receive before taking any action.
Alert Classification
All alerts in SCOM have a classification, this means that each alert has its own priority, it will also have its own severity depending on how serious the issue is.
Alert Severity
There are a total of three (3) different alert in SCOM, much like in the Windows event log:
| Severity | ID |
| Informational | 0 |
| Warning | 1 |
| Critical | 2 |
Alert Priority
Similar to the alert severities, there are also a total of three (3) different alert priorities in SCOM:
| Priority | ID |
| Informational | 0 |
| Warning | 1 |
| Critical | 2 |
Alert priority is important, because it helps us determine how an alert should be processed, all management packs have a configured an alert priority for the alerts that may rise, but these priorities may not always be relevant according to our own environment and needs, therefore it's important that each organisation checks the priorities and configures them based on their environment and needs.
Alert Resolution States
When an alert gets generated the resolution state will always start with the resolution state of New (ID: 0). Resolution states helps the IT support or whoever is managing the SCOM alerts to identify the status of an alert.
By default there are a total of seven (7) different resolution states in SCOM:
| Resolution State | ID |
| New | 0 |
| Closed | 255 |
| Acknowledged | 249 |
| Assigned to Engineering | 248 |
| Awaiting Evidence |
247 |
| Resolved |
254 |
| Scheduled |
250 |
These can also be found in the Operations Console under the **Administration **pane, under **Security **> **Settings **> Alerts.

It is also possible to set custom resolution states, this can be done with solutions like System Center Orchestrator or PowerShell.
Each resolution state must have a unique ID, the IDs can range from 1 - 255, the default IDs cannot be used as they are already in use, the resolution state “descriptor” (Ex. “Assigned to Engineering”) can be anything.
3. Alert Generation
In SCOM there are two (2) possible ways of generating alerts:
- Alert generated by a Monitor

- Alert generated by a Rule

SCOM uses conditions for generating alerts, when a specific condition, or multiple conditions are met, only then will an alert be raised.
The condition could be for example:
- Whenever a specific event in the Windows event log occurs, we raise an alert.
- Whenever a service or operation is failing, we raise an alert.
Monitor 
A monitor measures the health of some aspect of a managed object, so what does this really mean?
A monitor can change its state between three (3) different states:
- **Healthy **(green)

- **Warning **(yellow)

- **Critical **(red)

When a monitor changes its state, let’s say from Healthy to Warning/Critical, the monitor will generate an alert.
To understand this better, let’s have a look at the graph below:

The graphs above describes which state changes can generate alerts from a monitor, an alert will only be generated if a monitor changes its state from Healthy to either Warning or Critical.
There are three (3) types of monitors available:

1. Unit Monitors
The unit monitor is the most common monitor, when we refer to a "monitor" we usually refer to a "unit monitor". A unit monitor will measure some aspects of an application, it could be running a script to check something, or look for a specific event in the event log that indicates an error.
In the image below we'll see an example of two unit monitors:

2. Dependency Rollup Monitors
A dependency monitor provides a health rollup between different classes, it will allow the health of a specific object to depend on the health of another object.
Similar to an aggregate rollup monitor, a dependency rollup monitor can be used to group other monitors to set the health state and generate alerts.
In the image below we'll see an example of how a dependency monitor works:

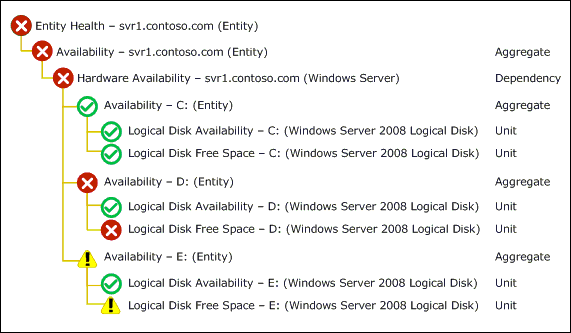
3. Aggregate Rollup Monitors
An aggregate rollup monitor provides a combined health state for similar monitors,
it reflects the state of unit, dependency rollup, or other aggregate rollup monitors targeted to an object.
You would typically use an aggregate rollup monitor to group multiple monitors into one monitor and then use that monitor to set the health state and generate an alert.
In the image below we'll see an example of how an aggregate monitor works:

The image below should give us a clear view of how all the monitors look like:
Example
We have a monitor Percentage of Committed Memory in Use for monitoring the memory usage on a critical production Windows Server:
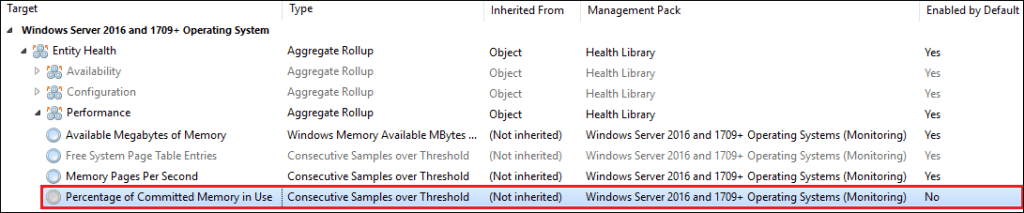
**Note: **The "Percentage of Committed Memory in Use" is disabled by default, an override has to be created to enable it.
The monitor has a threshold of 90% configured, this means that whenever the memory usage reaches 90% or above, an alert will be raised:
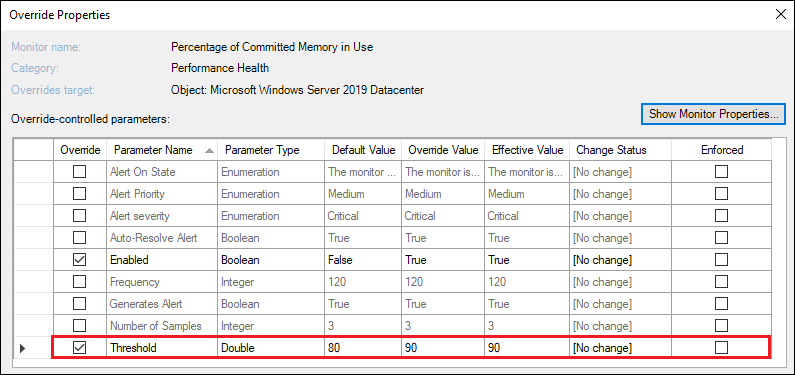
- If the memory usage is below 90% the monitor state will stay as Healthy
- If the memory usage is 90% or above the monitor state will change to Critical
and an alert will be generated (the monitor state is is configurable in the override)
What happens if a monitor reaches its threshold multiple times?
The alert monitor will not generate alerts as long as the monitor is in an critical state.
However if the monitor has returned to a healthy state, and the memory threshold is reached again, and the monitor state changes to Critical, an alert will be generated.
If the monitor is configured to send an alert for warning or critical, and the monitor has already sent an alert when the state changed to warning, the monitor will only send a second alert when the stage changes from warning to critical if the first alert has been closed.
If the alert that was sent when the state changed to warning remains open, no alert will be sent when the state changes from warning to critical.
Rule 
Rules do not affect the health state of a target object, this means that rules can send as many alerts as it wants as long as the condition that caused the alert remains true.
There are three (3) types of rules available:
↑ Back to top
1. Alert Rules
An alert rule is used when we want to be able to generate an alert when an event is detected, the list below shows the available alert rule templates:

2. Collection Rules
Collection rules are used whenever we want to collect either performance data or events, this data will then be stored in the Operations Manager database and data warehouse.
If we want to collect data, the data will be automatically converted to either event or performance data, depending on the collection rule that we create.
Below is the list of available collection rule templates:

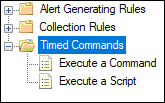
3. Command Rules
A command rule will basically run a script or a command on a schedule, below are the available templates:
Alert Suppression
To prevent a rule from "spamming" alerts we have the option to create an alert suppression. When an alert suppression is enabled for a rule it will increment a repeat counter and only send the first alert, while the rest of the alerts will be suppressed.
Note: Only duplicate alerts will be suppressed.
How can we check if a rule has generated many alerts?
In the Monitoring pane within the Operations Console, head to an alert view, right-click the upper toolbar and select Personalize view.

Next scroll down until we see Repeat Count, place a check mark in the check box and click OK.

We should now see the Repeat Count column in our alert view:

4. Monitor or Rule?
This is a quite common question that arises, when should we use a monitor instead of a rule? and vice versa?
Let's sum up some facts about monitors and rules:
- Both run workflows on a SCOM agent computer.
- Both can generate alerts.
- Both use similar set of data sources to detect conditions.
When to use a Monitor 
- When want to receive a health state of an object, in other words: we want to be able to see "traffic lights" of an object.
- When we want an alert to be automatically resolved, once the error condition has been cleared, the monitor is able to automatically detect if the problem has been resolved or not.
- When we want to use performance thresholds, because there are no rules available to generate an alert from a performance threshold.
- When we have a requirement that requires more complex logic, and isn't possible to achieve with rules.
Example
A Windows Server is monitored by SCOM, every evening there are scheduled workloads being run, these workloads cause very high CPU usage. During the running workloads an alert is generated for the total CPU utilization percentage, this also means the monitor will change its state from healthy to critical, this is OK as we are aware of the scheduled workloads.
Once the workload jobs have completed, the CPU utilization become idle, which means that the alert for the CPU utilization that was raised earlier is no longer true. In this case we want the alert to be automatically resolved and the health state of the monitor to become green (healthy) again, this will be achieved automatically when using a monitor, because the monitor will detect that the problem has been resolved and therefore change the health state back to healthy.
Why do health states matter? It's the colors that make a difference, or the "traffic lights" as some people call them, because we humans react fast on colors, especially the red color which according to studies encourages action.
Take for example a normal computer's hard drives in the image below:

One of the two hard drives is starting to fill up on disk space, the red color kind of "shouts" out to our eyes that something is wrong, it gives us a good indication that the disk requires interaction.
When to use a Rule
- When we want to collect performance counters or events for analysis and reporting.
- When we want to simply create an alert without any health states.
- When we want an alert to not be auto-closed.
How do we identify if an alert came from a Monitor or a Rule?
Every alert that we receive will tell us if the alert came from a rule or a monitor in the Alert Details.
Example
If an alert came from a rule, we will see something similar to this:

If an alert came from a monitor, we will see the something similar to the following:

We can also retrieve this information with PowerShell by running the Get-SCOMAlert cmdlet.
Example
Get-SCOMAlert -Name "Failed to Connect to Computer" | Select *
The command above will return all properties of a SCOM alert, the property that we are interested in is called "IsMonitorAlert" as shown in the image below:

- IsMonitorAlert = True (Alert was generated by a monitor)
- IsMonitorAlert = False (Alert was generated by a rule)
5. Alert Notifications
When SCOM generates an alert, the alert will be shown in an Alert View or in a Dashboard under the Monitoring pane in the Operations Console, SCOM can also notify individuals by sending the alert as a notification.
SCOM notifications consists of three (3) different components, all of these components are required to successfully send notifications:
- Channels
- Subscribers
- Subscriptions
Channels
SCOM uses "channels" this is the so called engine that will decide what type of notification we want to send, there are four (4) different ways of sending notifications in SCOM:
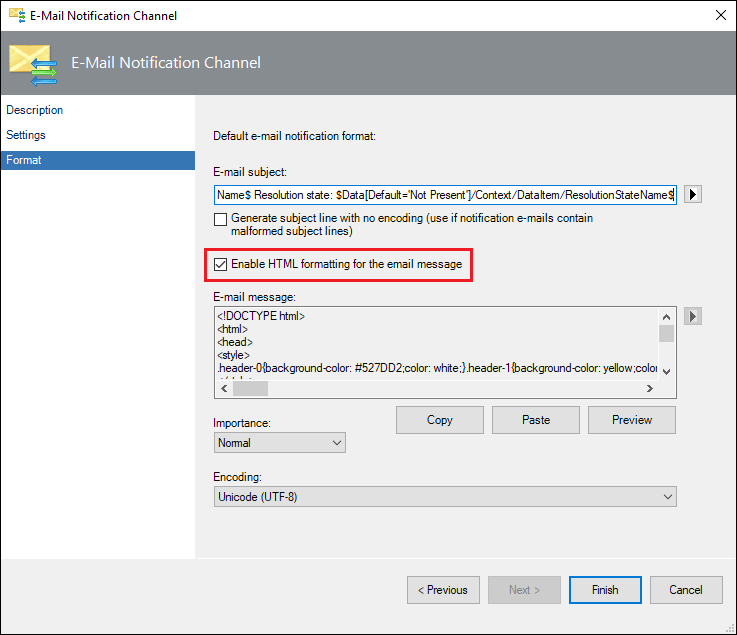
1. Email (SMTP) Notification Channel 
The email notification is the most commonly used way of sending notifications, SCOM supports sending emails by using both internal and external email authentications.
Since SCOM 2019 there has been a lot of enhancements in the email notifications, the subscription criteria has also been enhanced, SCOM 2019 now also supports email notifications in HTML format. Read more about it HERE.
Here's a comparison between SCOM 2016 and SCOM 2019:
SCOM 2016

SCOM 2019
2. Instant Message (IM) Notification Channel 
Notifications can also be send as instant messages, many organisations are using Skype for Business (previously known as Lync) as the main instant messaging communications program, with SCOM we can achieve to send instant messages directly to users on Skype for Business.
3. Text Message (SMS) Notification Channel 
SCOM is also able to send text messages, more commonly known as "SMS" (Short Message Service). For this to work we'll need either a SMS module or a modem where, which we'll need to insert a SIM card to be able to send SMS to recipients.
Sending SCOM alerts as SMS notifications are also quite commonly used in SCOM, this is a great way of sending very critical alerts or alerts with high importance.
4. Command Notification Channel 
SCOM is also able to make us of the commands, this can be used to run executable programs or scripts in response to an alert.
We can for example write to an event log, create a text file with the alert information or create a ticket to a ticketing system, or even use a scripts to send emails or SMS messages.
Subscribers
SCOM uses subscribers to define to whom and when we want to send notifications, a subscriber can be either a person, multiple persons or an email distribution list.
This is the only place where we are able to configure when SCOM should notify users of alerts.

Subscriptions
A subscription is where we define:
- The scope for the alert(s).
- The channel to be used.
- The subscriber(s) to be used.
- The criteria of what we want SCOM to notify.
Since SCOM 2019 there has been enhancements in the subscription criteria, it is now possible to use regular expressions to build complex criteria for our subscriptions.
Read more about this over HERE.
Subscription comparison between SCOM 2016 and SCOM 2019:
SCOM 2016

SCOM 2019

6. Conclusion
We've now briefly gone through the basics of SCOM alerts, some of it's properties and how they are generated. We should now be able to have a better understanding of what generates alerts and how notifications really work.