Windows 7: Application Crash Dump Analysis
For many years unhandled exceptions were the bane of my existence. On some occasions caused by me but mostly caused by other rouge developers (grin). There is a seedy underbelly to development which can be directly correlated to the dark alleys where things that are up to no good should stay. Unfortunately from time to time, these nasties do rear their ugly heads and for us developers they come in the form of unhandled exceptions.
In today’s world of .NET the tools that are provided for us are far beyond anything that we could have imagined 15 years ago. Although Dr Watson could generate crash dumps, most developers at the time had no idea what to do with them once they were generated, especially an old school Visual Basic 6 developer such as myself.
Windows Error Reporting
Crash dumps are a valuable resource for us developers and Windows 7 provides us with some great features for generating crash dumps through Windows Error Reporting (WER). It is where WER lives in the Registry that will be our starting point for this article, shown in Figure 1.

Figure 1: Location of WER in the Registry.
The registry key (LocalDumps) is not created by default for us in the registry so you will have to roll up your sleeves and do the dirty work yourself. A description of the values in the LocalDumps registry key is show in Table 1.
| Registry Value | Description |
| CustomDumpFlags | Will only be referenced if DumpType is set to 0. Table 2 shows all possible enumerations. |
| DumpCount | The limit of the number of dumps to be stored in the DumpFolder |
| DumpFolder | The folder that will store the dumps |
| DumpType | There are three possible values
1. 0 – Custom dump 2. 1 – Mini dump 3. 2 – Full dump |
Table 1: Description of LocalDumps registry key
If a Mini dump is too small or a full dump is too big then we have the option of creating a Custom dump. When the DumpType is set to 0, we are indicating to WER that we would like to generate the dump using the value in CustomDumpFlags. Table 2 shows all possible values for CustomDumpFlags
Minidump Type |
Value |
| MiniDumpNormal
MiniDumpWithDataSegs MiniDumpWithFullMemory MiniDumpWithHandleData MiniDumpFilterMemory MiniDumpScanMemory MiniDumpWithUnloadedModules MiniDumpWithIndirectlyReferenced MemoryMiniDumpFilterModulePaths MiniDumpWithProcessThreadData MiniDumpWithPrivateReadWriteMemory MiniDumpWithoutOptionalData MiniDumpWithFullMemoryInfo MiniDumpWithThreadInfo MiniDumpWithCodeSegs MiniDumpWithoutAuxiliaryState MiniDumpWithFullAuxiliaryState MiniDumpWithPrivateWriteCopyMemory MiniDumpIgnoreInaccessibleMemory MiniDumpWithTokenInformation |
0x00000000
0x00000001 0x00000002 0x00000004 0x00000008 0x00000010 0x00000020 0x00000040 0x00000080 0x00000100 0x00000200 0x00000400 0x00000800 0x00001000 0x00002000 0x00004000 0x00008000 0x00010000 0x00020000 0x00040000 |
Table< 2: Minidump Type Enumerations
Program Database Files (PDB)
Whenever you compile an application using either Debug or Release configuration, a PDB file will be generated along with the Portable Executable. Most developers throw these files away without any consideration for what they contain. In fact, PDB files are just as important as the Portable Executable. PDB files in general, contain a pointer to the source code and all of the symbols required to debug the Portable Executable. It is not the purpose of this article to go in depth with PDB Files. If you would to discover more about PDB Files then take a look at the following links.
- http://www.wintellect.com/CS/blogs/jrobbins/archive/2009/05/11/pdb-files-what-every-developer-must-know.aspx
- http://en.wikipedia.org/wiki/Program_database
Creating an Application to Crash
Now that we have a background on Crash dumps and PDB Files it is time to create an application that will crash and generate for us, a Crash dump. To do this we will create a Console application that generates a NullReferenceException. Of course, someone like yourself would never let an application fall over in this manner as you have full respect for exception handling. This is what one of those other developers would do, the ones that have loose morals and a blatant disregard for development standards.
- Open Visual Studio 2010
- File->New Project and select Console Application from the Visual Studio Templates
- Name the Application CrashDumpTest and click OK
- Switch the configuration from Debug to Release using the Configuration Manager
Here is where we will create an object of type generic List(Of String). We will not use the New keyword and as a result our List will contain a Null Reference. We then will try to add an item to the list. Navigate to the Main method of the console application and add the following code.
Dim l As List(Of String)
l.Add("string")
OK, all that is left now is to build the Console Application. After the application has been built do the following:
- 1. Navigate to the Release Folder which was the destination for your build
- 2. Open Windows Explorer and create a Folder on the C Drive called Temp
- 3. Copy CrashDumpTest.exe and CrashDumpTest.pdb to the Temp folder
NOTE: The reason why I’m asking you to do the above is so you can easily navigate to the PDB file later on in this article.
It is now time to execute CrashDumpTest.exe and generate a Crash Dump. My Crash dump will be generated in a folder C\Drives\Temp which is the value of DumpFolder registry value described earlier in this article. You can specify whatever folder you like. After running CrashDumpTest.exe the dialog in Figure 2 will be displayed.

Figure 2: Windows Error Reporting Dialog after application crash
Rather than debugging the program from here, we will choose Close Program. We are trying to simulate the scenario where a user of your application has sent you the dump file and we will open the dump file directly from the file system in Visual Studio 2010.
Figure 3 shows the Crash dump file in Windows Explorer

Figure 3: Crash dump file generated by Window Error Reporting
Opening and Analyse a Dump File in Visual Studio 2010
In earlier versions of Visual Studio you had the option of creating a Dump Project. This has changed in Visual Studio 2010. Do the following to open your dump file in Visual Studio 2010.
- Open Visual Studio 2010
- File->Open File, navigate to your Dump folder and select the CrashDumpTest dump file shown in Figure 3
Upon opening the Crash dump in Visual Studio 2010 you will be presented with the following information.
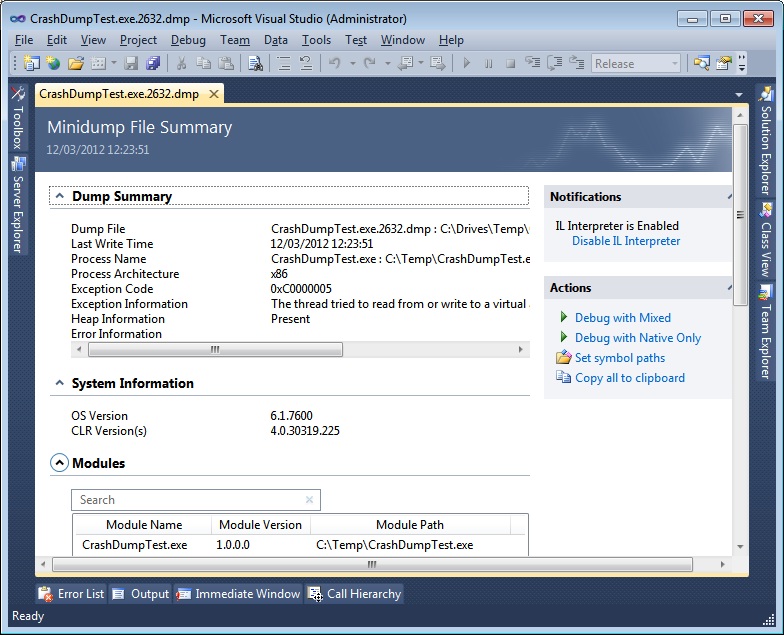
Figure 4: Illustrate a Crush dump file opened in Visual Studio 2010
At this point we are ready to debug our Crash dump. Let me just make this clear. To debug a crash dump is a bit of a misconception as you cannot actually step through the code. Visual Studio will actually load a snapshot of when the application failed. There is something I should mention about what is in the Dump Summary in Figure 4. Notice that Heap Information is Present. The advantage of having the Heap Information present is that when we do analyse our Crash dump we will have DataTips available. Our watch window can also be populated with reference type information.
Using the Actions expander on the right of Figure 4, click the Debug with Mixed. This will allow us to analyse our .NET code.
The first dialog that will appear is shown in Figure 5

Figure 5: Visual Studio Dialog when we start debugging a Crash Dump
Select Break on the dialog show in Figure 5. The screen shot of Visual Studio in Figure 6 will appear. Don’t be disheartened from what you initially see. We haven’t yet specified a location for our PDB File. Also, note that the Call Stack window is shown in Figure 6. To show the Call Stack window, Select on the menu Debug->Windows->Call Stack

Figure 6: Visual Studio showing No Source Available when PDB File is not specified.
To specify the location of your PDB File, on the Menu choose Debug->Options and Settings. The dialog in Figure 7 will appear.
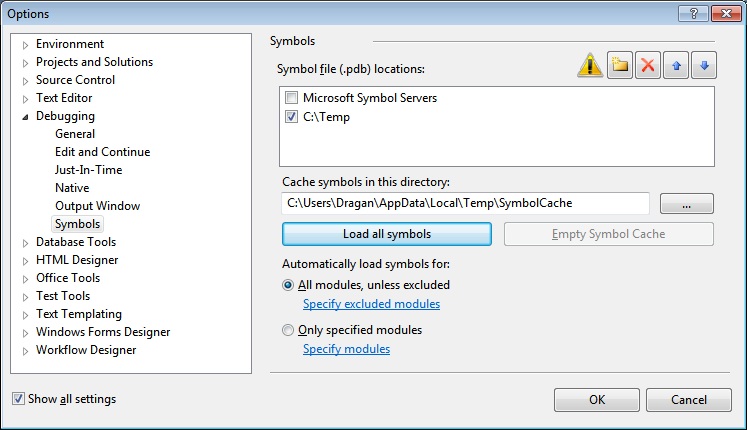
Figure 7: Debug Settings and Options Dialog
Select the Symbols tree item that is located under the Debugging tree item. You can add a folder to the Symbol file (.pdb) locations by clicking the yellow folder button on the top right of the screen show in Figure 7. Remember in the Creating the Application to Crash section of this article I asked you to copy your PDB file into the C:\Temp folder. Well, this is the reason why. Add C:\Temp to the symbol location. Once you have added the folder click the Load All Symbols button. This will load our symbols into the current process. Click OK to close the dialog.
Figure 8 now shows the results of our previous operation. Actually, what is shown in Figure 8 does not immediately appear. The Call Stack window now shows our CrashDumpTest.exe which it did not in Figure 6. To display our code you have to double click on our CrashDumpTest.exe in the Call Stack window.

Figure 8: Crash dump with Code window and Symbols loaded
Conclusion
That brings us to the conclusion of this article. After today you should have the skills to setup Windows Error Reporting to generate dump files, understand the importance of PDB files and also know how to open and analyse a Crash dump in Visual Studio 2010.