Examine node and pod health
This article is part of a series. Start with the overview.
If the cluster checks that you performed in the previous step are clear, check the health of the Azure Kubernetes Service (AKS) worker nodes. Follow the six steps in this article to check the health of nodes, determine the reason for an unhealthy node, and resolve the issue.
Step 1: Check the health of worker nodes
Various factors can contribute to unhealthy nodes in an AKS cluster. One common reason is the breakdown of communication between the control plane and the nodes. This miscommunication is often caused by misconfigurations in routing and firewall rules.
When you configure your AKS cluster for user-defined routing, you must configure egress paths via a network virtual appliance (NVA) or a firewall, such as an Azure firewall. To address a misconfiguration issue, we recommend that you configure the firewall to allow the necessary ports and fully qualified domain names (FQDNs) in accordance with the AKS egress traffic guidance.
Another reason for unhealthy nodes might be inadequate compute, memory, or storage resources that create kubelet pressures. In such cases, scaling up the resources can effectively resolve the problem.
In a private AKS cluster, Domain Name System (DNS) resolution problems can cause communication issues between the control plane and the nodes. You must verify that the Kubernetes API server DNS name resolves to the private IP address of the API server. Incorrect configuration of a custom DNS server is a common cause of DNS resolution failures. If you use custom DNS servers, ensure that you correctly specify them as DNS servers on the virtual network where nodes are provisioned. Also confirm that the AKS private API server can be resolved via the custom DNS server.
After you address these potential issues related to control plane communication and DNS resolution, you can effectively tackle and resolve node health problems within your AKS cluster.
You can evaluate the health of your nodes by using one of the following methods.
Azure Monitor containers health view
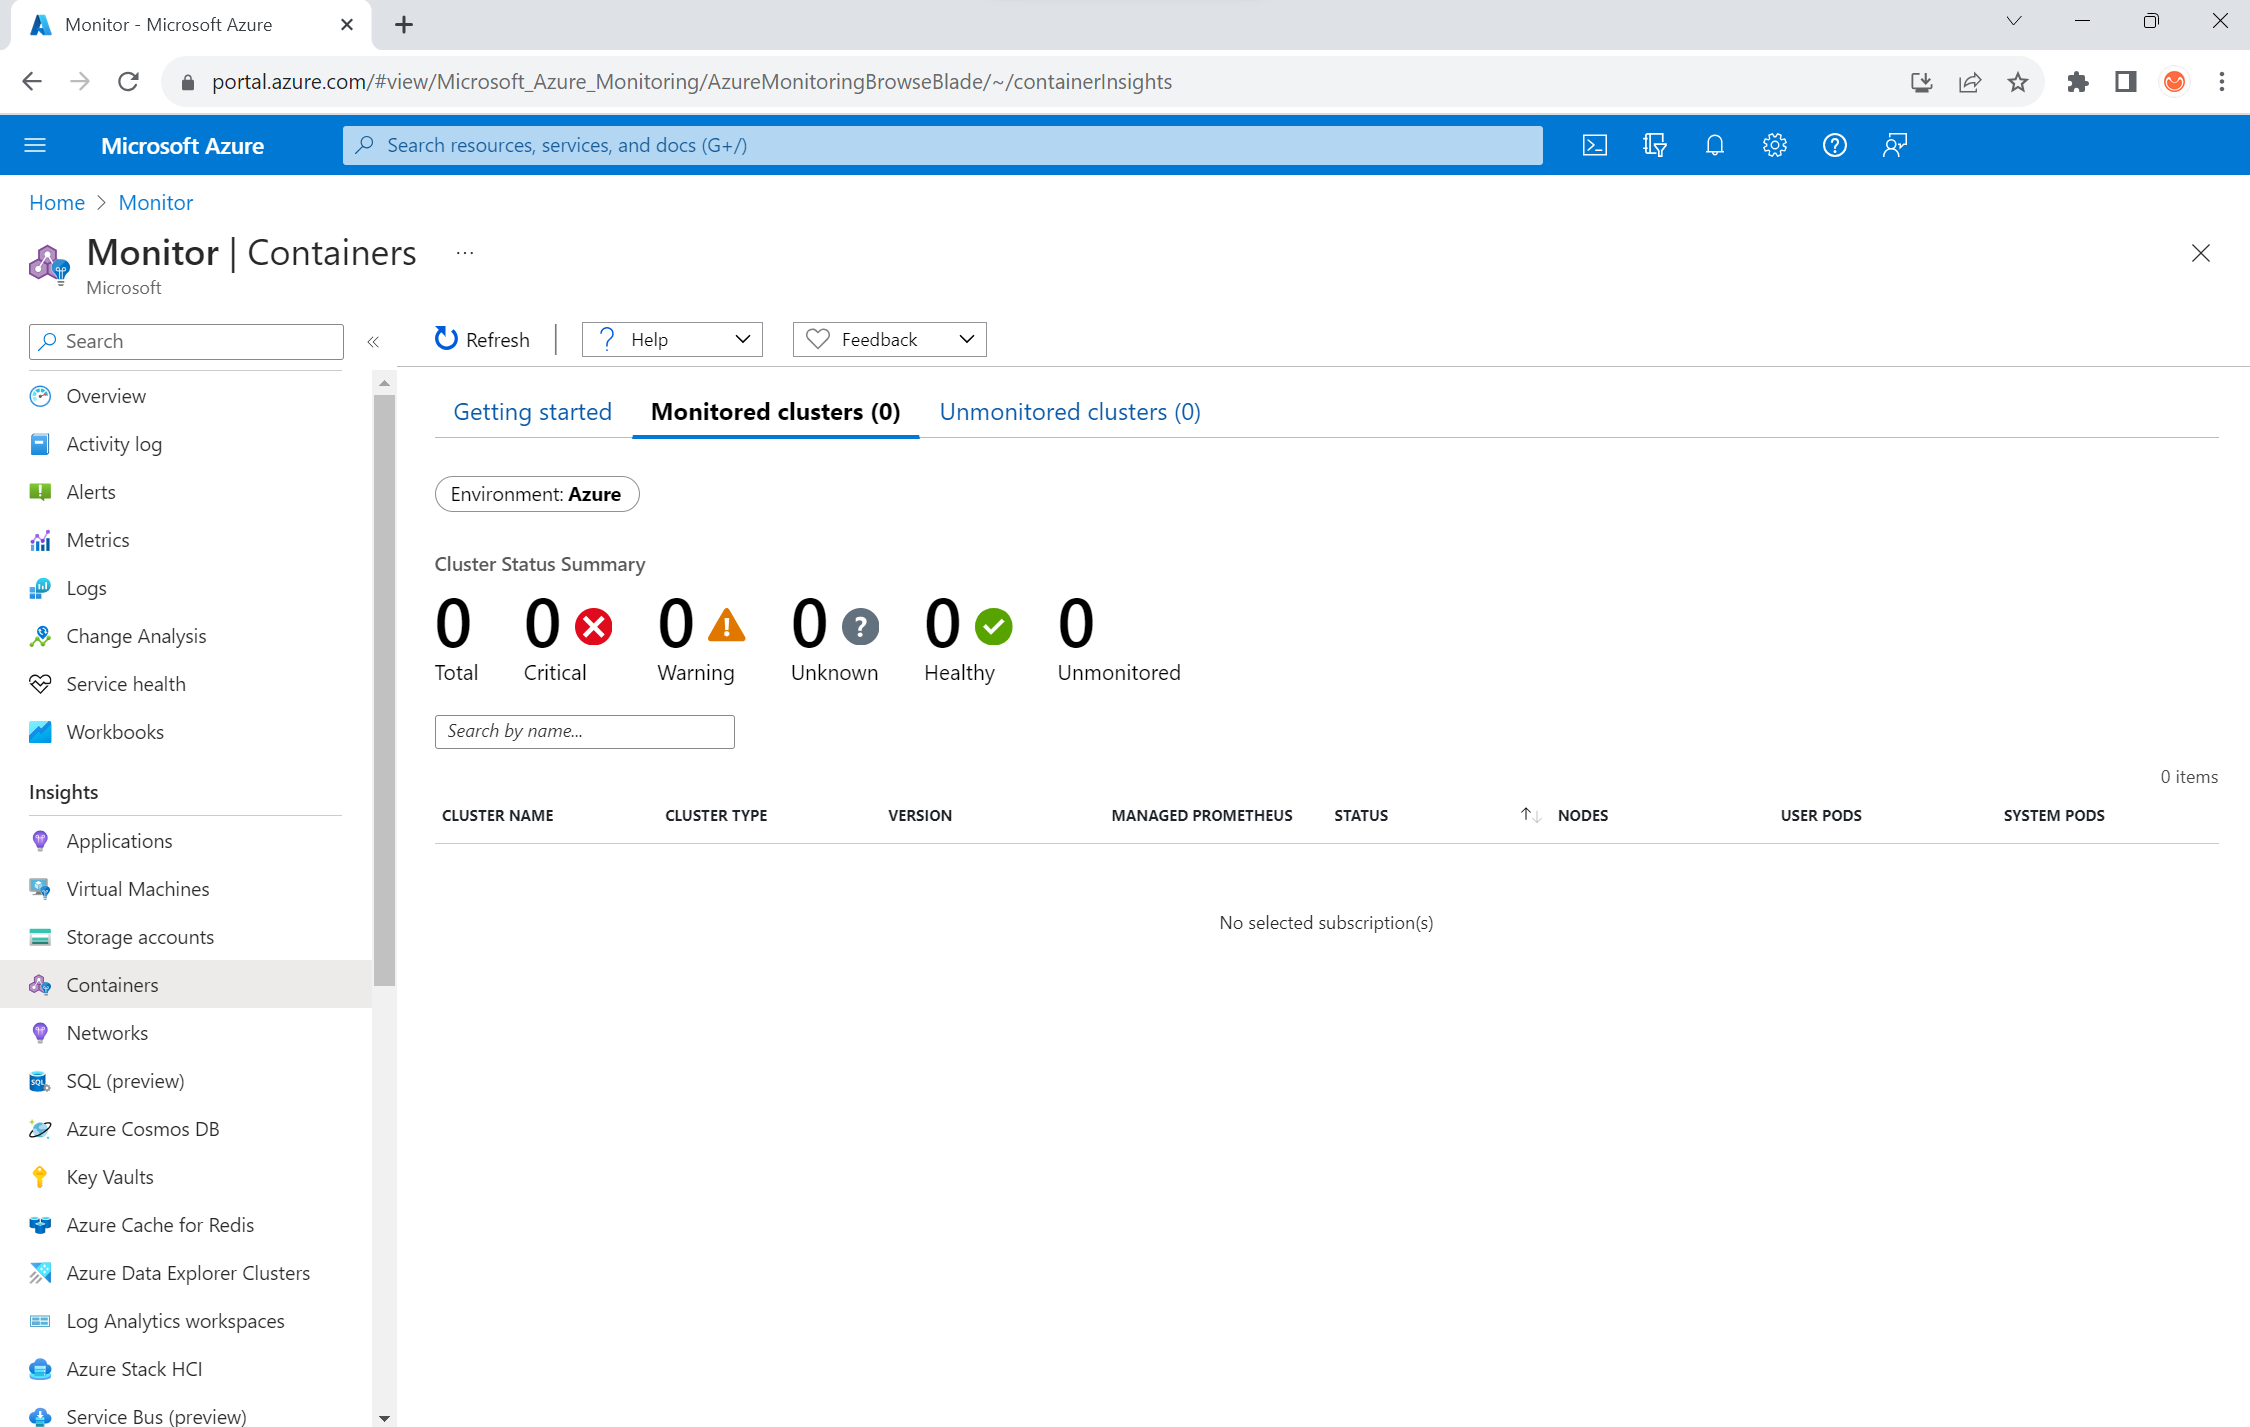
To view the health of nodes, user pods, and system pods in your AKS cluster, follow these steps:
- In the Azure portal, go to Azure Monitor.
- In the Insights section of the navigation pane, select Containers.
- Select Monitored clusters for a list of the AKS clusters that are being monitored.
- Choose an AKS cluster from the list to view the health of the nodes, user pods, and system pods.
AKS nodes view
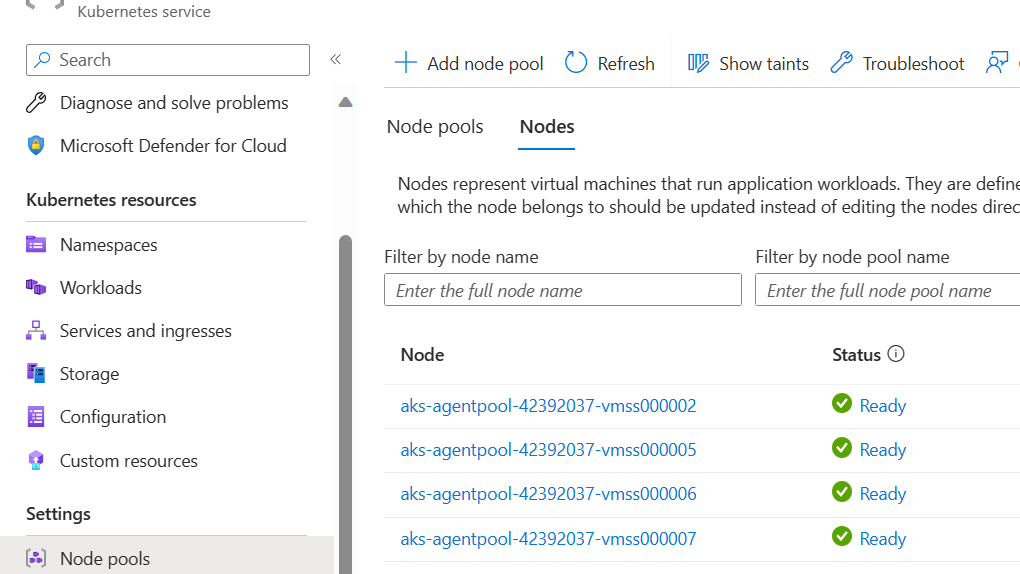
To ensure that all nodes in your AKS cluster are in the ready state, follow these steps:
- In the Azure portal, go to your AKS cluster.
- In the Settings section of the navigation pane, select Node pools.
- Select Nodes.
- Verify that all nodes are in the ready state.
In-cluster monitoring with Prometheus and Grafana
If you deployed Prometheus and Grafana in your AKS cluster, you can use the K8 Cluster Detail Dashboard to get insights. This dashboard shows Prometheus cluster metrics and presents vital information, such as CPU usage, memory usage, network activity, and file system usage. It also shows detailed statistics for individual pods, containers, and systemd services.
In the dashboard, select Node conditions to see metrics about the health and performance of your cluster. You can track nodes that might have issues, such as issues with their schedule, the network, disk pressure, memory pressure, proportional integral derivative (PID) pressure, or disk space. Monitor these metrics, so you can proactively identify and address any potential issues that affect the availability and performance of your AKS cluster.
Monitor managed service for Prometheus and Azure Managed Grafana
You can use prebuilt dashboards to visualize and analyze Prometheus metrics. To do so, you must set up your AKS cluster to collect Prometheus metrics in Monitor managed service for Prometheus, and connect your Monitor workspace to an Azure Managed Grafana workspace. These dashboards provide a comprehensive view of your Kubernetes cluster's performance and health.
The dashboards are provisioned in the specified Azure Managed Grafana instance in the Managed Prometheus folder. Some dashboards include:
- Kubernetes / Compute Resources / Cluster
- Kubernetes / Compute Resources / Namespace (Pods)
- Kubernetes / Compute Resources / Node (Pods)
- Kubernetes / Compute Resources / Pod
- Kubernetes / Compute Resources / Namespace (Workloads)
- Kubernetes / Compute Resources / Workload
- Kubernetes / Kubelet
- Node Exporter / USE Method / Node
- Node Exporter / Nodes
- Kubernetes / Compute Resources / Cluster (Windows)
- Kubernetes / Compute Resources / Namespace (Windows)
- Kubernetes / Compute Resources / Pod (Windows)
- Kubernetes / USE Method / Cluster (Windows)
- Kubernetes / USE Method / Node (Windows)
These built-in dashboards are widely used in the open-source community for monitoring Kubernetes clusters with Prometheus and Grafana. Use these dashboards to see metrics, such as resource usage, pod health, and network activity. You can also create custom dashboards that are tailored to your monitoring needs. Dashboards help you to effectively monitor and analyze Prometheus metrics in your AKS cluster, which enables you to optimize performance, troubleshoot issues, and ensure smooth operation of your Kubernetes workloads.
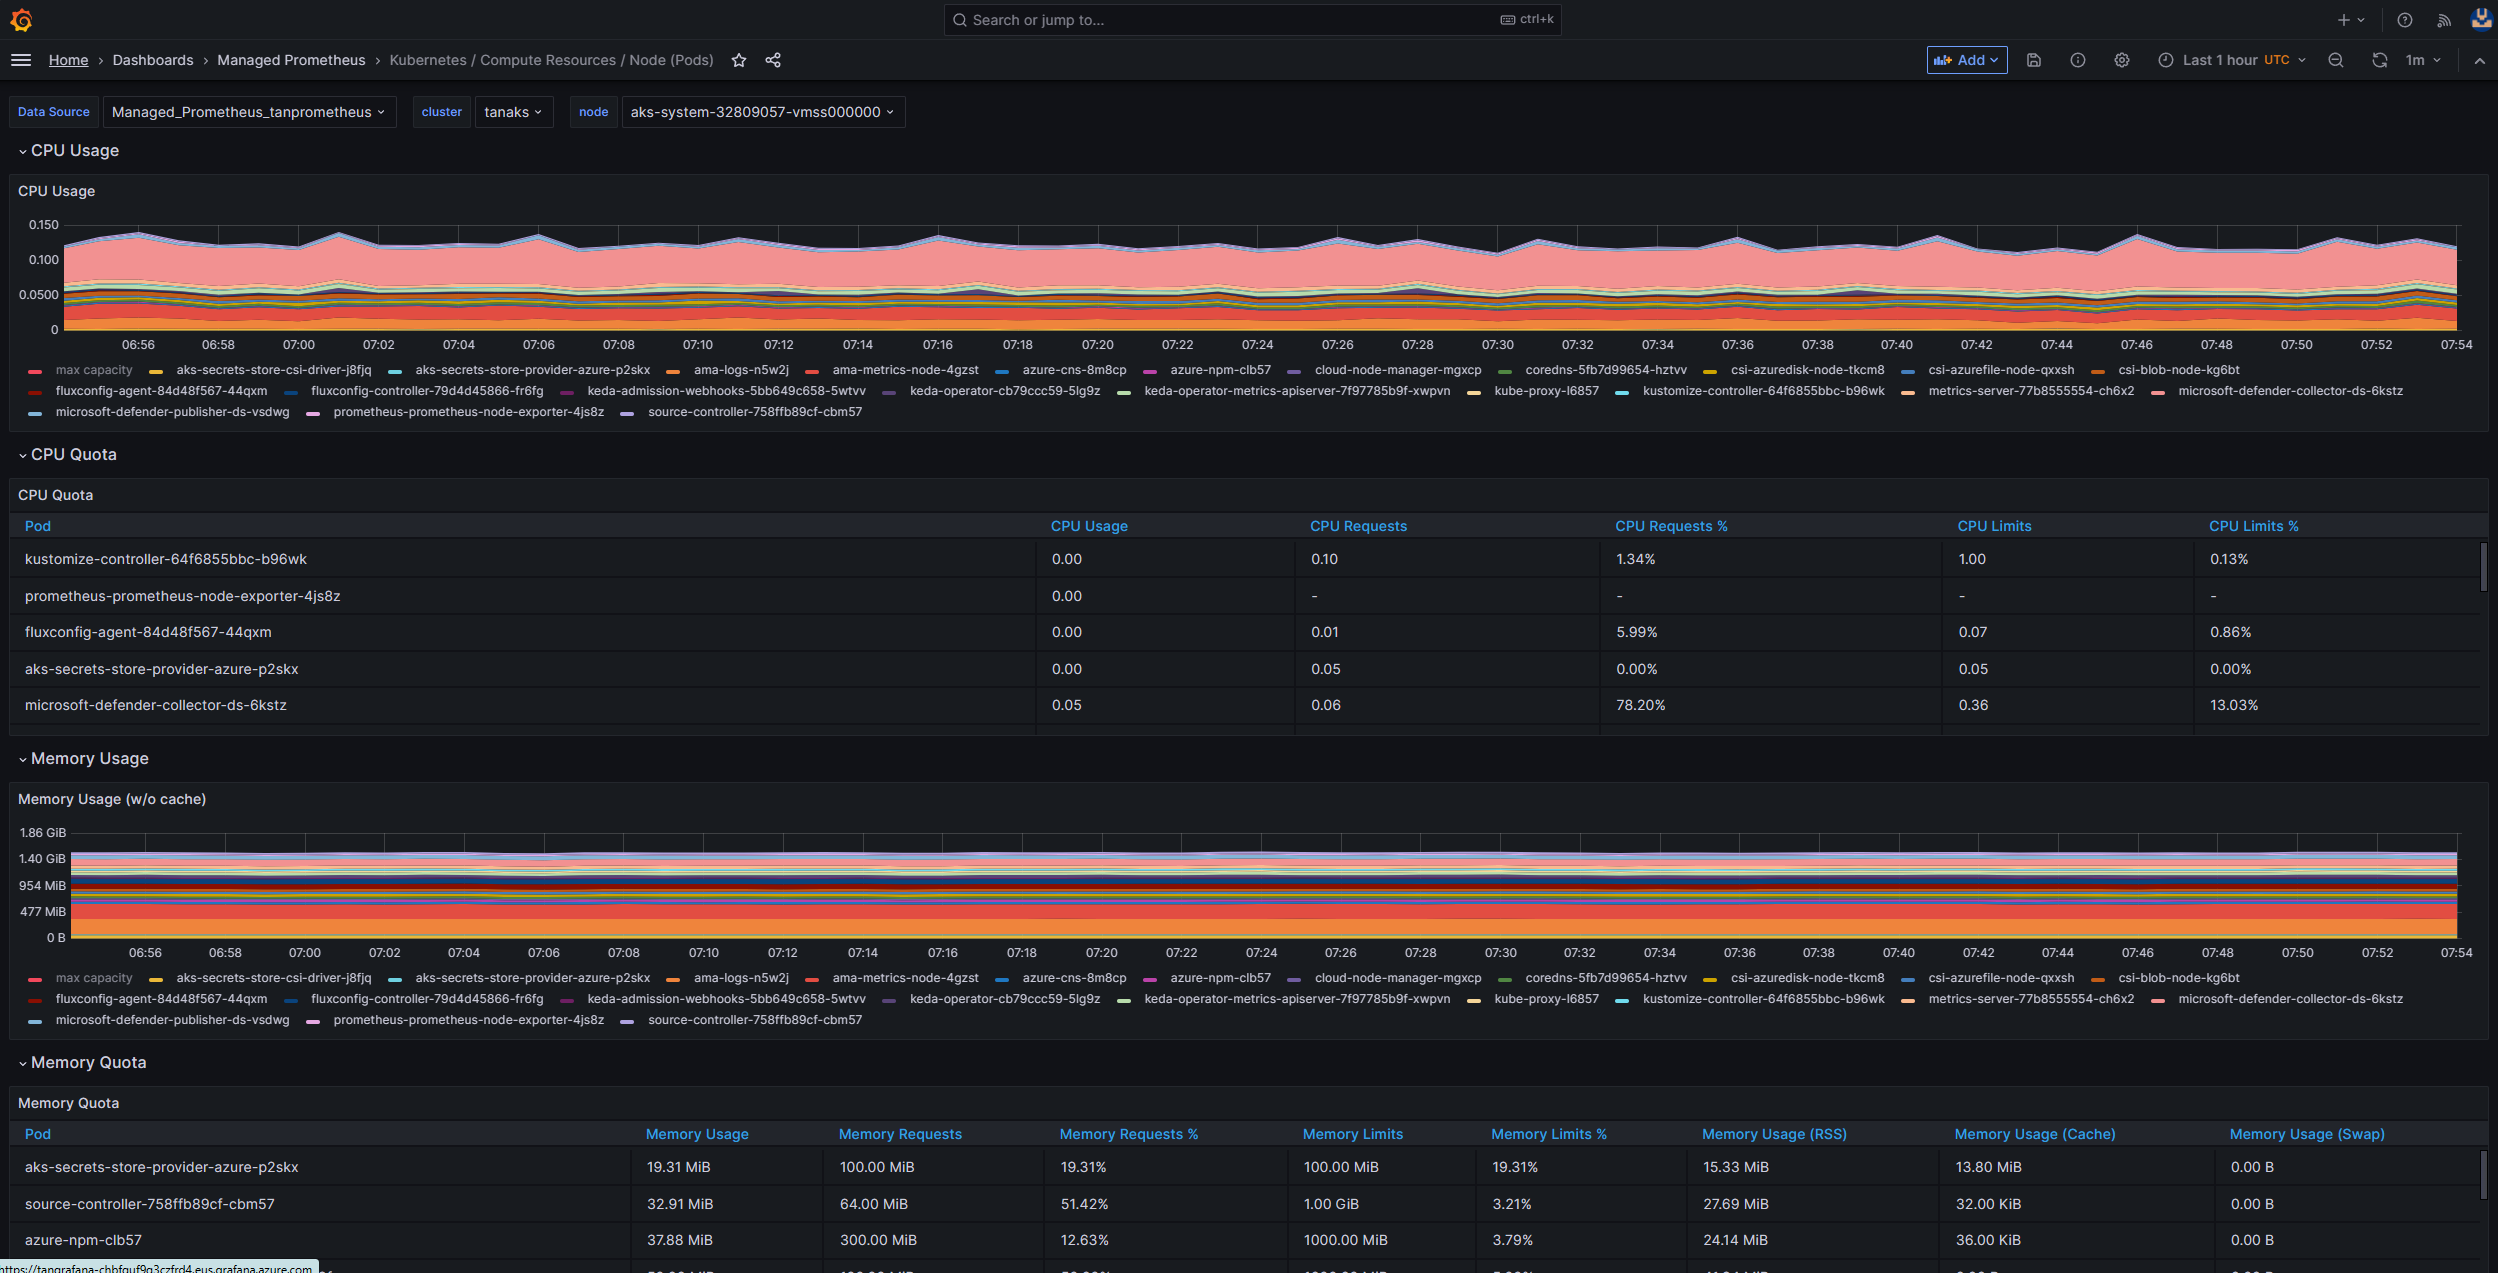
You can use the Kubernetes / Compute Resources / Node (Pods) dashboard to see metrics for your Linux agent nodes. You can visualize the CPU usage, CPU quota, memory usage, and memory quota for each pod.
If your cluster includes Windows agent nodes, you can use the Kubernetes / USE Method / Node (Windows) dashboard to visualize the Prometheus metrics that are collected from these nodes. This dashboard provides a comprehensive view of resource consumption and performance for Windows nodes within your cluster.
Take advantage of these dedicated dashboards so you can easily monitor and analyze important metrics related to CPU, memory, and other resources in both Linux and Windows agent nodes. This visibility enables you to identify potential bottlenecks, optimize resource allocation, and ensure efficient operation across your AKS cluster.
Step 2: Verify the control plane and worker node connectivity
If worker nodes are healthy, you should examine the connectivity between the managed AKS control plane and the cluster worker nodes. AKS enables communication between the Kubernetes API server and individual node kubelets via a secure tunnel communication method. These components can communicate even if they're on different virtual networks. The tunnel is protected with Mutual Transport Layer Security (mTLS) encryption. The primary tunnel that AKS uses is called Konnectivity(formerly known as apiserver-network-proxy). Ensure that all network rules and FQDNs comply with the required Azure network rules.
To verify the connectivity between the managed AKS control plane and the cluster worker nodes of an AKS cluster, you can use the kubectl command-line tool.
To ensure that the Konnectivity agent pods work properly, run the following command:
kubectl get deploy konnectivity-agent -n kube-system
Make sure that the pods are in a ready state.
If there's an issue with the connectivity between the control plane and the worker nodes, establish the connectivity after you ensure that the required AKS egress traffic rules are allowed.
Run the following command to restart the konnectivity-agent pods:
kubectl rollout restart deploy konnectivity-agent -n kube-system
If restarting the pods doesn't fix the connection, check the logs for any anomalies. Run the following command to view the logs of the konnectivity-agent pods:
kubectl logs -l app=konnectivity-agent -n kube-system --tail=50
The logs should show the following output:
I1012 12:27:43.521795       1 options.go:102] AgentCert set to "/certs/client.crt".
I1012 12:27:43.521831       1 options.go:103] AgentKey set to "/certs/client.key".
I1012 12:27:43.521834       1 options.go:104] CACert set to "/certs/ca.crt".
I1012 12:27:43.521837       1 options.go:105] ProxyServerHost set to "sethaks-47983508.hcp.switzerlandnorth.azmk8s.io".
I1012 12:27:43.521841       1 options.go:106] ProxyServerPort set to 443.
I1012 12:27:43.521844       1 options.go:107] ALPNProtos set to [konnectivity].
I1012 12:27:43.521851       1 options.go:108] HealthServerHost set to
I1012 12:27:43.521948       1 options.go:109] HealthServerPort set to 8082.
I1012 12:27:43.521956       1 options.go:110] AdminServerPort set to 8094.
I1012 12:27:43.521959       1 options.go:111] EnableProfiling set to false.
I1012 12:27:43.521962       1 options.go:112] EnableContentionProfiling set to false.
I1012 12:27:43.521965       1 options.go:113] AgentID set to b7f3182c-995e-4364-aa0a-d569084244e4.
I1012 12:27:43.521967       1 options.go:114] SyncInterval set to 1s.
I1012 12:27:43.521972       1 options.go:115] ProbeInterval set to 1s.
I1012 12:27:43.521980       1 options.go:116] SyncIntervalCap set to 10s.
I1012 12:27:43.522020       1 options.go:117] Keepalive time set to 30s.
I1012 12:27:43.522042       1 options.go:118] ServiceAccountTokenPath set to "".
I1012 12:27:43.522059       1 options.go:119] AgentIdentifiers set to .
I1012 12:27:43.522083       1 options.go:120] WarnOnChannelLimit set to false.
I1012 12:27:43.522104       1 options.go:121] SyncForever set to false.
I1012 12:27:43.567902       1 client.go:255] "Connect to" server="e9df3653-9bd4-4b09-b1a7-261f6104f5d0"
Note
When an AKS cluster is set up with an API server virtual network integration and either an Azure container networking interface (CNI) or an Azure CNI with dynamic pod IP assignment, there's no need to deploy Konnectivity agents. The integrated API server pods can establish direct communication with the cluster worker nodes via private networking.
However, when you use API server virtual network integration with Azure CNI Overlay or bring your own CNI (BYOCNI), Konnectivity is deployed to facilitate communication between the API servers and pod IPs. The communication between the API servers and the worker nodes remains direct.
You can also search the container logs in the logging and monitoring service to retrieve the logs. For an example that searches for aks-link connectivity errors, see Query logs from container insights.
Run the following query to retrieve the logs:
ContainerLogV2
| where _ResourceId =~ "/subscriptions/<subscription-ID>/resourceGroups/<resource-group-name>/providers/Microsoft.ContainerService/managedClusters/<cluster-ID>" // Use the IDs and names of your resources for these values.
| where ContainerName has "aks-link"
| project LogSource,LogMessage, TimeGenerated, Computer, PodName, ContainerName, ContainerId
| order by TimeGenerated desc
| limit 200
Run the following query to search container logs for any failed pod in a specific namespace:
let KubePodInv = KubePodInventory
    | where TimeGenerated >= startTime and TimeGenerated < endTime
    | where _ResourceId =~ "<cluster-resource-ID>" // Use your resource ID for this value.
    | where Namespace == "<pod-namespace>" // Use your target namespace for this value.
    | where PodStatus == "Failed"
    | extend ContainerId = ContainerID
    | summarize arg_max(TimeGenerated, *)  by  ContainerId, PodStatus, ContainerStatus
    | project ContainerId, PodStatus, ContainerStatus;

    KubePodInv
    | join
    (
        ContainerLogV2
    | where TimeGenerated >= startTime and TimeGenerated < endTime
    | where PodNamespace == "<pod-namespace>" //update with target namespace
    ) on ContainerId
    | project TimeGenerated, PodName, PodStatus, ContainerName, ContainerId, ContainerStatus, LogMessage, LogSource
If you can't get the logs by using queries or the kubectl tool, use Secure Shell (SSH) authentication. This example finds the tunnelfront pod after connecting to the node via SSH.
kubectl pods -n kube-system -o wide | grep tunnelfront
ssh azureuser@<agent node pod is on, output from step above>
docker ps | grep tunnelfront
docker logs …
nslookup <ssh-server_fqdn>
ssh -vv azureuser@<ssh-server_fqdn> -p 9000
docker exec -it <tunnelfront_container_id> /bin/bash -c "ping bing.com"
kubectl get pods -n kube-system -o wide | grep <agent_node_where_tunnelfront_is_running>
kubectl delete po <kube_proxy_pod> -n kube-system
Step 3: Validate DNS resolution when restricting egress
DNS resolution is a crucial aspect of your AKS cluster. If DNS resolution isn't functioning correctly, it can cause control plane errors or container image pull failures. To ensure that DNS resolution to the Kubernetes API server is functioning correctly, follow these steps:
Run the kubectl exec command to open a command shell in the container that's running in the pod.
kubectl exec --stdin --tty your-pod --namespace <namespace-name> -- /bin/bashCheck whether the nslookup or dig tools are installed in the container.
If neither tool is installed in the pod, run the following command to create a utility pod in the same namespace.
kubectl run -i --tty busybox --image=busybox --namespace <namespace-name> --rm=true -- shYou can retrieve the API server address from the overview page of your AKS cluster in the Azure portal, or you can run the following command.
az aks show --name <aks-name> --resource-group <resource-group-name> --query fqdn --output tsvRun the following command to attempt to resolve the AKS API server. For more information, see Troubleshoot DNS resolution failures from inside the pod but not from the worker node.
nslookup myaks-47983508.hcp.westeurope.azmk8s.ioCheck the upstream DNS server from the pod to determine whether the DNS resolution is working correctly. For example, for Azure DNS, run the
nslookupcommand.nslookup microsoft.com 168.63.129.16If the previous steps don't provide insights, connect to one of the worker nodes, and attempt DNS resolution from the node. This step helps to identify whether the problem is related to AKS or the networking configuration.
If DNS resolution is successful from the node but not from the pod, the problem might be related to Kubernetes DNS. For steps to debug DNS resolution from the pod, see Troubleshoot DNS resolution failures.
If DNS resolution fails from the node, review the networking setup to ensure that the appropriate routing paths and ports are open to facilitate DNS resolution.
Step 4: Check for kubelet errors
Verify the condition of the kubelet process that runs on each worker node, and ensure that it's not under any pressure. Potential pressure might pertain to CPU, memory, or storage. To verify the status of individual node kubelets, you can use one of the following methods.
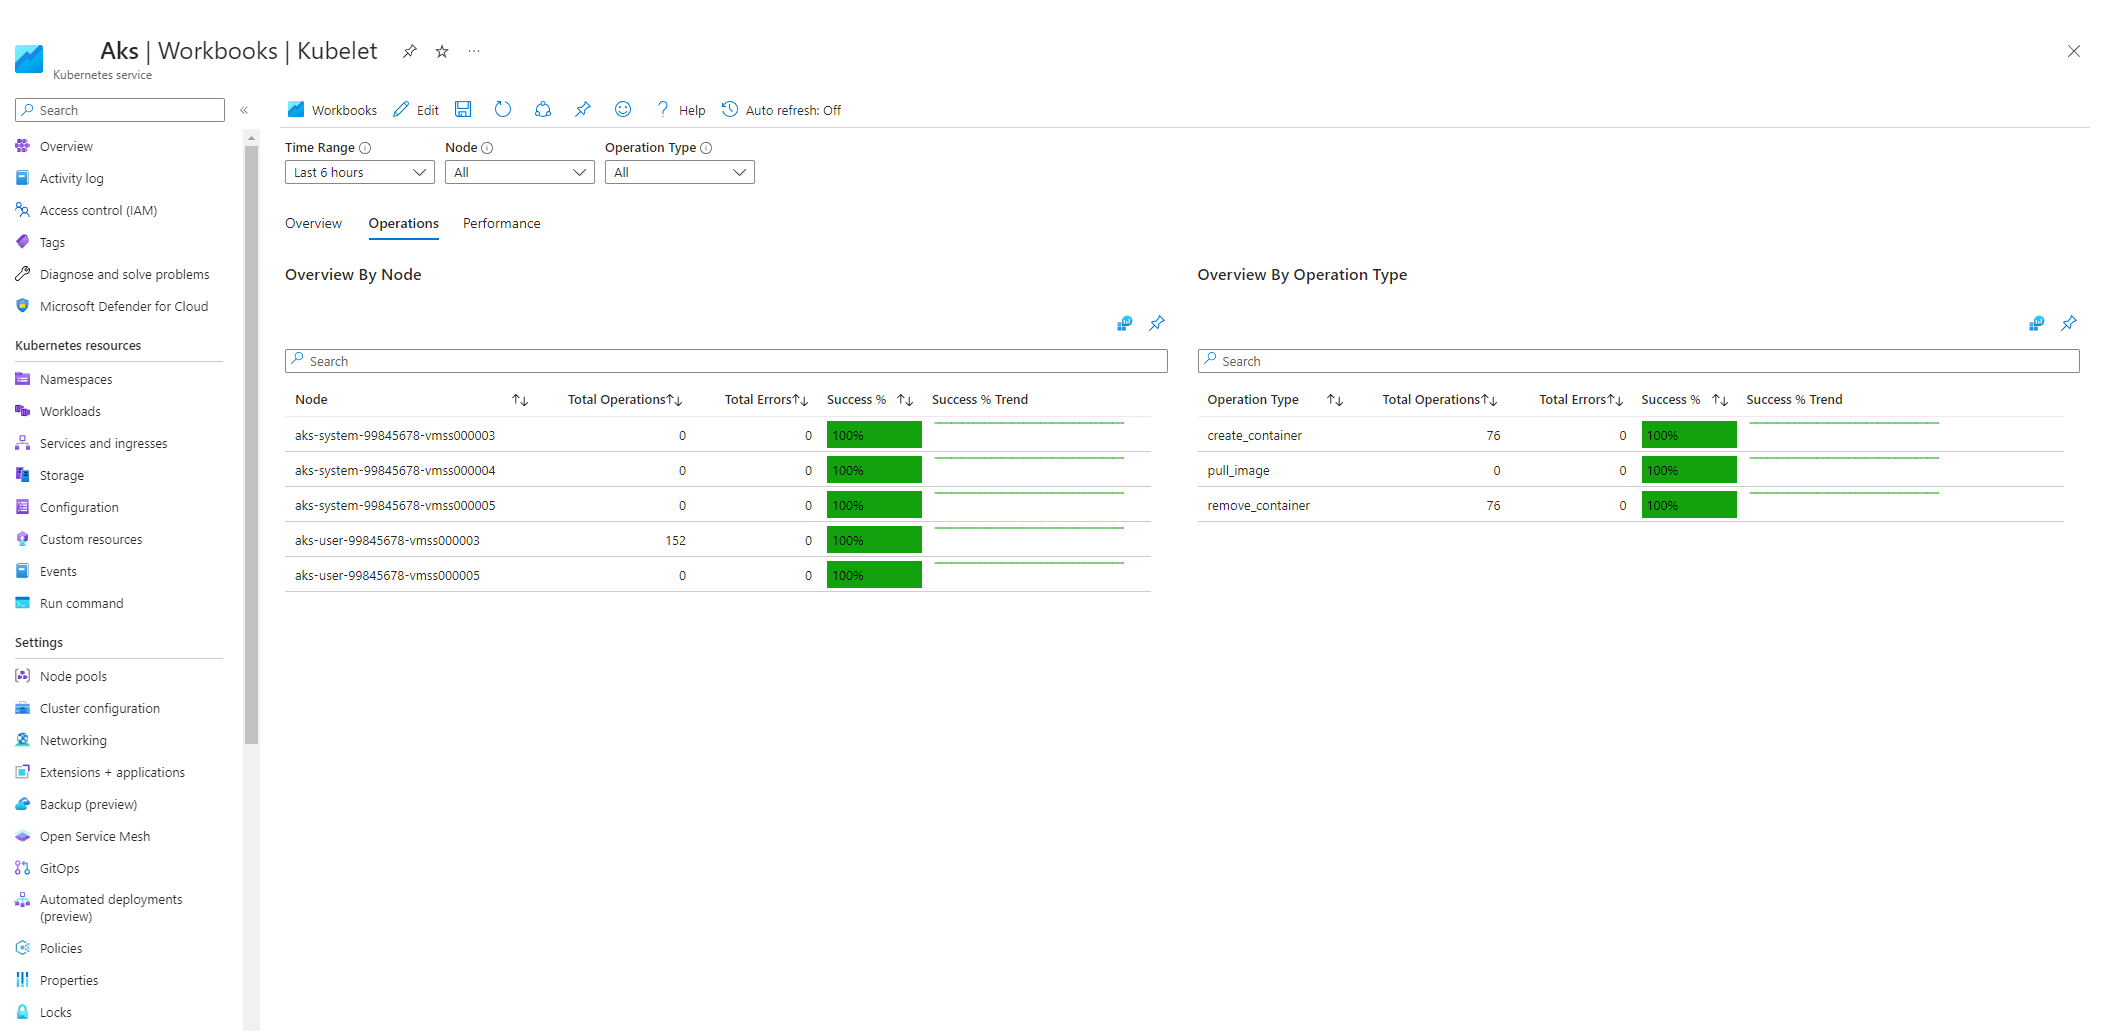
AKS kubelet workbook
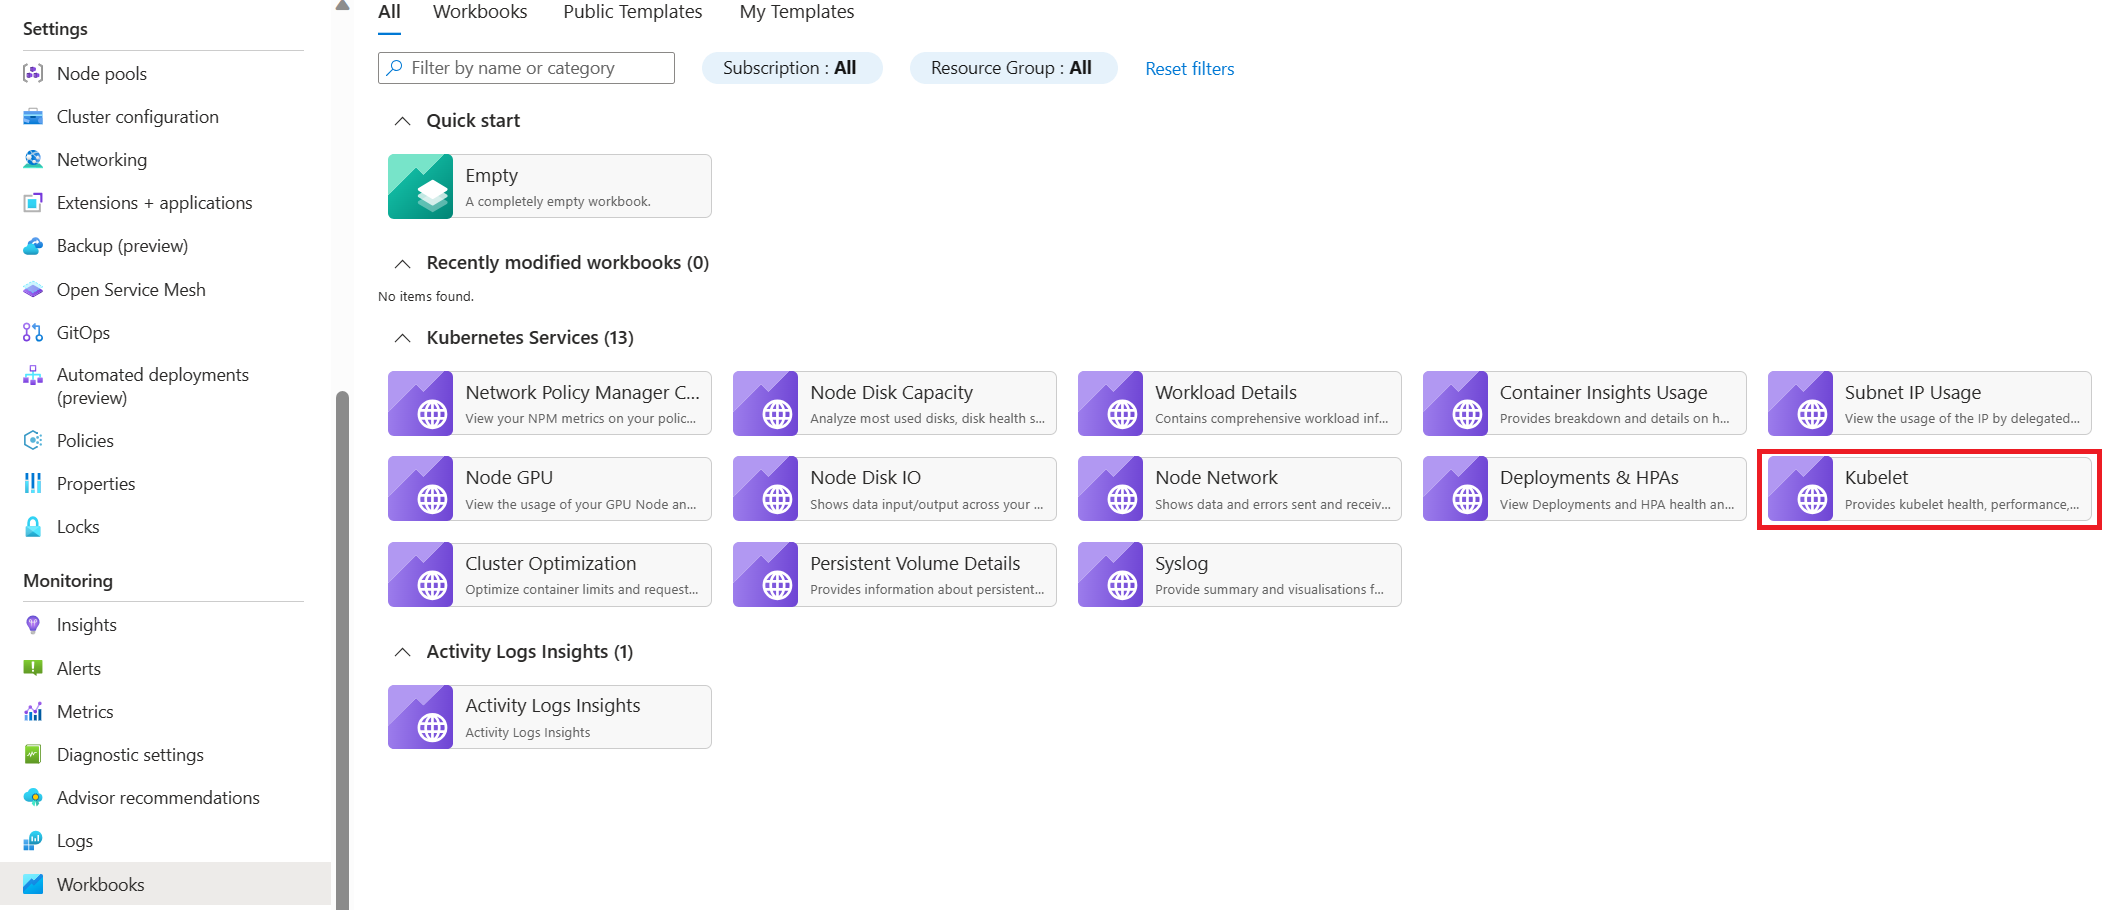
To ensure that agent node kubelets work properly, follow these steps:
Go to your AKS cluster in the Azure portal.
In the Monitoring section of the navigation pane, select Workbooks.
Select the Kubelet workbook.
Select Operations and make sure that the operations for all worker nodes are complete.
In-cluster monitoring with Prometheus and Grafana
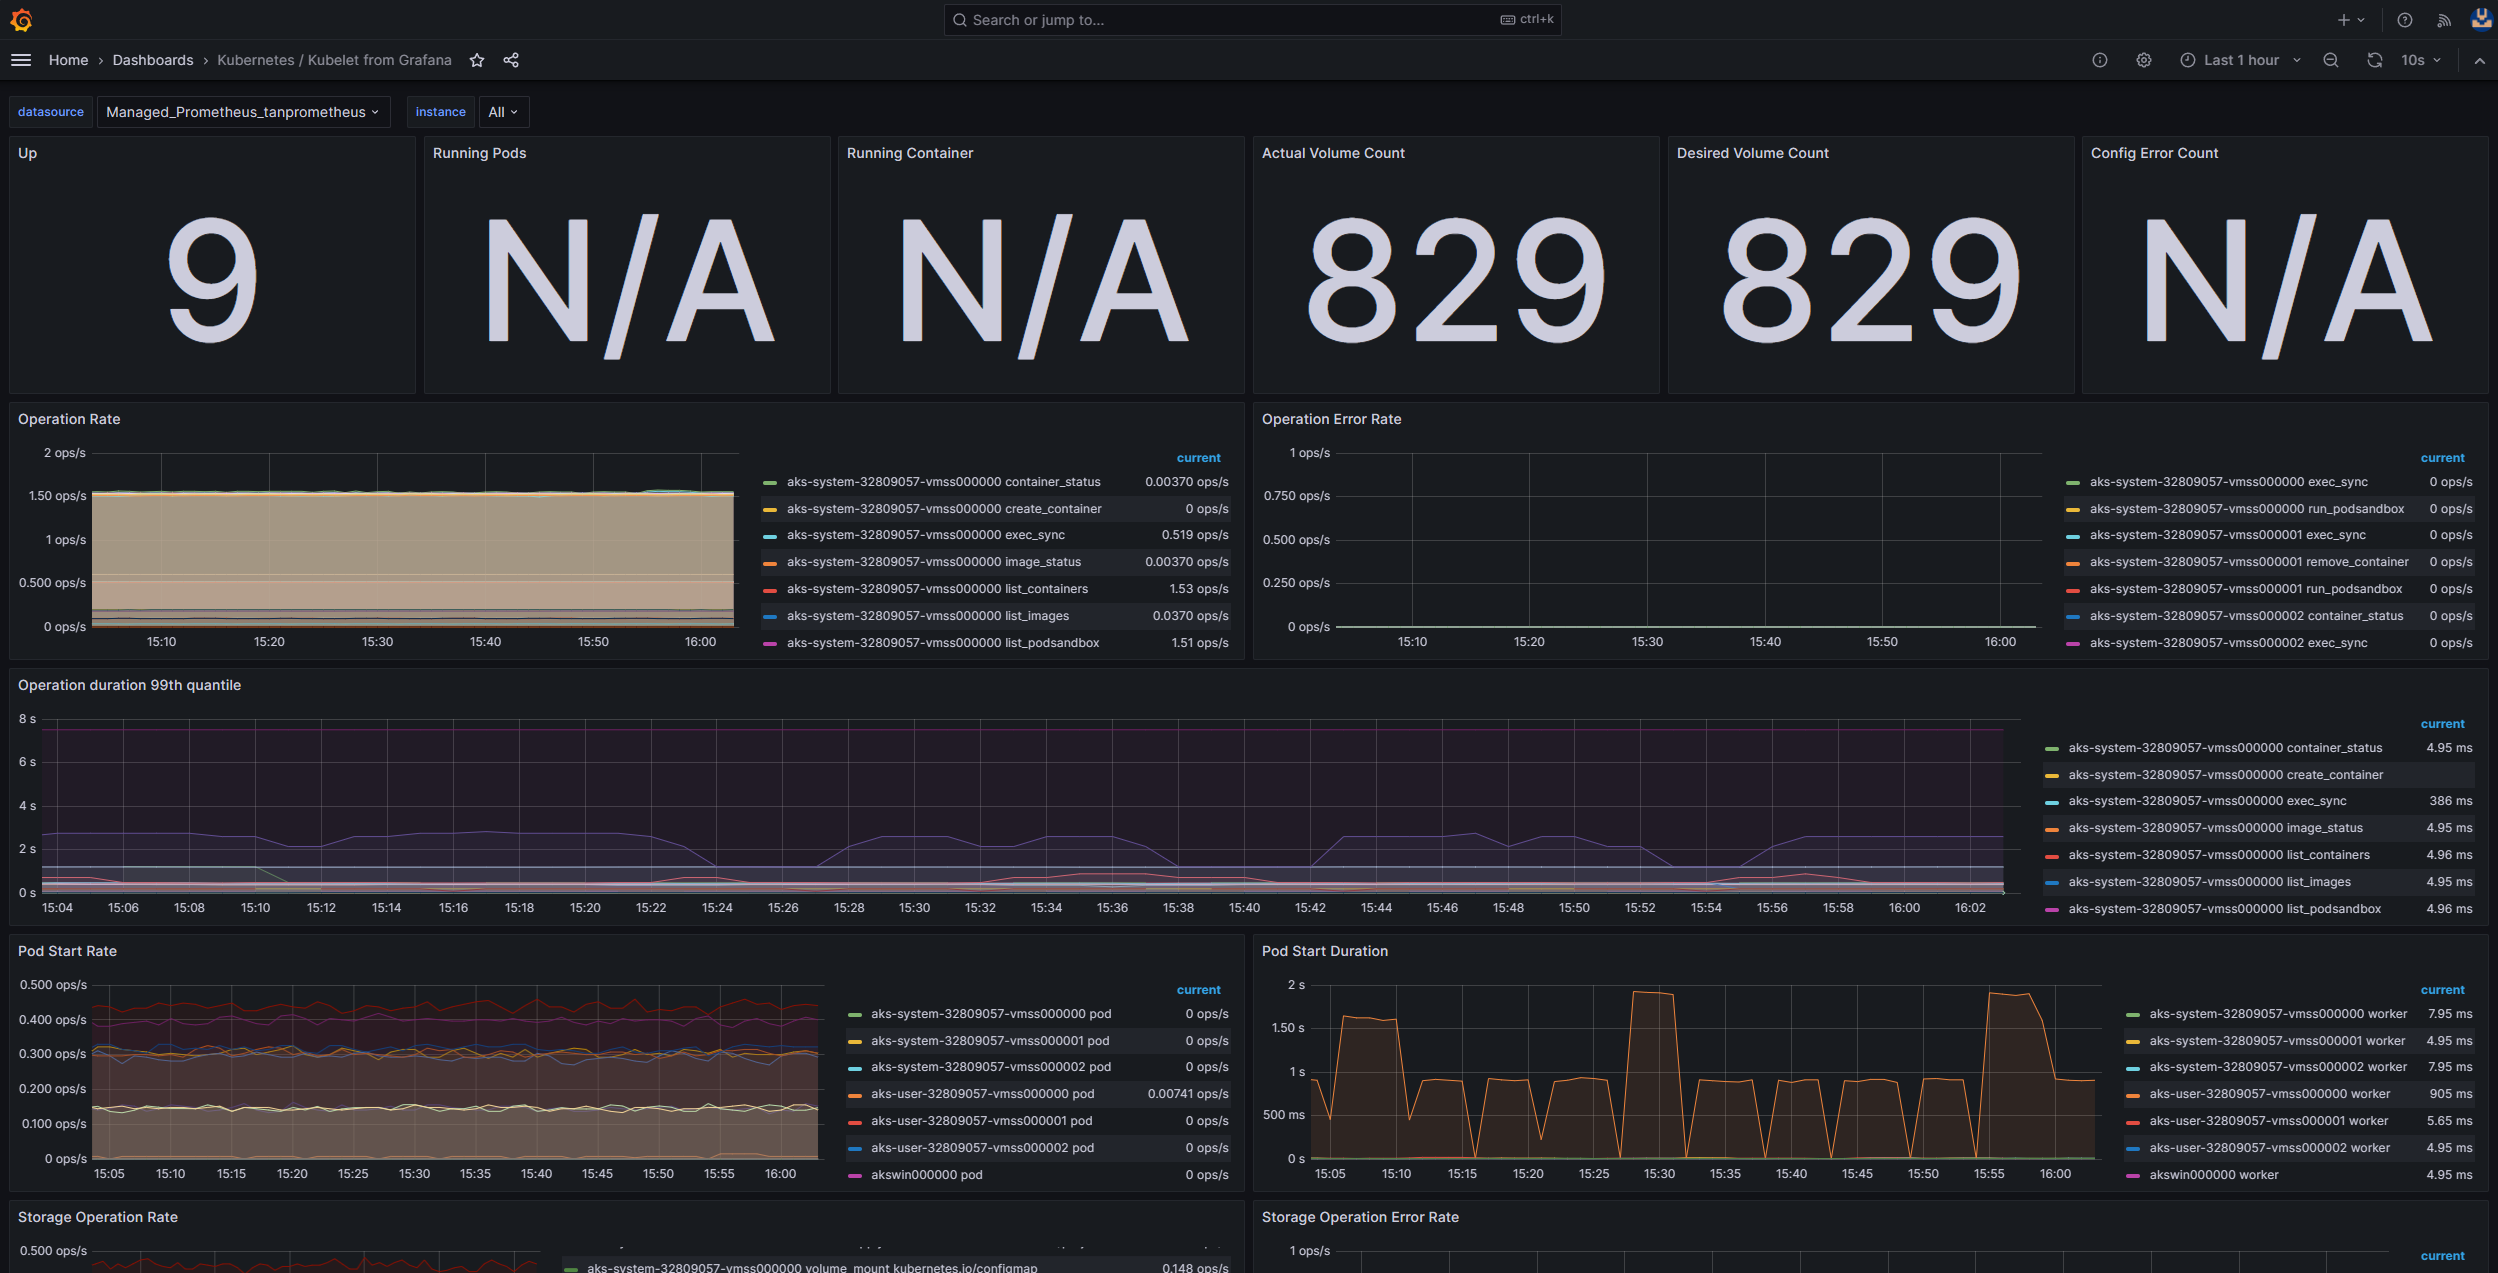
If you deployed Prometheus and Grafana in your AKS cluster, you can use the Kubernetes / Kubelet dashboard to get insights about the health and performance of individual node kubelets.
Monitor managed service for Prometheus and Azure Managed Grafana
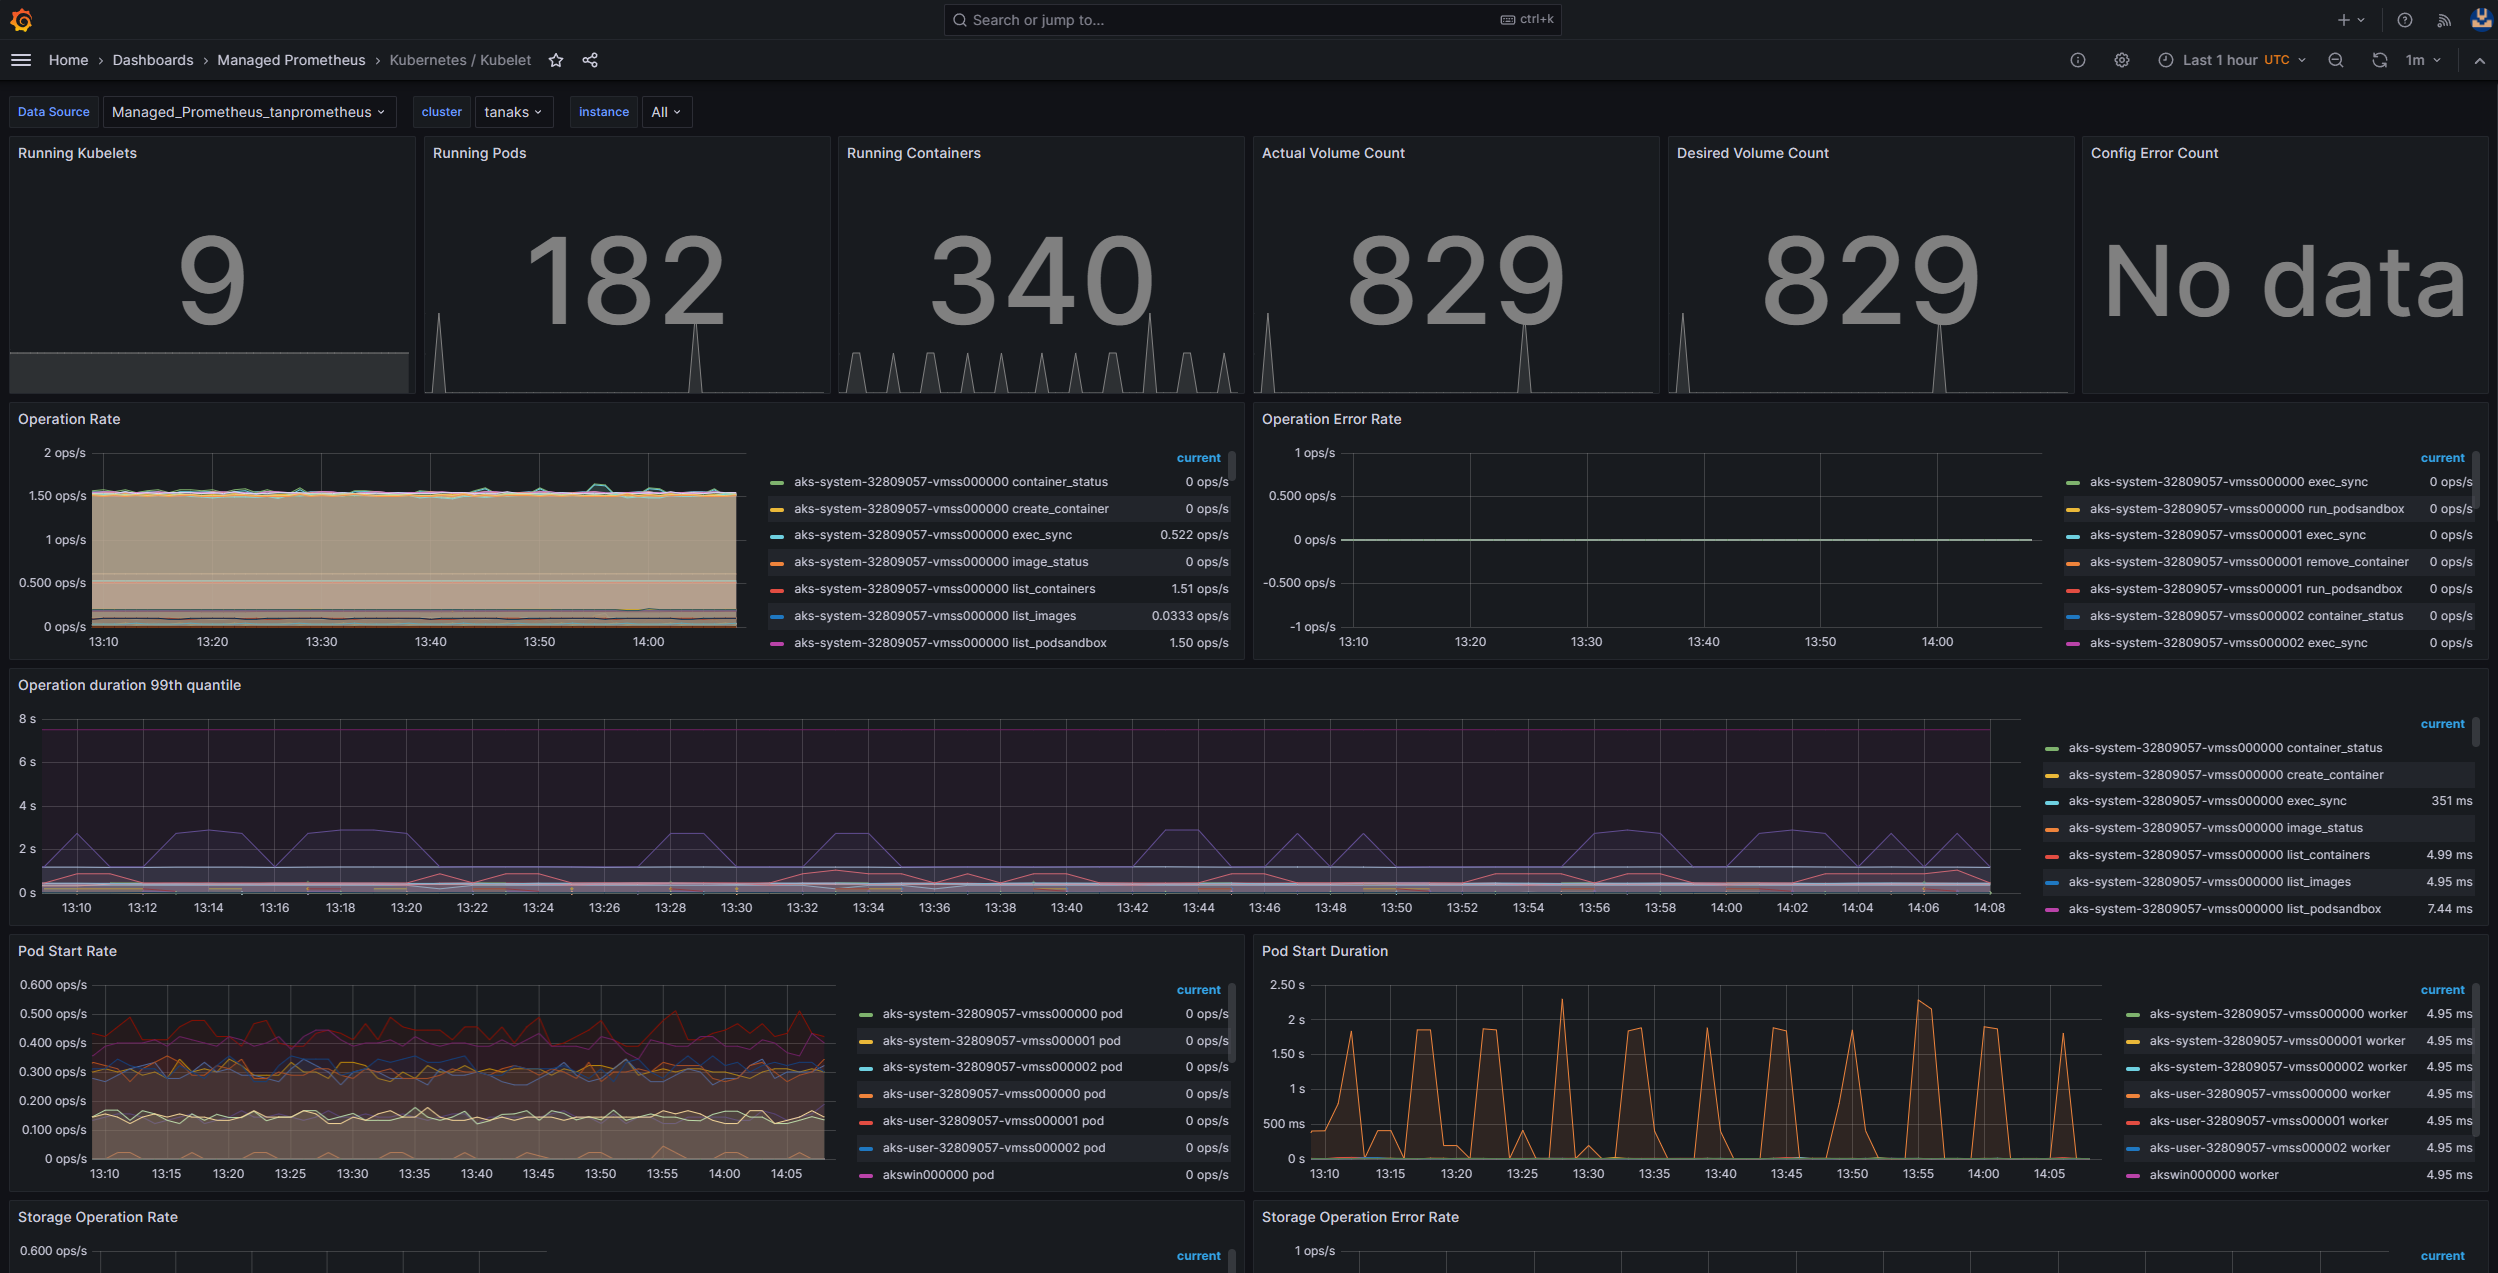
You can use the Kubernetes / Kubelet prebuilt dashboard to visualize and analyze the Prometheus metrics for the worker node kubelets. To do so, you must set up your AKS cluster to collect Prometheus metrics in Monitor managed service for Prometheus, and connect your Monitor workspace to an Azure Managed Grafana workspace.
Pressure increases when a kubelet restarts and causes sporadic, unpredictable behavior. Make sure that the error count doesn't grow continuously. An occasional error is acceptable, but a constant growth indicates an underlying issue that you must investigate and resolve.
Step 5: Use the node problem detector (NPD) tool to check node health
NPD is a Kubernetes tool that you can use to identify and report node-related issues. It operates as a systemd service on every node within the cluster. It gathers metrics and system information, such as CPU usage, disk usage, and network connectivity status. When a problem is detected, the NPD tool generates a report on the events and the node condition. In AKS, the NPD tool is used to monitor and manage nodes in a Kubernetes cluster that's hosted on the Azure cloud. For more information, see NPD in AKS nodes.
Step 6: Check disk I/O operations per second (IOPS) for throttling
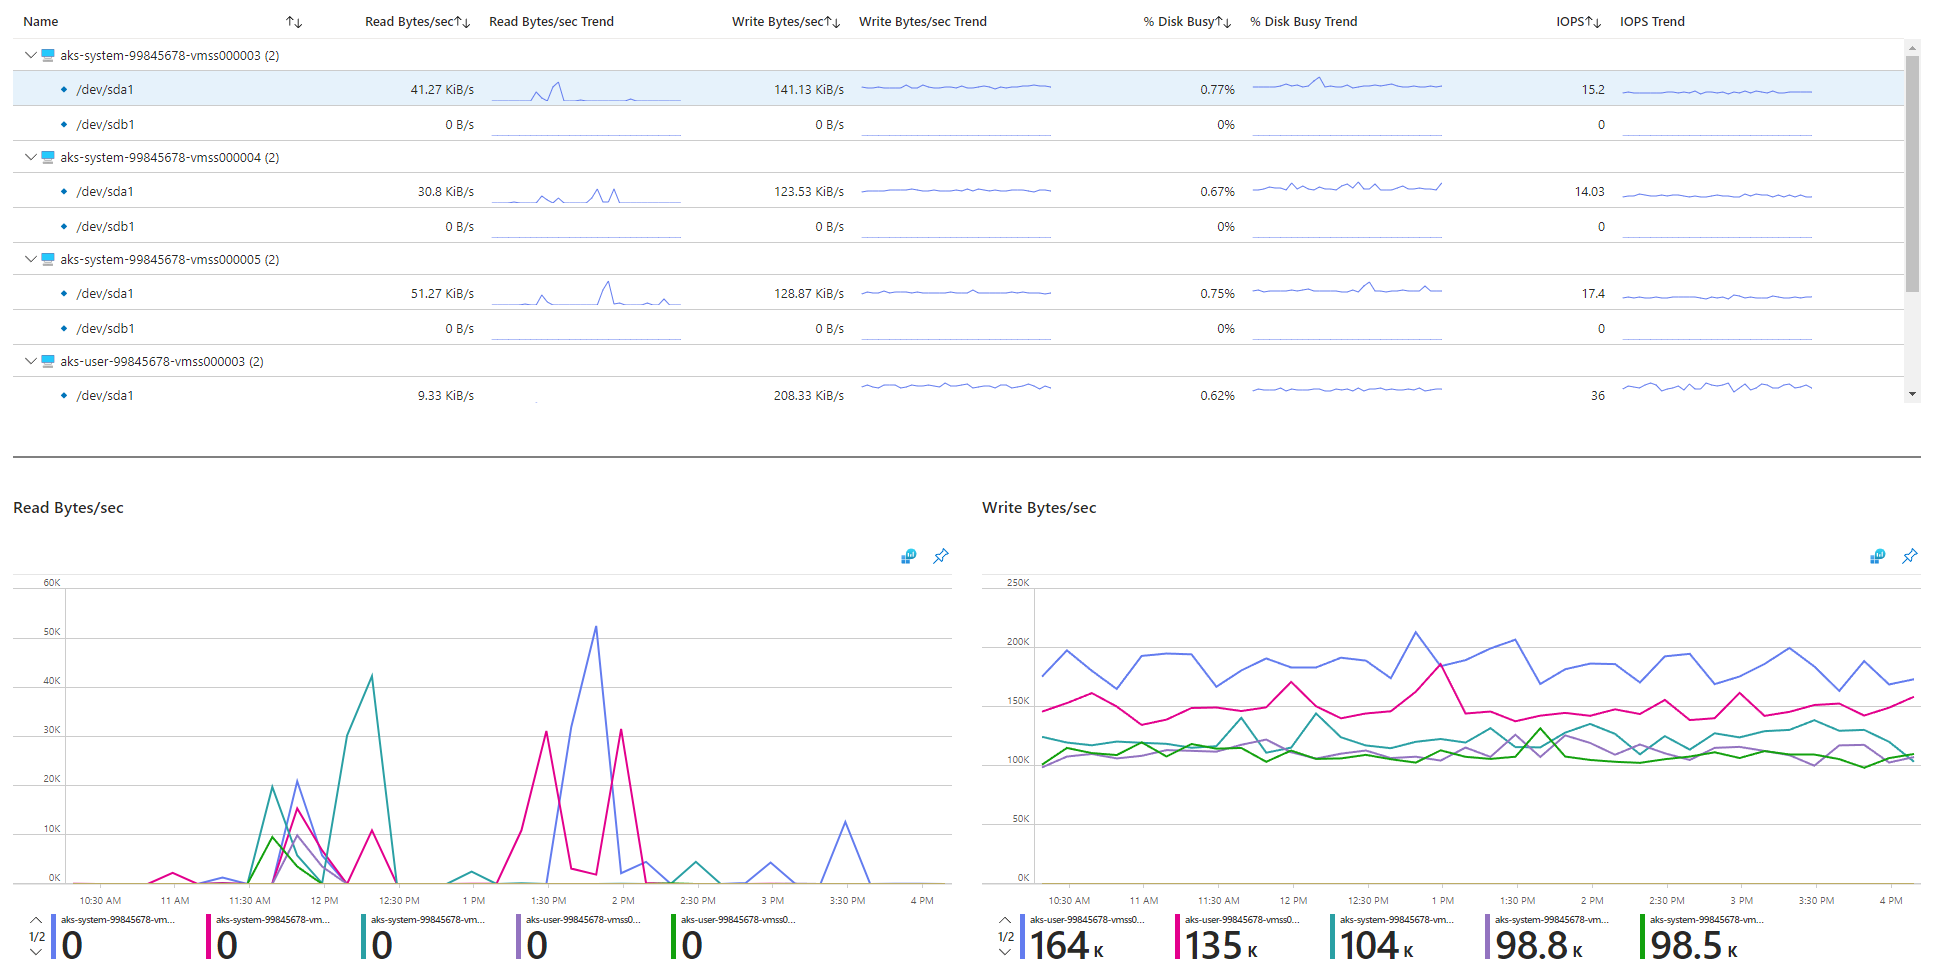
To ensure that IOPS aren't being throttled and affecting services and workloads within your AKS cluster, you can use one of the following methods.
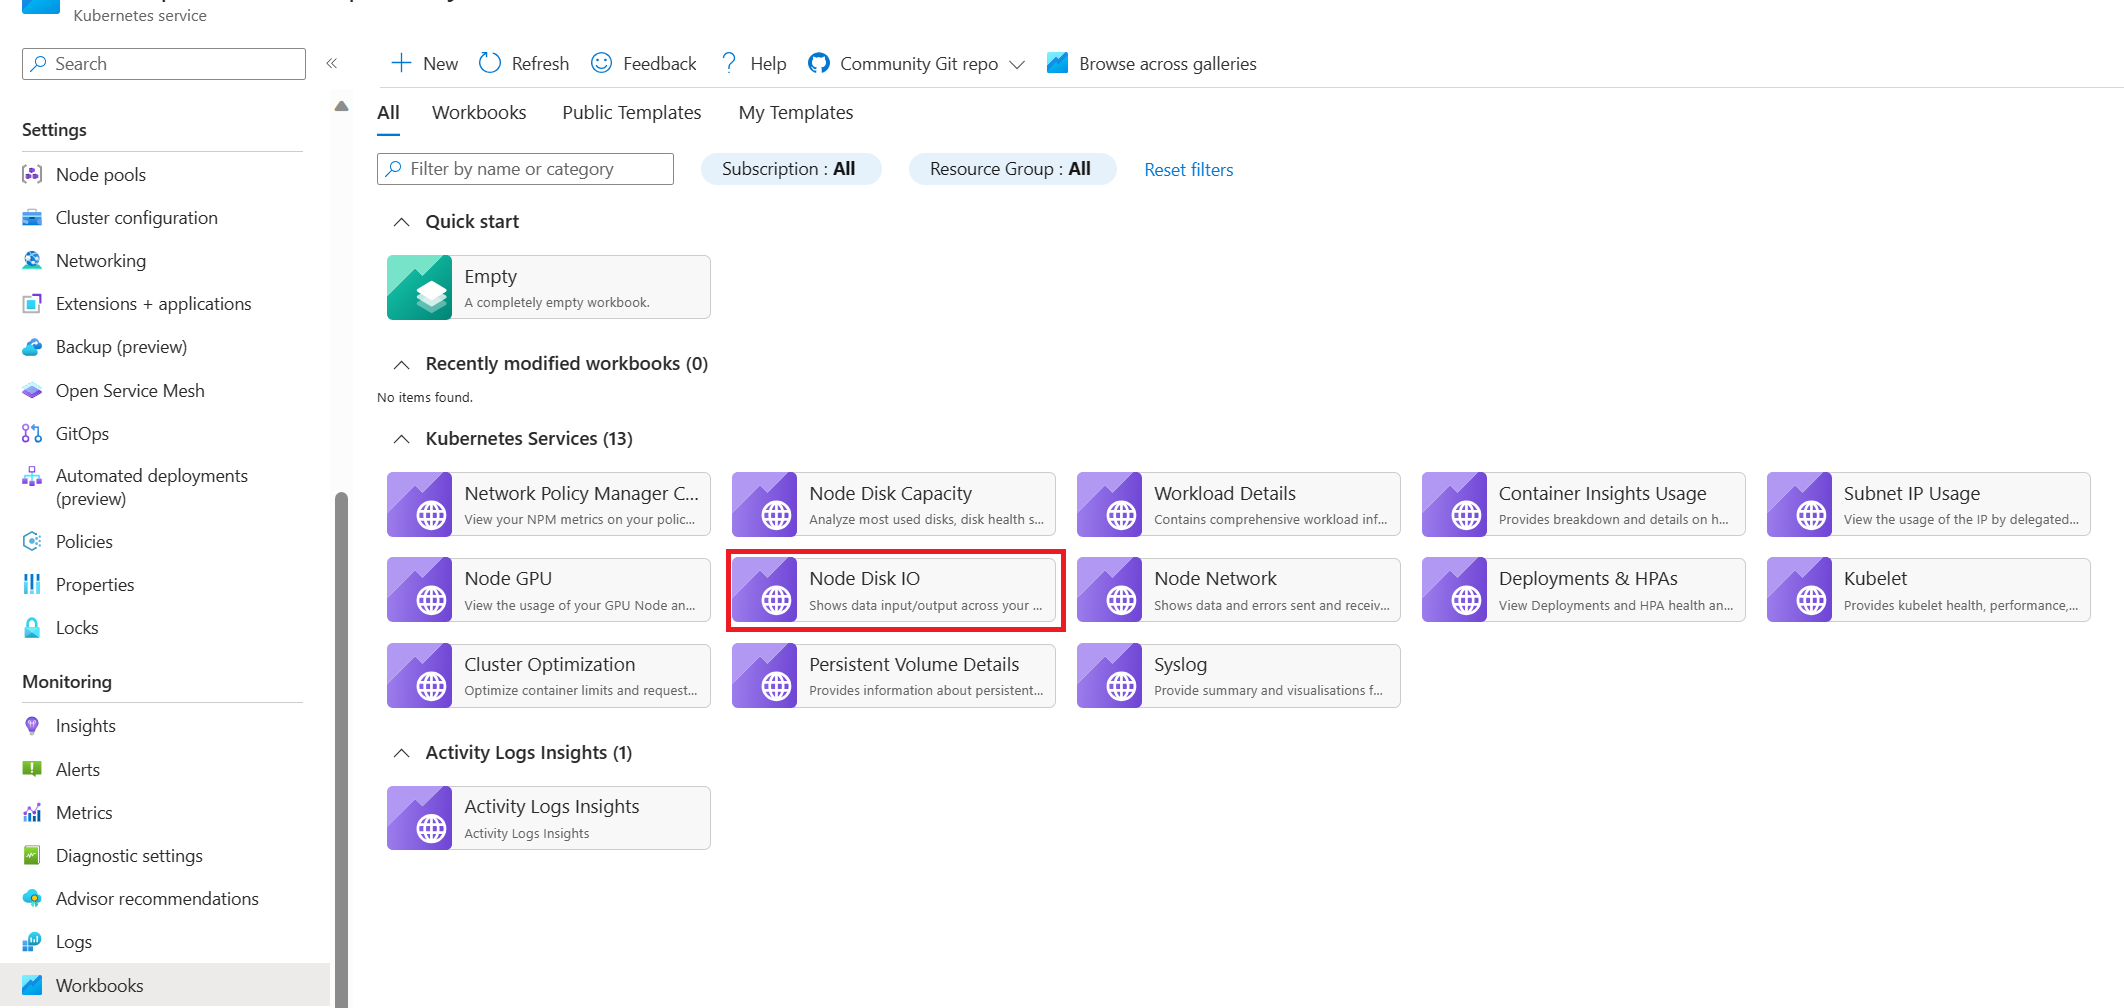
AKS node disk I/O workbook
To monitor the disk I/O-related metrics of the worker nodes in your AKS cluster, you can use the node disk I/O workbook. Follow these steps to access the workbook:
Go to your AKS cluster in the Azure portal.
In the Monitoring section of the navigation pane, select Workbooks.
Select the Node Disk IO workbook.
Review the I/O-related metrics.
In-cluster monitoring with Prometheus and Grafana
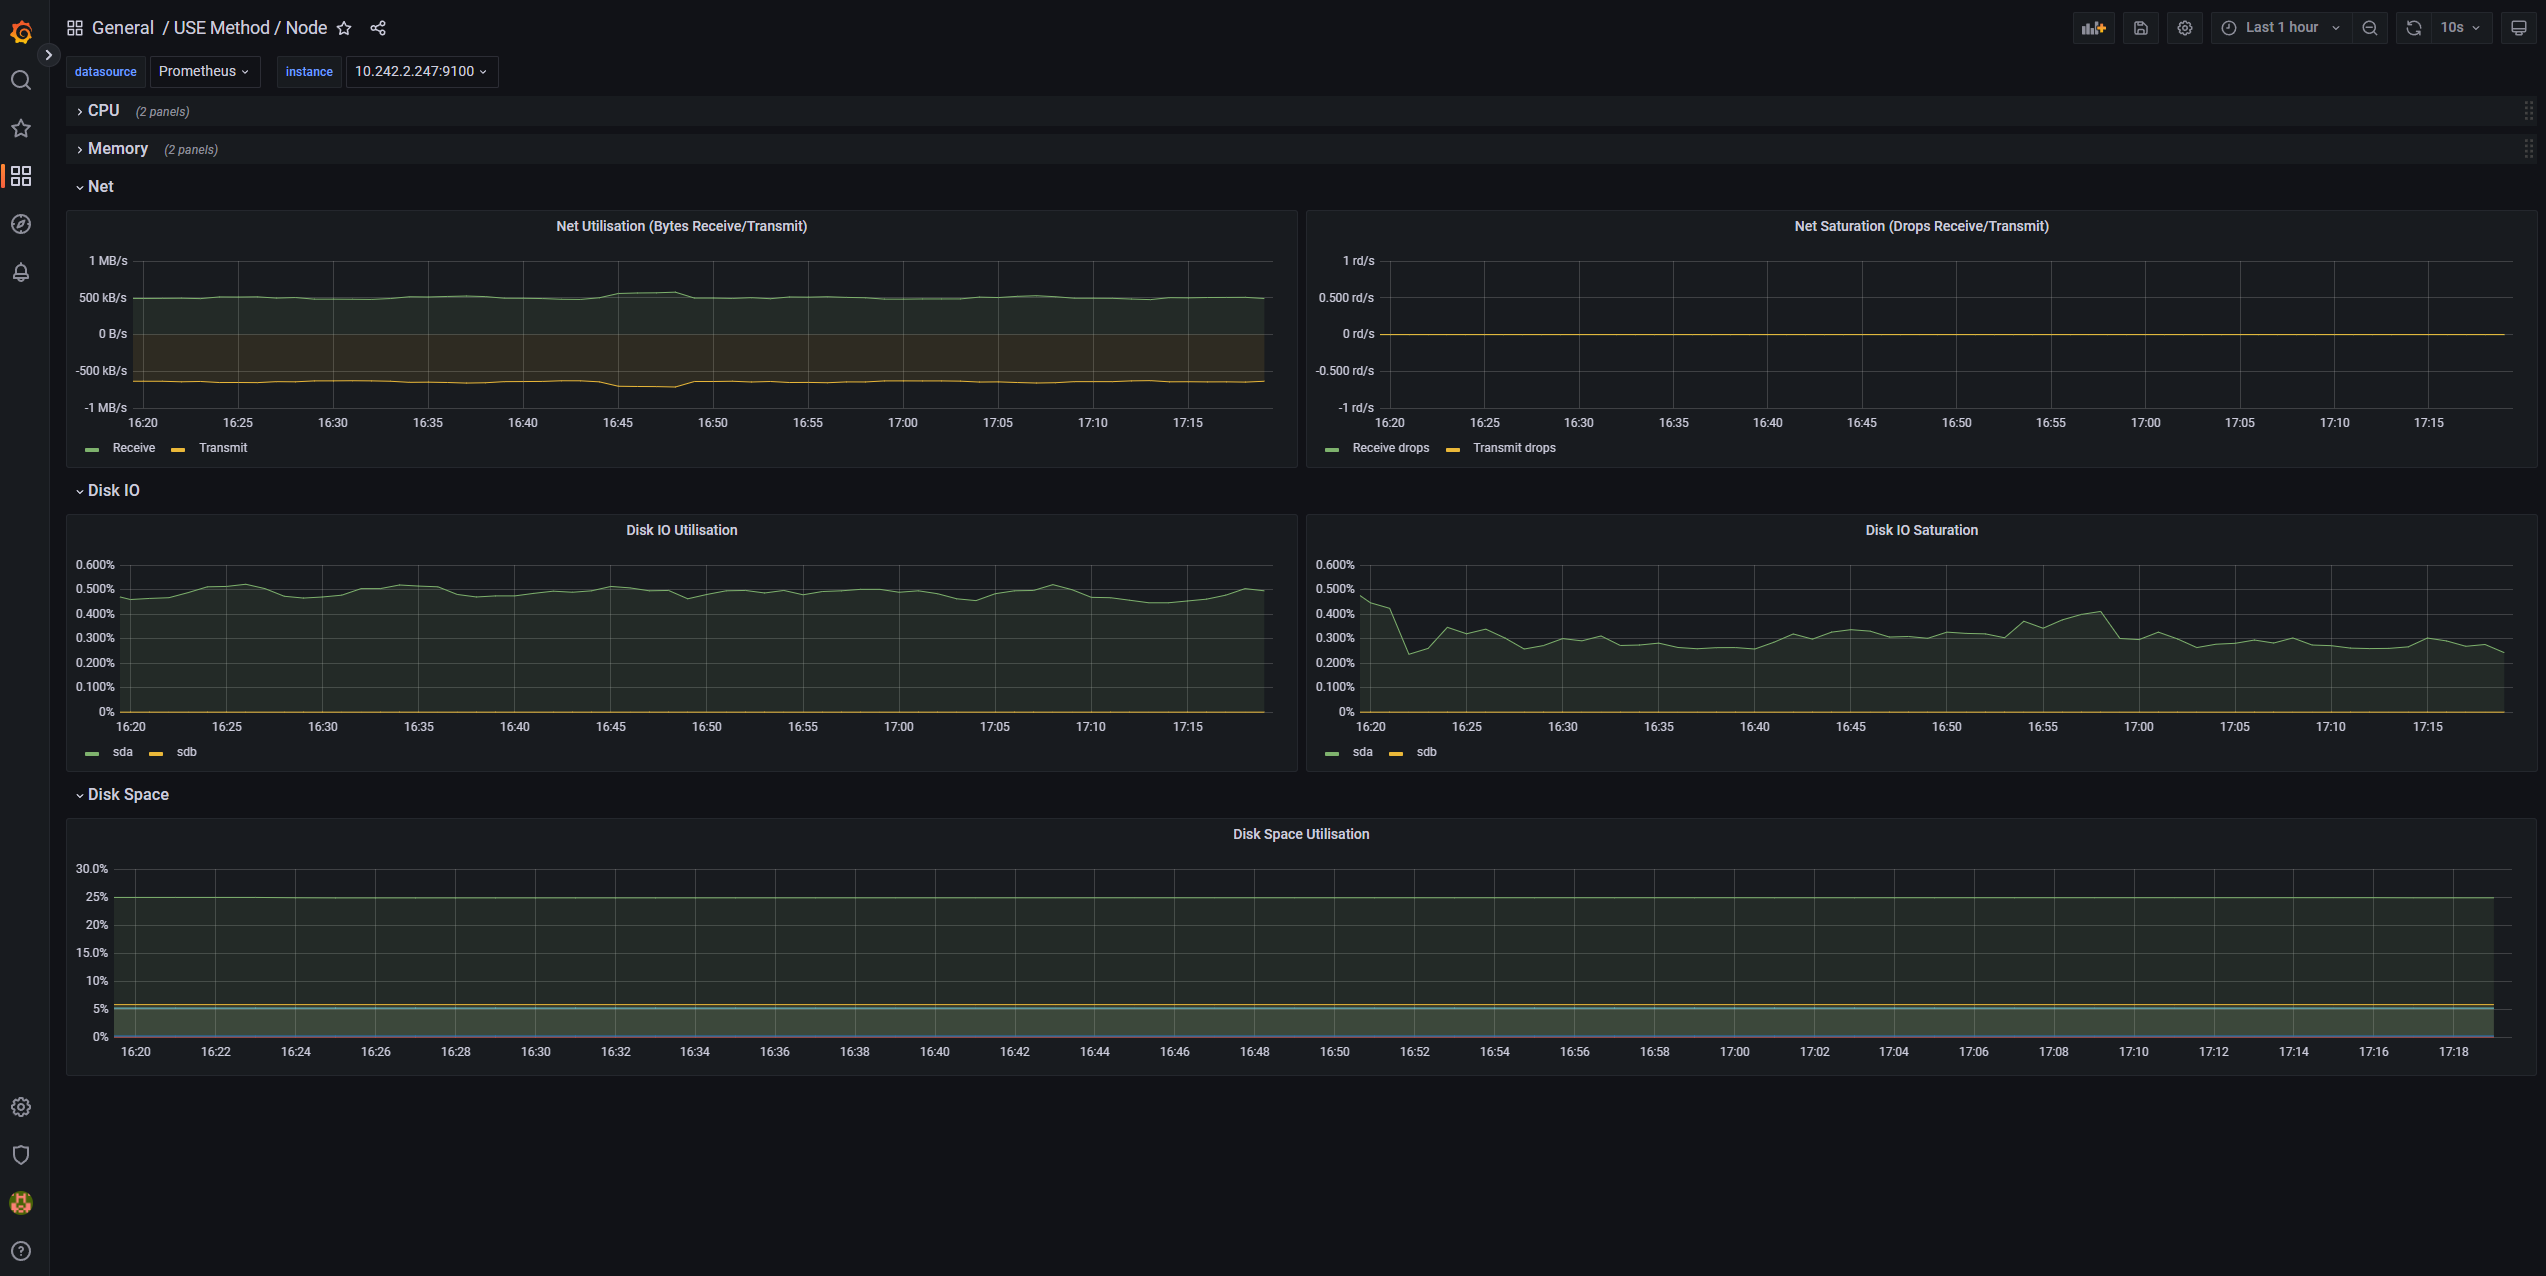
If you deployed Prometheus and Grafana in your AKS cluster, you can use the USE Method / Node dashboard to get insights about the disk I/O for the cluster worker nodes.
Monitor managed service for Prometheus and Azure Managed Grafana
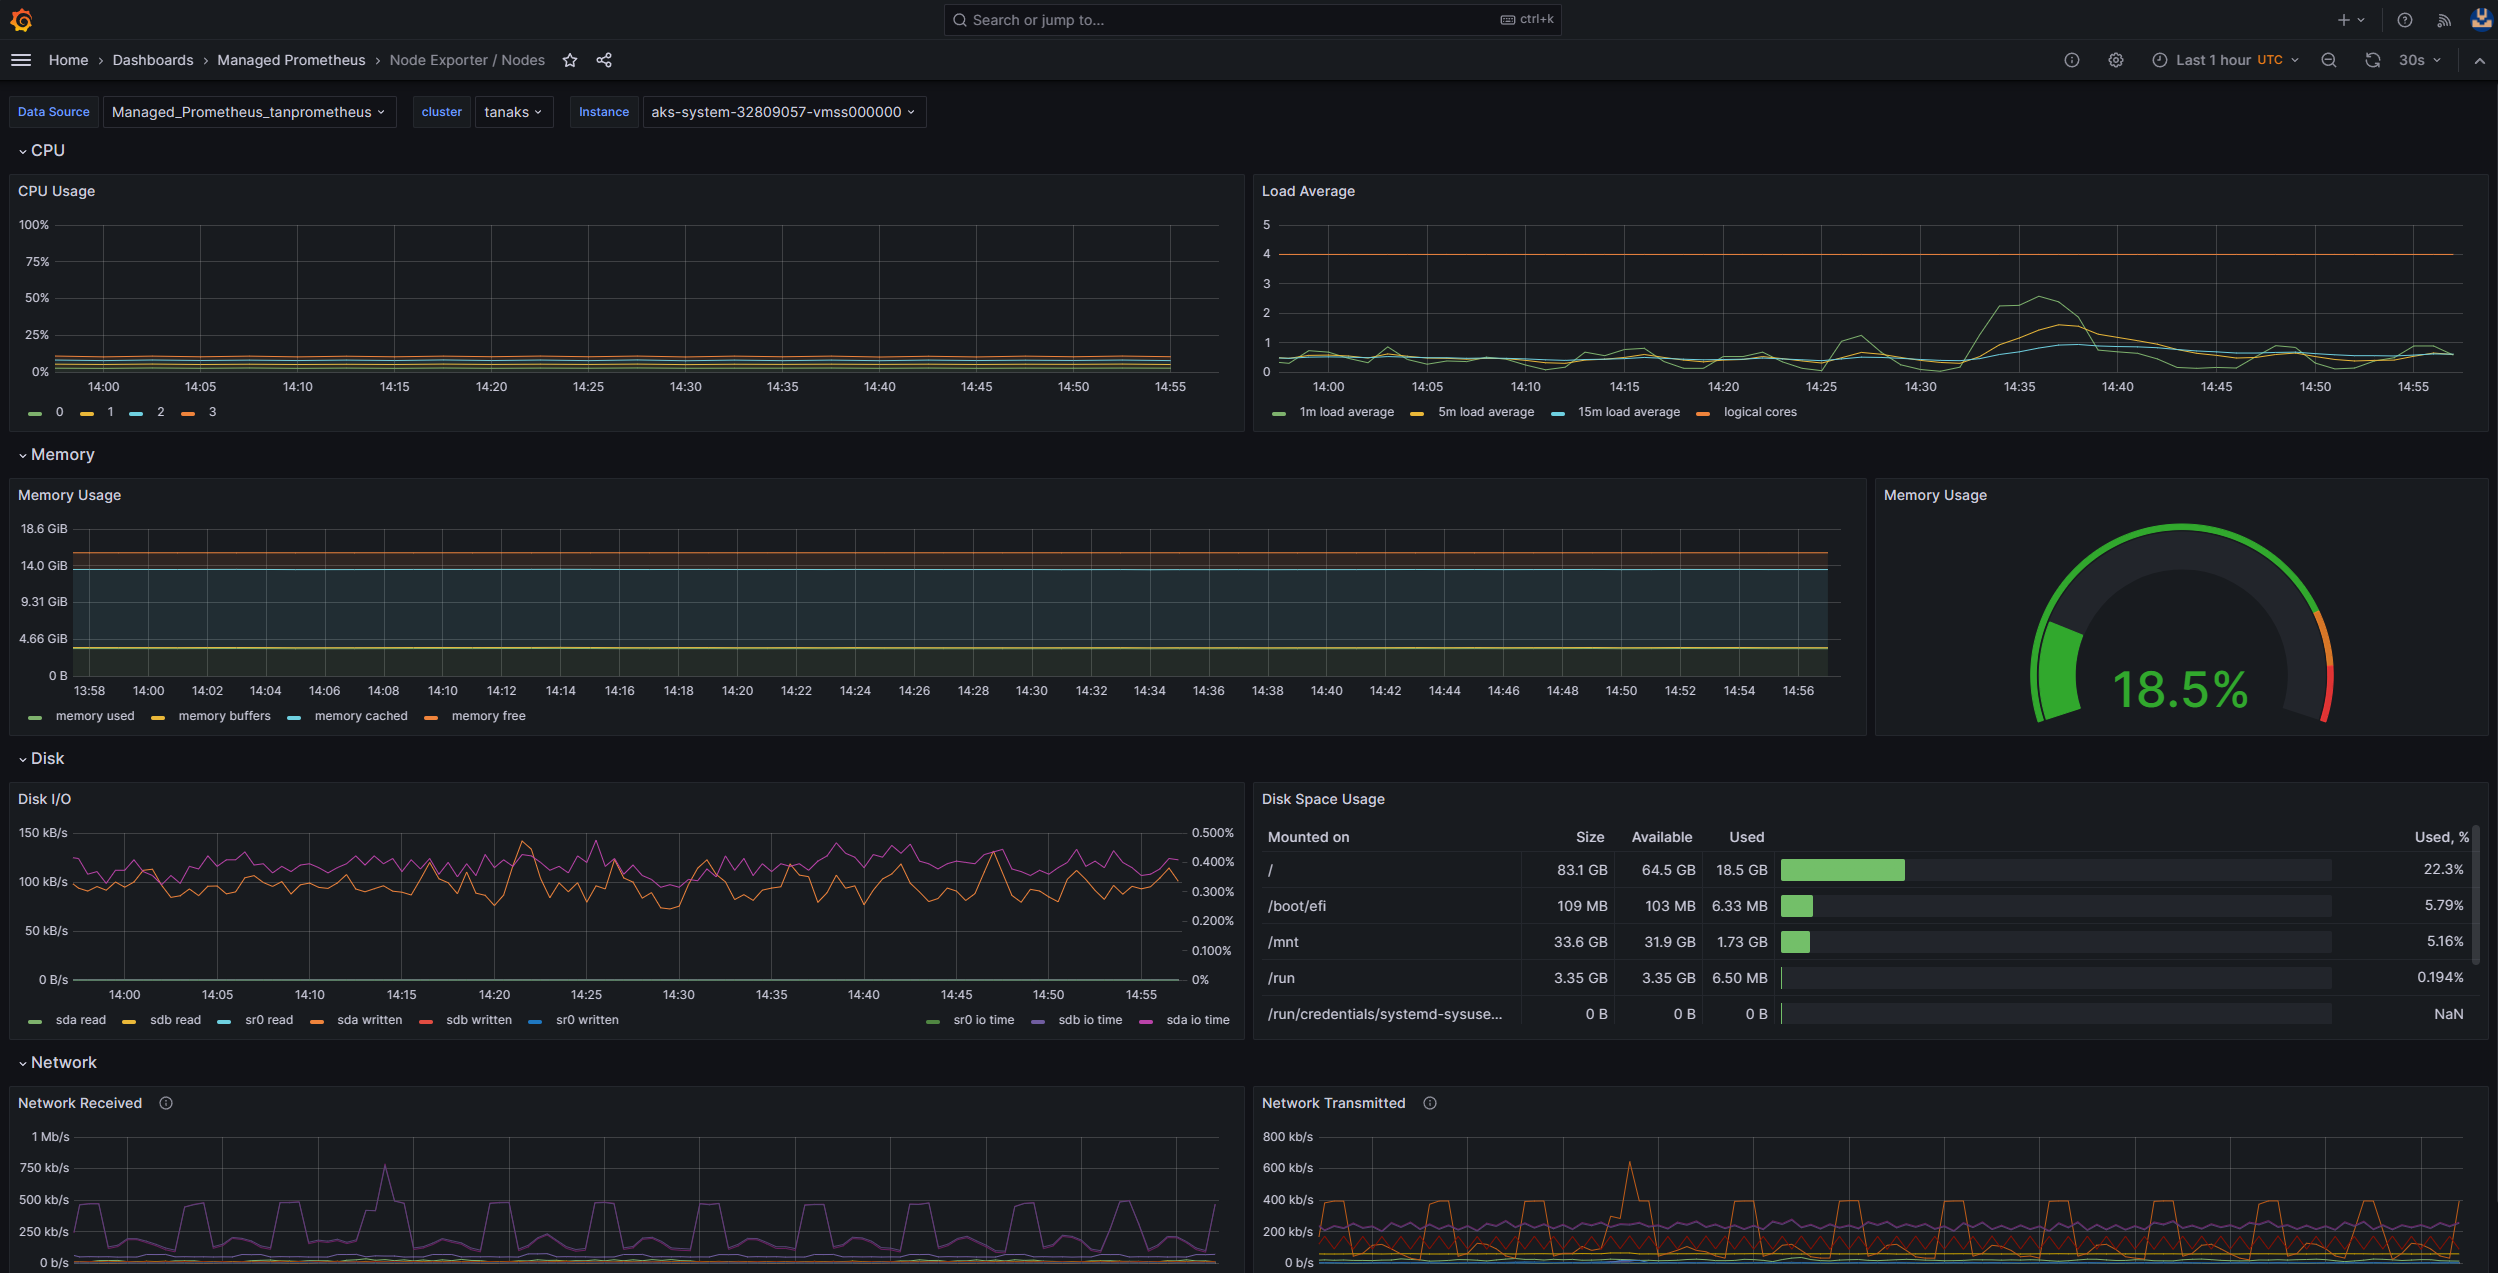
You can use the Node Exporter / Nodes prebuilt dashboard to visualize and analyze disk I/O-related metrics from the worker nodes. To do so, you must set up your AKS cluster to collect Prometheus metrics in Monitor managed service for Prometheus, and connect your Monitor workspace to an Azure Managed Grafana workspace.
IOPS and Azure disks
Physical storage devices have inherent limitations in terms of bandwidth and the maximum number of file operations that they can handle. Azure disks are used to store the operating system that runs on AKS nodes. The disks are subject to the same physical storage constraints as the operating system.
Consider the concept of throughput. You can multiply the average I/O size by the IOPS to determine the throughput in megabytes per second (MBps). Larger I/O sizes translate to lower IOPS because of the fixed throughput of the disk.
When a workload surpasses the maximum IOPS service limits assigned to the Azure disks, the cluster might become unresponsive and enter an I/O wait state. In Linux-based systems, many components are treated as files, such as network sockets, CNI, Docker, and other services that are reliant on network I/O. Consequently, if the disk can't be read, the failure extends to all these files.
Several events and scenarios can trigger IOPS throttling, including:
A substantial number of containers that run on nodes, because Docker I/O shares the operating system disk.
Custom or third-party tools that are employed for security, monitoring, and logging, which might generate additional I/O operations on the operating system disk.
Node failover events and periodic jobs that intensify the workload or scale the number of pods. This increased load heightens the likelihood of throttling occurrences, potentially causing all nodes to transition to a not ready state until the I/O operations conclude.
Contributors
This article is maintained by Microsoft. It was originally written by the following contributors.
Principal authors:
- Paolo Salvatori | Principal Customer Engineer
- Francis Simy Nazareth | Senior Technical Specialist
To see non-public LinkedIn profiles, sign in to LinkedIn.
