Metrics collected by Container insights
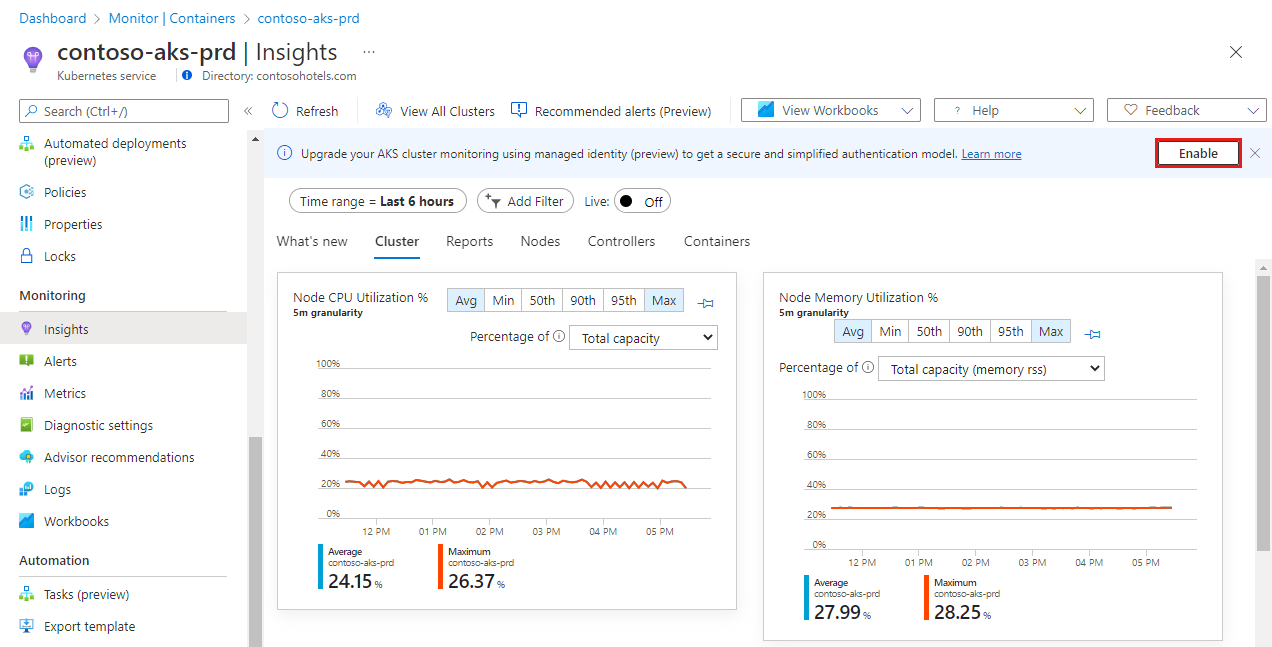
Container insights collects custom metrics from Azure Kubernetes Service (AKS) and Azure Arc-enabled Kubernetes cluster nodes and pods. With custom metrics, you can:
- Present timely aggregate calculations (average, count, maximum, minimum, and sum) in performance charts.
- Pin performance charts in Azure portal dashboards.
- Take advantage of metric alerts.
Important
These metrics will no longer be collected starting May 31, 2024 as described in Container insights recommended alerts (custom metrics) (preview) retirement moving up to 31 May 2024. See Enable Prometheus and Grafana to enable collection of Prometheus metrics.
Use custom metrics
Custom metrics collected by Container insights can be accessed with the same methods as custom metrics collected from other data sources, including metrics explorer and metrics alerts.
Metrics collected
The following sections describe the metric values collected for your cluster.
Node metrics
Namespace: Insights.container/nodes
Dimensions: host
| Metric | Description |
|---|---|
| cpuUsageMillicores | CPU utilization in millicores by host. |
| cpuUsagePercentage, cpuUsageAllocatablePercentage (preview) | CPU usage percentage by node and allocatable, respectively. |
| memoryRssBytes | Memory RSS utilization in bytes by host. |
| memoryRssPercentage, memoryRssAllocatablePercentage (preview) | Memory RSS usage percentage by host and allocatable, respectively. |
| memoryWorkingSetBytes | Memory Working Set utilization in bytes by host. |
| memoryWorkingSetPercentage, memoryRssAllocatablePercentage (preview) | Memory Working Set usage percentage by host and allocatable, respectively. |
| nodesCount | Count of nodes by status. |
| diskUsedPercentage | Percentage of disk used on the node by device. |
Pod metrics
Namespace: Insights.container/pods
Dimensions: controllerName, Kubernetes namespace
| Metric | Description |
|---|---|
| podCount | Count of pods by controller, namespace, node, and phase. |
| completedJobsCount | Completed jobs count older user configurable threshold (default is six hours) by controller, Kubernetes namespace. |
| restartingContainerCount | Count of container restarts by controller and Kubernetes namespace. |
| oomKilledContainerCount | Count of OOMkilled containers by controller and Kubernetes namespace. |
| podReadyPercentage | Percentage of pods in ready state by controller and Kubernetes namespace. |
Container metrics
Namespace: Insights.container/containers
Dimensions: containerName, controllerName, Kubernetes namespace, podName
| Metric | Description |
|---|---|
| (Old)cpuExceededPercentage | CPU utilization percentage for containers exceeding user configurable threshold (default is 95.0) by container name, controller name, Kubernetes namespace, and pod name. Collected |
| (New)cpuThresholdViolated | Metric triggered when CPU utilization percentage for containers exceeding user configurable threshold (default is 95.0) by container name, controller name, Kubernetes namespace, and pod name. Collected |
| (Old)memoryRssExceededPercentage | Memory RSS percentage for containers exceeding user configurable threshold (default is 95.0) by container name, controller name, Kubernetes namespace, and pod name. |
| (New)memoryRssThresholdViolated | Metric triggered when Memory RSS percentage for containers exceeding user configurable threshold (default is 95.0) by container name, controller name, Kubernetes namespace, and pod name. |
| (Old)memoryWorkingSetExceededPercentage | Memory Working Set percentage for containers exceeding user configurable threshold (default is 95.0) by container name, controller name, Kubernetes namespace, and pod name. |
| (New)memoryWorkingSetThresholdViolated | Metric triggered when Memory Working Set percentage for containers exceeding user configurable threshold (default is 95.0) by container name, controller name, Kubernetes namespace, and pod name. |
Persistent volume metrics
Namespace: Insights.container/persistentvolumes
Dimensions: kubernetesNamespace, node, podName, volumeName
| Metric | Description |
|---|---|
| (Old)pvUsageExceededPercentage | Persistent volume (PV) utilization percentage for persistent volumes exceeding user configurable threshold (default is 60.0) by claim name, Kubernetes namespace, volume name, pod name, and node name. |
| (New)pvUsageThresholdViolated | Metric triggered when PV utilization percentage for persistent volumes exceeding user configurable threshold (default is 60.0) by claim name, Kubernetes namespace, volume name, pod name, and node name. |
Enable custom metrics
If your cluster uses managed identity authentication for Container insights, custom metrics will be enabled for you. If not, you need to enable custom metrics by using one of the following methods.
This process assigns the Monitoring Metrics Publisher role to the cluster's service principal. Monitoring Metrics Publisher has permission only to push metrics to the resource. It can't alter any state, update the resource, or read any data. For more information, see Monitoring Metrics Publisher role. The Monitoring Metrics Publisher role requirement doesn't apply to Azure Arc-enabled Kubernetes clusters.
Prerequisites
Before you update your cluster, confirm that you're a member of the Owner role on the AKS cluster resource to enable collection of custom performance metrics for nodes and pods. This requirement doesn't apply to Azure Arc-enabled Kubernetes clusters.
Enablement options
Use one of the following methods to enable custom metrics for either a single cluster or all clusters in your subscription.
Verify the update
To verify that custom metrics are enabled, open metrics explorer and verify from Metric namespace that insights is listed.
