Tutorial: Observability of managed Java components in Azure Container Apps
Java components include built-in observability features that can give you a holistic view of Java component health throughout its lifecycle. In this tutorial, you learn how to query logs messages generated by a Java component.
Prerequisites
The following prerequisites are required for this tutorial.
| Resource | Description |
|---|---|
| Azure Log Analytics | To use the built-in observability features of managed Java components, ensure you set up Azure Log Analytics to use Log Analytics or Azure Monitor. For more information, see Log storage and monitoring options in Azure Container Apps. |
| Java component | Make sure to create at least one Java component in your environment, such as Eureka Server or Config Server. |
Query log data
Log Analytics is a tool that helps you view and analyze log data. Using Log Analytics, you can write Kusto queries to retrieve, sort, filter, and visualize log data. These visualizations help you spot trends and identify issues with your application. You can work interactively with the query results or use them with other features such as alerts, dashboards, and workbooks.
Open the Azure portal and go to your Azure Log Analytics workspace.
Select Logs from the sidebar.
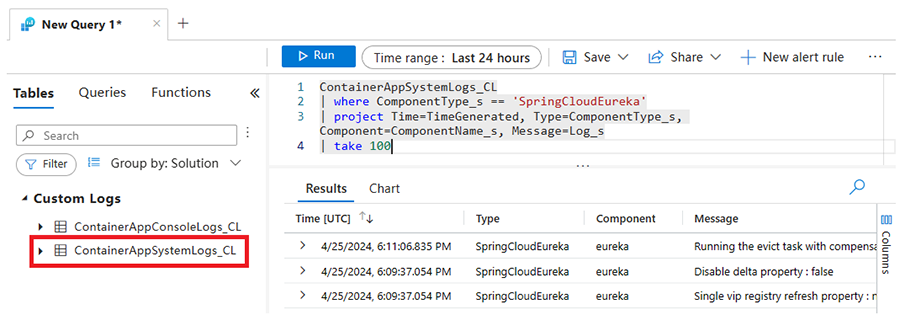
In the query tab, under the Tables section, under Custom Logs, select the ContainerAppSystemlogs_CL table.
Enter the following Kusto query to display Eureka Server logs for the Spring component.
ContainerAppSystemLogs_CL
| where ComponentType_s == 'SpringCloudEureka'
| project Time=TimeGenerated, Type=ComponentType_s, Component=ComponentName_s, Message=Log_s
| take 100
Select the Run button to run the query.
You query the component logs via the Azure CLI log analytics extension.
Run the following command to create a variable for your Log Analytics workspace ID.
Make sure to replace
<WORKSPACE_ID>with your Log Analytics workspace ID before running the query.SET $WORKSPACE_ID=<WORKSPACE_ID>Run the following command to query the logs table.
az monitor log-analytics query \ --workspace $WORKSPACE_ID \ --analytics-query "ContainerAppSystemLogs_CL | where ComponentType_s == 'SpringCloudEureka' | project Time=TimeGenerated, Type=ComponentType_s, Component=ComponentName_s, Message=Log_s | take 5" --out tableThe
projectoperator's parameters specify the table columns.
Query Java Component Log with Azure monitor
You can query Azure Monitor for monitoring data for your Java component logs.
Open the Azure portal and go to your Container Apps environment.
From the sidebar, under the Monitoring section, select Logs.
In the query tab, in the Tables section, under the Container Apps heading, select the ContainerAppSystemLogs table.
Enter the following Kusto query to display the log entries of Eureka Server for Spring component logs.
ContainerAppSystemLogs
| where ComponentType == "SpringCloudEureka"
| project Time=TimeGenerated, Type=ComponentType, Component=ComponentName, Message=Log
| take 100
Select the Run button to run the query.
You query the component logs via the Azure CLI log analytics extension.
Run the following command to create a variable for your Log Analytics workspace ID.
Make sure to replace
<WORKSPACE_ID>with your Log Analytics workspace ID before running the query.SET $WORKSPACE_ID=<WORKSPACE_ID>Run the following command to query the logs table.
az monitor log-analytics query --workspace $WORKSPACE_CUSTOMER_ID --analytics-query "ContainerAppSystemLogs | where ComponentType == 'SpringCloudEureka' | project Time=TimeGenerated, Type=ComponentType, Component=ComponentName, Message=Log | take 5" --out tableThe
projectoperator's parameters specify the table columns.
Next steps
Feedback
Coming soon: Throughout 2024 we will be phasing out GitHub Issues as the feedback mechanism for content and replacing it with a new feedback system. For more information see: https://aka.ms/ContentUserFeedback.
Submit and view feedback for
