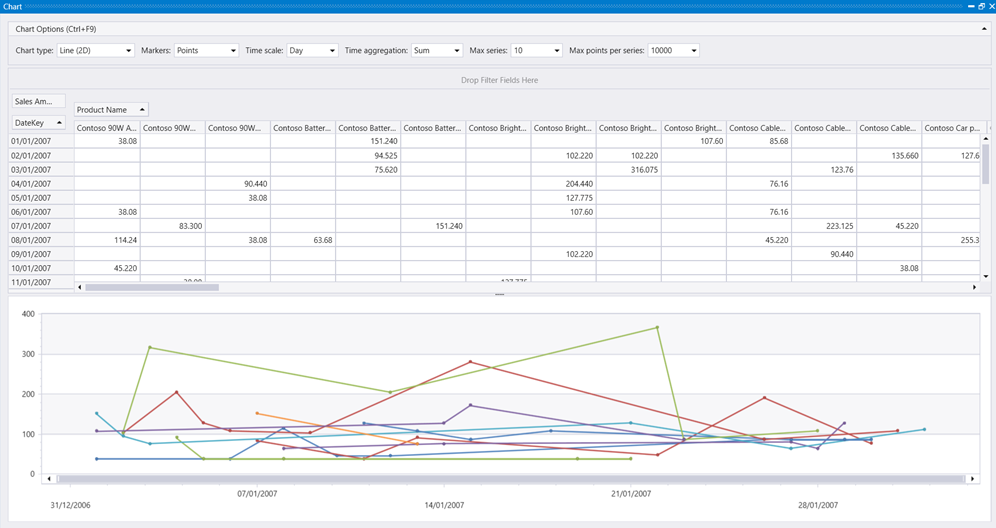
Pivot chart
Displays a pivot table and chart. You can interactively select data, columns, rows, and various chart types.
Note
- This visualization can only be used in the context of the render operator.
- This visualization can be used in Kusto.Explorer but is not available in the Azure Data Explorer web UI.
Syntax
T | render pivotchart
Learn more about syntax conventions.
Parameters
| Name | Type | Required | Description |
|---|---|---|---|
| T | string |
✔️ | Input table name. |
Example
SalesFact
| join kind= inner Products on ProductKey
| where ProductCategoryName has "Computers" and ProductName has "Contoso"
| where DateKey between (datetime(2006-12-31) .. datetime(2007-02-01))
| project SalesAmount, ProductName, DateKey
| render pivotchart
This visualization isn't supported.
Feedback
Coming soon: Throughout 2024 we will be phasing out GitHub Issues as the feedback mechanism for content and replacing it with a new feedback system. For more information see: https://aka.ms/ContentUserFeedback.
Submit and view feedback for
