Quickstart: Visualize sample data dashboards
The Azure Data Explorer web UI has a samples gallery for you to view built-in dashboards without the need to create your own cluster and database or ingest data. Dashboards allow you to manipulate different parameters and visuals to gain insights from your data.
In this quickstart, you'll learn how to access and explore the built-in dashboards in the Azure Data Explorer web UI samples gallery. Knowledge of Kusto Query Language (KQL) isn't required to create and modify your dashboards but can be used for further customization.
Prerequisites
A Microsoft account or a Microsoft Entra user identity to sign in to the help cluster. An Azure subscription isn't required.
Explore sample dashboards
Sign in to the Azure Data Explorer web UI using your Microsoft account or Microsoft Entra user identity.
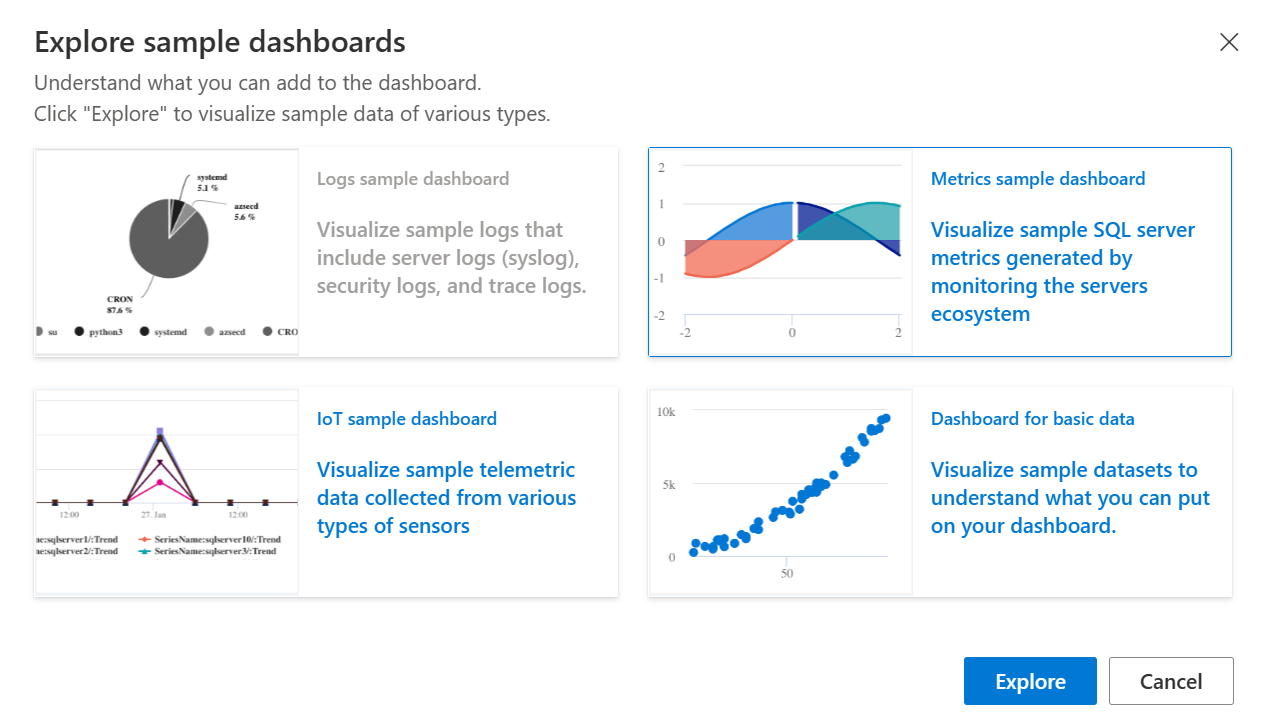
In the Home page, select Explore sample dashboards.
In the Explore sample dashboards dialog box, choose a sample dashboard and then select Explore. In keeping with the previous example, select the Metrics sample dashboard.
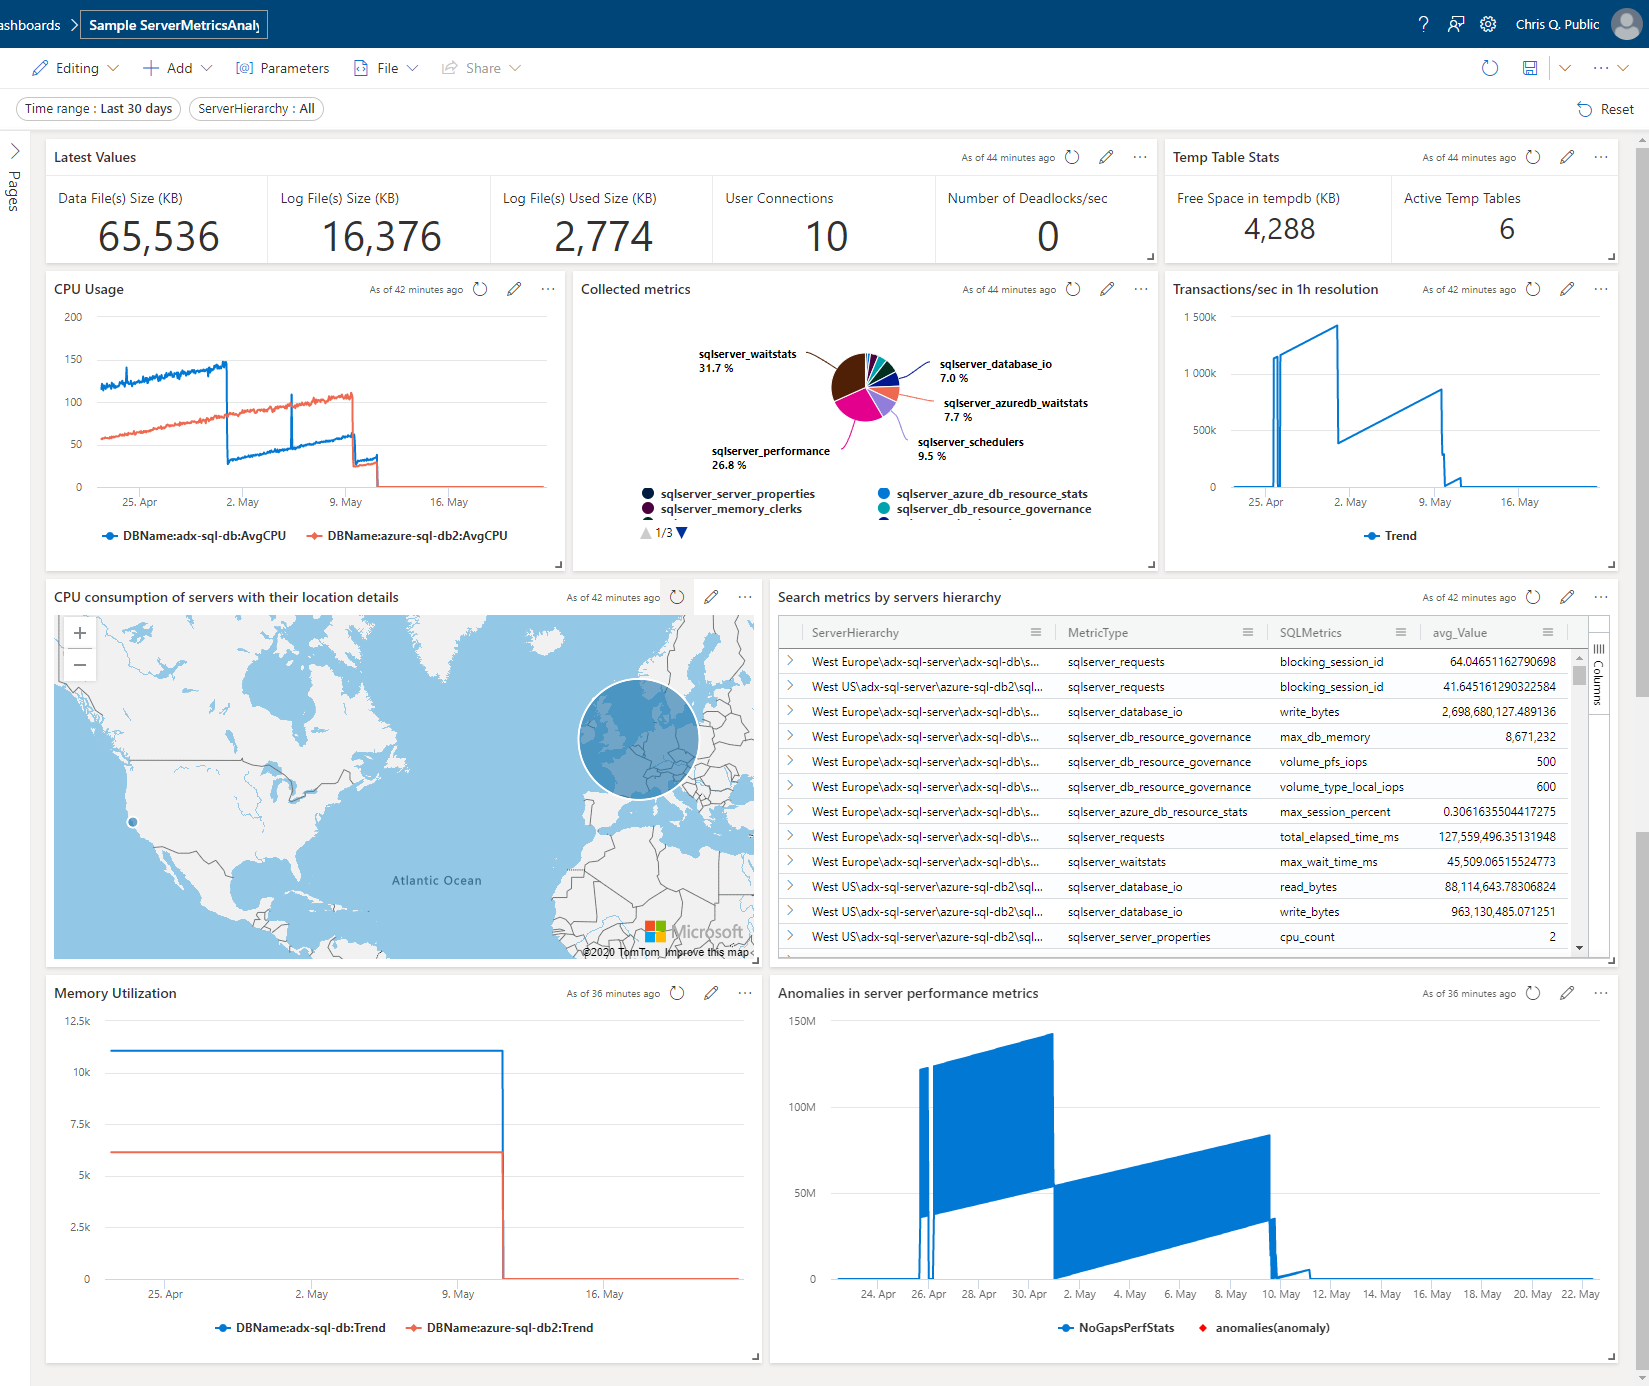
The dashboard opens in edit mode and presents various pre-configured tile options for customization.
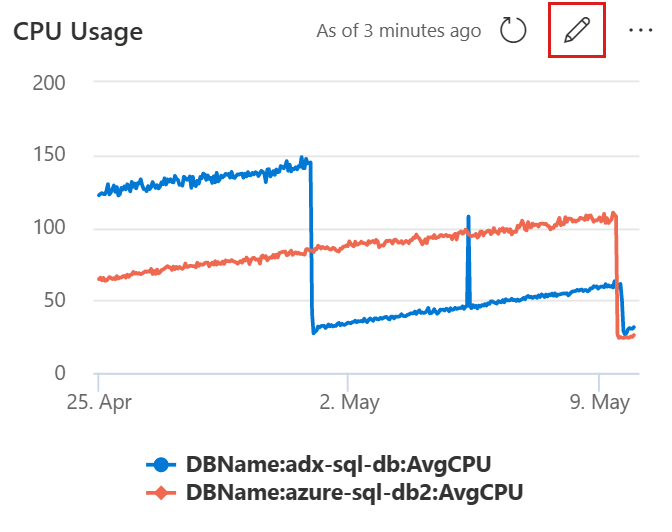
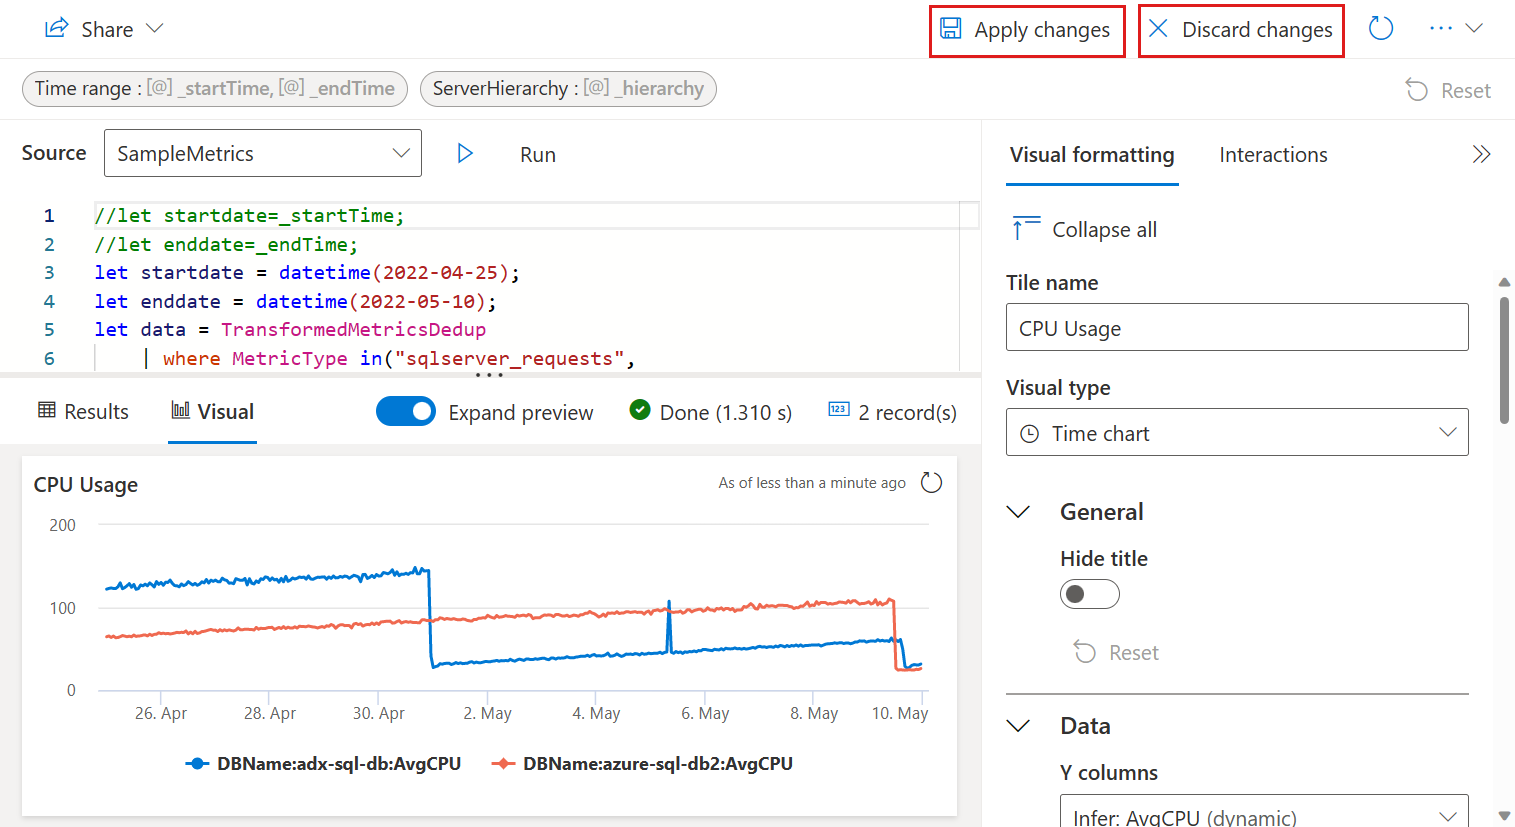
Select the edit icon on the CPU Usage tile to access the underlying KQL query and formatting options. Explore the various tabs that allow you to adjust the visual display and review the results. Take some time to familiarize yourself with the features and options available.
Select Apply changes or Discard changes to save or discard your changes. This will take you back to the main dashboard.
Learn how to view parameters and customize visuals.

Related content
Feedback
Coming soon: Throughout 2024 we will be phasing out GitHub Issues as the feedback mechanism for content and replacing it with a new feedback system. For more information see: https://aka.ms/ContentUserFeedback.
Submit and view feedback for