Events
Mar 31, 11 PM - Apr 2, 11 PM
The ultimate Microsoft Fabric, Power BI, SQL, and AI community-led event. March 31 to April 2, 2025.
Register todayThis browser is no longer supported.
Upgrade to Microsoft Edge to take advantage of the latest features, security updates, and technical support.
APPLIES TO:  Azure Data Factory
  Azure Synapse Analytics
Tip
Try out Data Factory in Microsoft Fabric, an all-in-one analytics solution for enterprises. Microsoft Fabric covers everything from data movement to data science, real-time analytics, business intelligence, and reporting. Learn how to start a new trial for free!
Data flows are available both in Azure Data Factory and Azure Synapse Pipelines. This article applies to mapping data flows. If you are new to transformations, please refer to the introductory article Transform data using a mapping data flow.
The Aggregate transformation defines aggregations of columns in your data streams. Using the Expression Builder, you can define different types of aggregations such as SUM, MIN, MAX, and COUNT grouped by existing or computed columns.
Select an existing column or create a new computed column to use as a group by clause for your aggregation. To use an existing column, select it from the dropdown. To create a new computed column, hover over the clause and click Computed column. This opens the data flow expression builder. Once you create your computed column, enter the output column name under the Name as field. If you wish to add an additional group by clause, hover over an existing clause and click the plus icon.
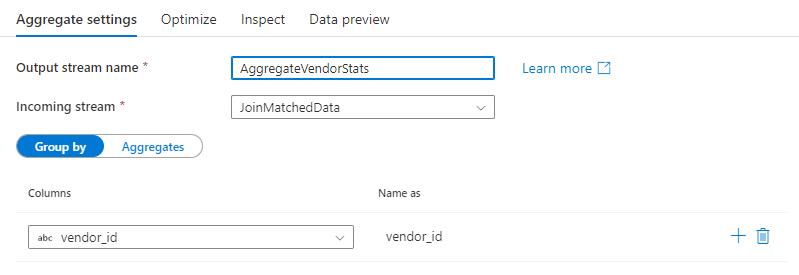
A group by clause is optional in an Aggregate transformation.
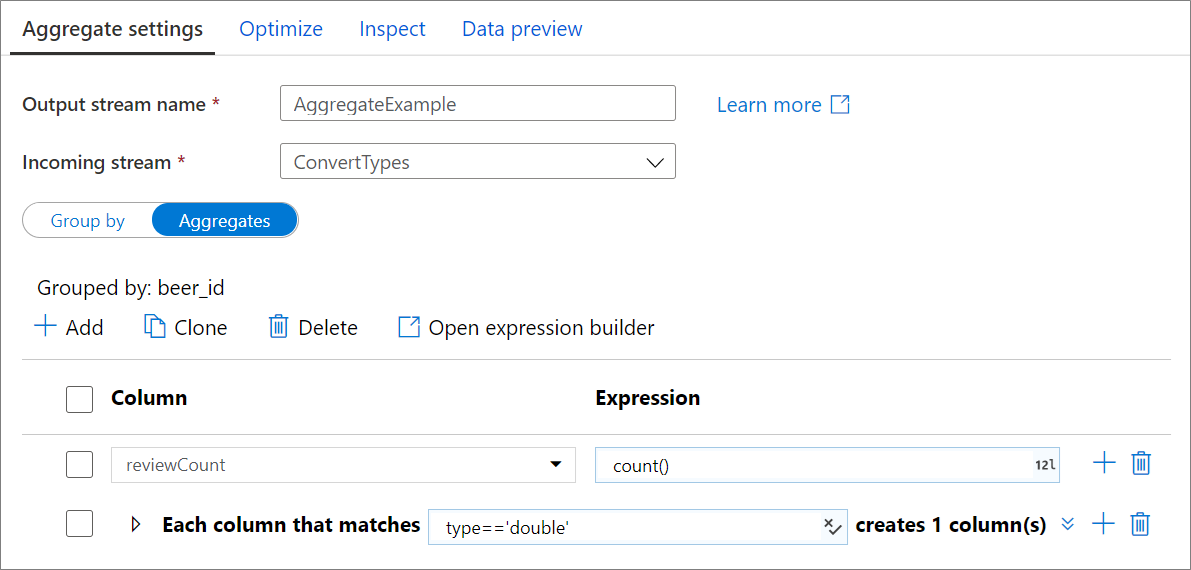
Go to the Aggregates tab to build aggregation expressions. You can either overwrite an existing column with an aggregation, or create a new field with a new name. The aggregation expression is entered in the right-hand box next to the column name selector. To edit the expression, click on the text box and open the expression builder. To add more aggregate columns, click on Add above the column list or the plus icon next to an existing aggregate column. Choose either Add column or Add column pattern. Each aggregation expression must contain at least one aggregate function.
Note
In Debug mode, the expression builder cannot produce data previews with aggregate functions. To view data previews for aggregate transformations, close the expression builder and view the data via the 'Data Preview' tab.
Use column patterns to apply the same aggregation to a set of columns. This is useful if you wish to persist many columns from the input schema as they are dropped by default. Use a heuristic such as first() to persist input columns through the aggregation.
Aggregate transformations are similar to SQL aggregate select queries. Columns that aren't included in your group by clause or aggregate functions won't flow through to the output of your aggregate transformation. If you wish to include other columns in your aggregated output, do one of the following methods:
last() or first() to include that additional column.A common use of the aggregate transformation is removing or identifying duplicate entries in source data. This process is known as deduplication. Based upon a set of group by keys, use a heuristic of your choosing to determine which duplicate row to keep. Common heuristics are first(), last(), max(), and min(). Use column patterns to apply the rule to every column except for the group by columns.
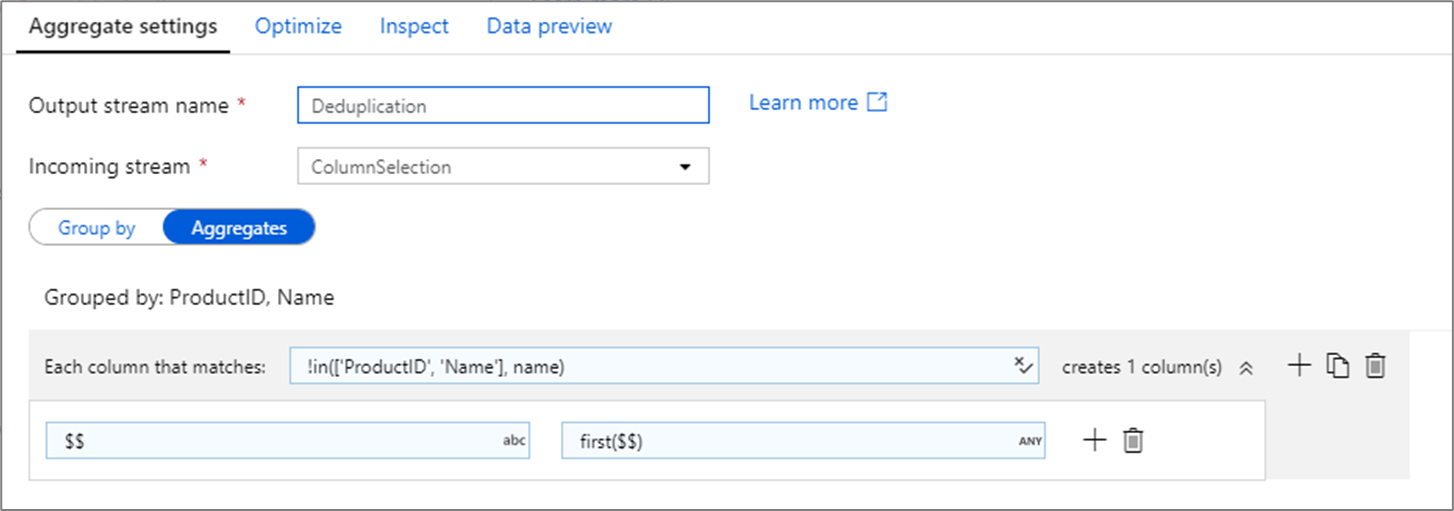
In the above example, columns ProductID and Name are being use for grouping. If two rows have the same values for those two columns, they're considered duplicates. In this aggregate transformation, the values of the first row matched will be kept and all others will be dropped. Using column pattern syntax, all columns whose names aren't ProductID and Name are mapped to their existing column name and given the value of the first matched rows. The output schema is the same as the input schema.
For data validation scenarios, the count() function can be used to count how many duplicates there are.
<incomingStream>
    aggregate(
           groupBy(
                <groupByColumnName> = <groupByExpression1>,
                <groupByExpression2>
               ),
           <aggregateColumn1> = <aggregateExpression1>,
           <aggregateColumn2> = <aggregateExpression2>,
           each(
                match(matchExpression),
                <metadataColumn1> = <metadataExpression1>,
                <metadataColumn2> = <metadataExpression2>
               )
          ) ~> <aggregateTransformationName>
The below example takes an incoming stream MoviesYear and groups rows by column year. The transformation creates an aggregate column avgrating that evaluates to the average of column Rating. This aggregate transformation is named AvgComedyRatingsByYear.
In the UI, this transformation looks like the below image:
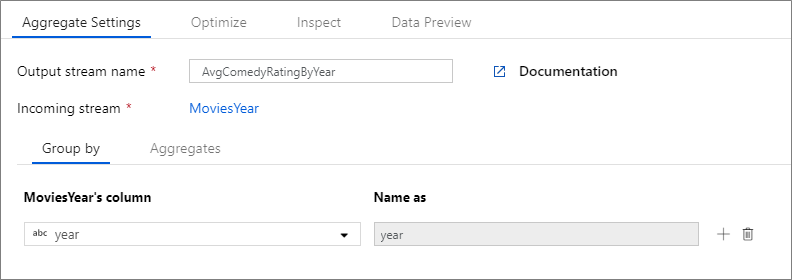

The data flow script for this transformation is in the snippet below.
MoviesYear aggregate(
                groupBy(year),
                avgrating = avg(toInteger(Rating))
            ) ~> AvgComedyRatingByYear
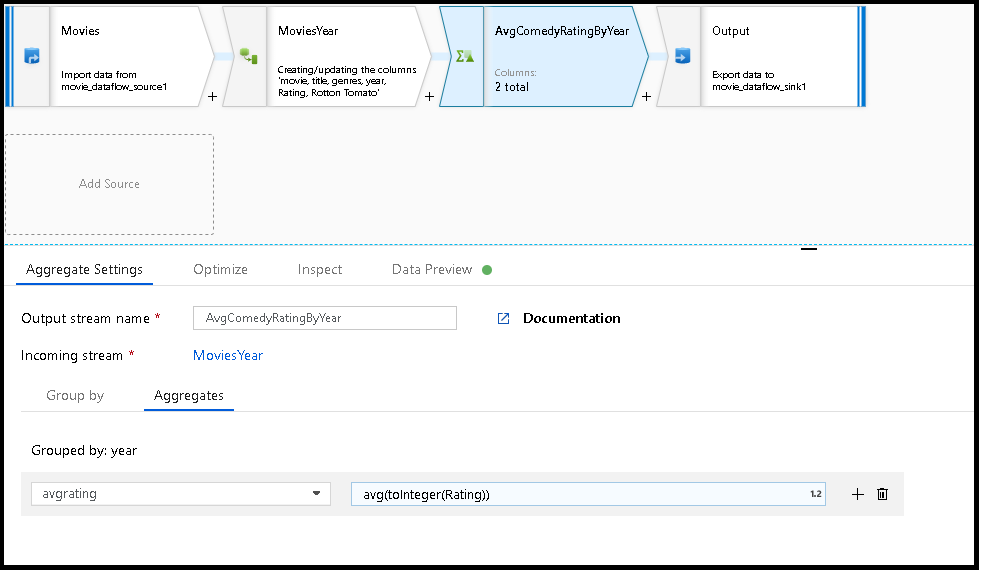
MoviesYear: Derived Column defining year and title columns
AvgComedyRatingByYear: Aggregate transformation for average rating of comedies grouped by year
avgrating: Name of new column being created to hold the aggregated value
MoviesYear aggregate(groupBy(year),
	avgrating = avg(toInteger(Rating))) ~> AvgComedyRatingByYear
Events
Mar 31, 11 PM - Apr 2, 11 PM
The ultimate Microsoft Fabric, Power BI, SQL, and AI community-led event. March 31 to April 2, 2025.
Register today