Diagnostics logs and metrics for Workflow Orchestration Manager
Note
Workflow Orchestration Manager is powered by Apache Airflow.
This article walks you through the steps to:
- Enable diagnostics logs and metrics for Workflow Orchestration Manager in Azure Data Factory.
- View logs and metrics.
- Run a query.
- Monitor metrics and set the alert system in directed acyclic graph (DAG) failure.
Prerequisites
You need an Azure subscription. If you don't have an Azure subscription, create a free Azure account before you begin.
Enable diagnostics logs and metrics for Workflow Orchestration Manager
Open your Data Factory resource and select Diagnostic settings on the leftmost pane. Then select Add diagnostic setting.

Fill out the Diagnostic settings name. Select the following categories for the Airflow logs:
- Airflow task execution logs
- Airflow worker logs
- Airflow DAG processing logs
- Airflow scheduler logs
- Airflow web logs
- If you select AllMetrics, various Data Factory metrics are made available for you to monitor or raise alerts on. These metrics include the metrics for Data Factory activity and the Workflow Orchestration Manager integration runtime, such as
AirflowIntegrationRuntimeCpuUsageandAirflowIntegrationRuntimeMemory.

Under Destination details, select the Send to Log Analytics workspace checkbox.
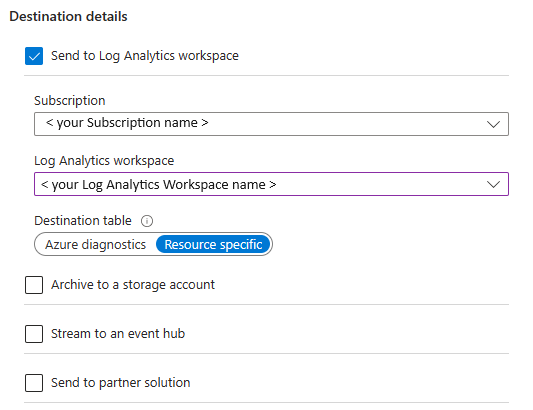
Select Save.


View logs
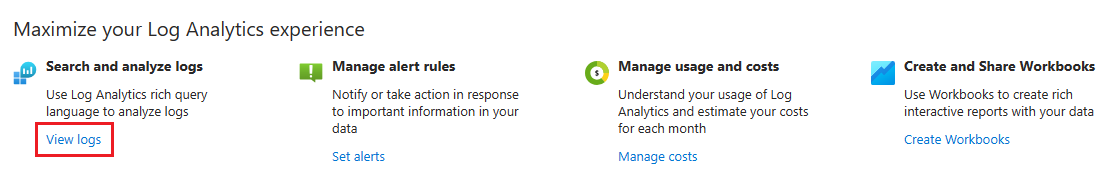
After you add diagnostic settings, you can find them listed in the Diagnostic setting section. To access and view logs, select the Log Analytics workspace that you configured.

Under the section Maximize your Log Analytics experience, select View logs.
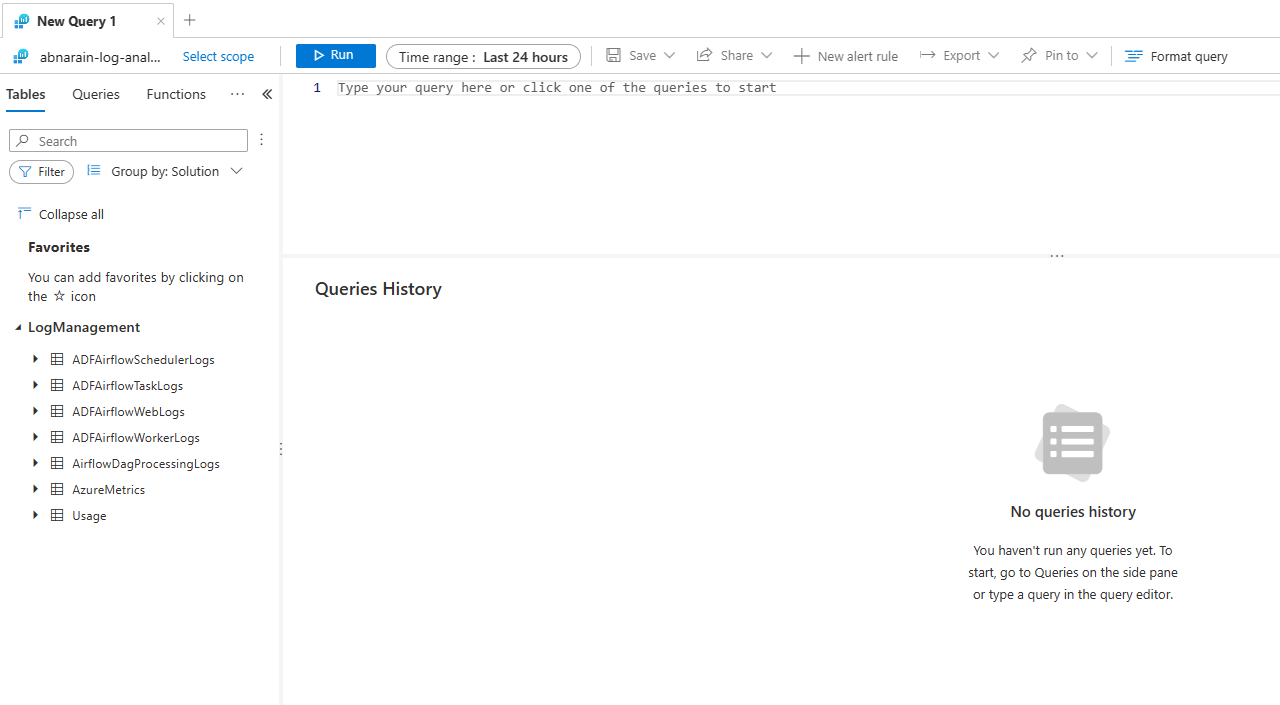
You're directed to your Log Analytics workspace where you can see that the tables you selected were imported into the workspace automatically.


Other useful links for the schema:
- Azure Monitor Logs reference - ADFAirflowSchedulerLogs | Microsoft Learn
- Azure Monitor Logs reference - ADFAirflowTaskLogs | Microsoft Learn
- Azure Monitor Logs reference - ADFAirflowWebLogs | Microsoft Learn
- Azure Monitor Logs reference - ADFAirflowWorkerLogs | Microsoft Learn
- Azure Monitor Logs reference - AirflowDagProcessingLogs | Microsoft Learn
Write a query
Let's start with the simplest query that returns all the records in
ADFAirflowTaskLogs. You can double-click the table name to add it to a query window. You can also enter the table name directly in the window.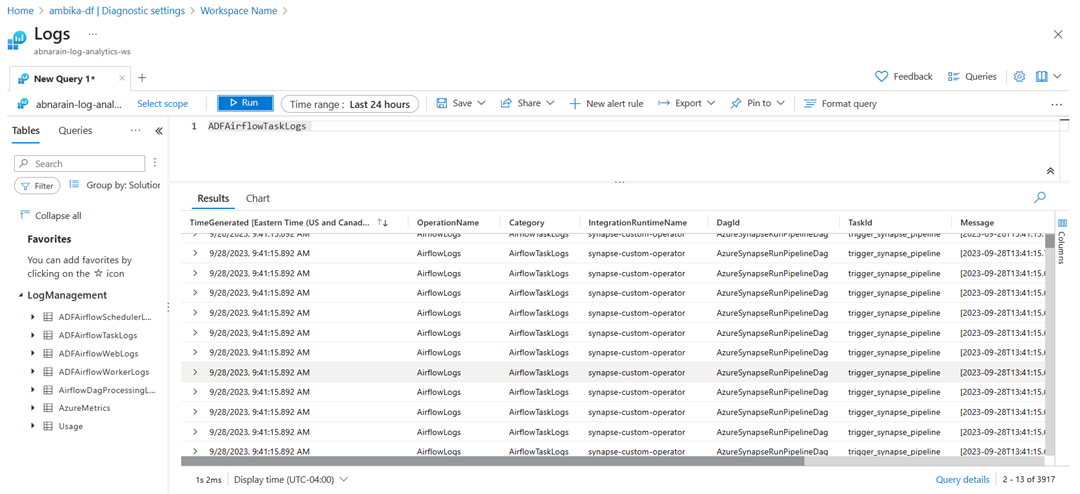
To narrow down your search results, such as filtering them based on a specific task ID, you can use the following query:
ADFAirflowTaskLogs
| where DagId == "<your_dag_id>"
and TaskId == "<your_task_id>"

Similarly, you can create custom queries according to your needs by using any tables available in LogManagement.
For more information, see:
Monitor metrics
Data Factory offers comprehensive metrics for Airflow integration runtimes, allowing you to effectively monitor the performance of your Airflow integration runtime and establish alerting mechanisms as needed.
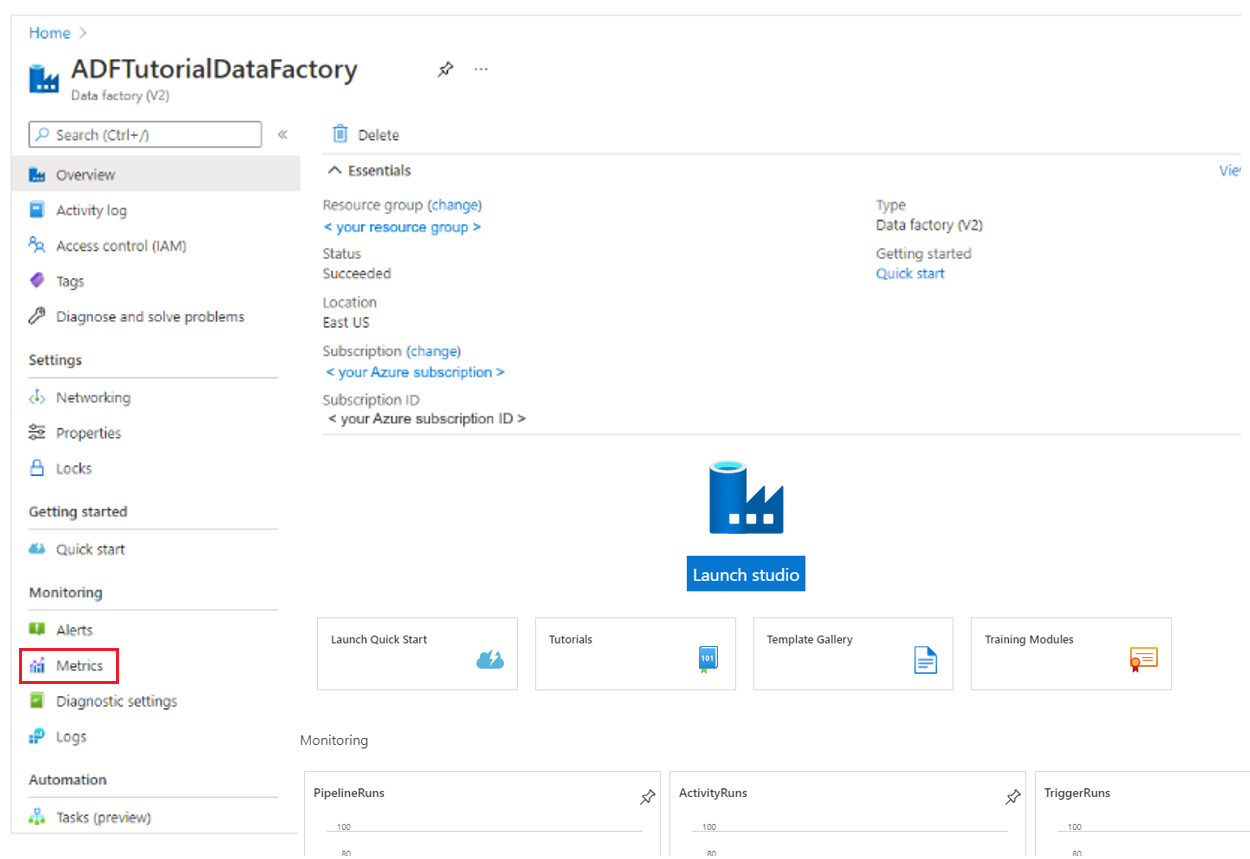
Open your Data Factory resource.
In the leftmost pane, under the Monitoring section, select Metrics.
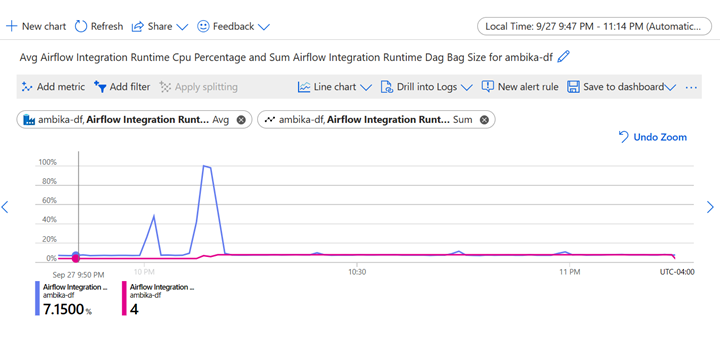
Select the Scope > Metric Namespace > Metric you want to monitor.

Review the multiline chart that visualizes the Integration Runtime CPU Percentage and Integration Runtime Dag Bag Size.
You can set up an alert rule that triggers when your metrics meet specific conditions. For more information, see Overview of Azure Monitor alerts.
Select Save to dashboard after your chart is finished or else your chart disappears.


Airflow metrics
To see the metrics available for Workflow Orchestration Manager, view the Airflow metrics listed in the Supported metrics table.
Feedback
Coming soon: Throughout 2024 we will be phasing out GitHub Issues as the feedback mechanism for content and replacing it with a new feedback system. For more information see: https://aka.ms/ContentUserFeedback.
Submit and view feedback for