Diagnostics logs
Diagnostic settings in Azure are used to collect resource logs. An Azure resource emits resource logs and provides rich, frequent data about the operation of that resource. These logs are captured per request and are also referred to as "data plane logs". See Diagnostic settings in Azure Monitor for a recommended overview of the functionality in Azure. The content of these logs varies by resource type. In Managed DevOps Pools, two options are available to log:
- Managed DevOps Pools Metrics (AllMetrics) used to log metrics from Azure Monitor
- Choose from the same metrics you use in the Monitoring > Metrics tab.
- Resource Provisioning Logs logs provisioning events for the agents in your pool.
- These are the same events you can view in the Agents view.
Create diagnostic setting
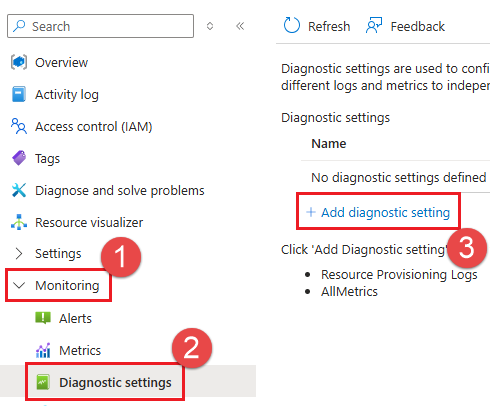
To create a new diagnostic setting, choose Monitoring > Diagnostic settings, and choose +Add diagnostic setting.
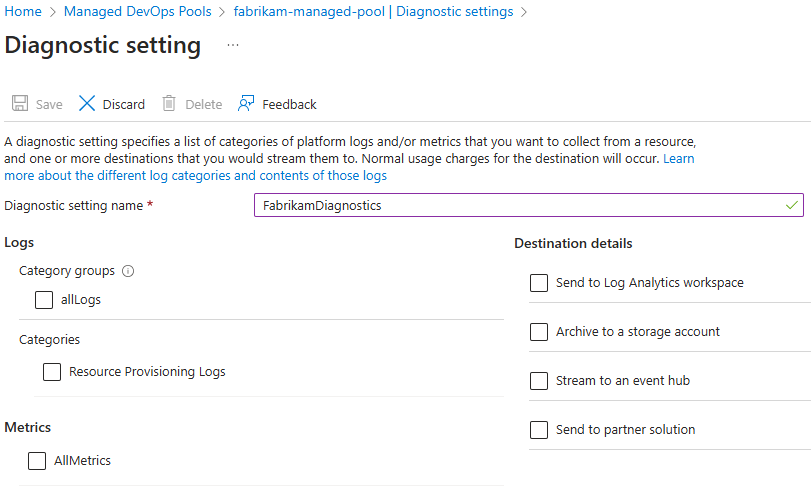
Choose the type of log to capture, and one or more options from Destination details, and choose Save.
Run jobs in your pool, and then review the collected data. For information on analyzing diagnostic log data, see Analyze and visualize monitoring data. The diagnostic data contains log entries similar to the following example.
 {
     "time": "2024-07-15T17:23:42.0302794Z",
     "resourceId": "/SUBSCRIPTIONS/SUBSCRIPTION_ID_PLACEHOLDER/RESOURCEGROUPS/FABRIKAM-POOLS/PROVIDERS/MICROSOFT.DEVOPSINFRASTRUCTURE/POOLS/FABRIKAM_POOL",
     "location": "eastus",
     "category": "ProvisioningLogs",
     "operationName": "Provision",
     "properties": {
         "RequestId": "RequestId_Placeholder",
         "AgentName": "7ec0d355c",
         "Image": "/canonical/0001-com-ubuntu-server-focal/20_04-lts-gen2/20.04.202407040",
         "Sku": "Standard_D2ads_v5",
         "Status": "Completed"
     }
 }
See also
- Analyze and visualize monitoring data
- For more information about diagnostic settings and the different destinations for logs, see Diagnostic settings in Azure Monitor.