Create a dashboard without a team - Sprint 162 Update
In the Sprint 162 Update of Azure DevOps, we are excited to announce that you can create a dashboard without associating it to a team. The dashboard will be visible to everyone in the project and you can decide who can edit/manage it.
In addition, we've added the sprint burndown thumbnail. Now you can configure it to burndown based on stories, story points, or by count of tasks.
Check out the Features list below for more.
Features
Azure Repos:
Azure Pipelines:
- Updated multi-stage pipelines UI
- VSTest TestResultsDirectory option is available in the task UI
- Use extends keyword in pipelines
- Markdown support in automated test error messages
- Collect automatic and user-specified metadata from pipeline
- Updates to service connections UI
- VM deployments with Environments
- Skipping stages in a YAML pipeline
Reporting:
Azure Repos
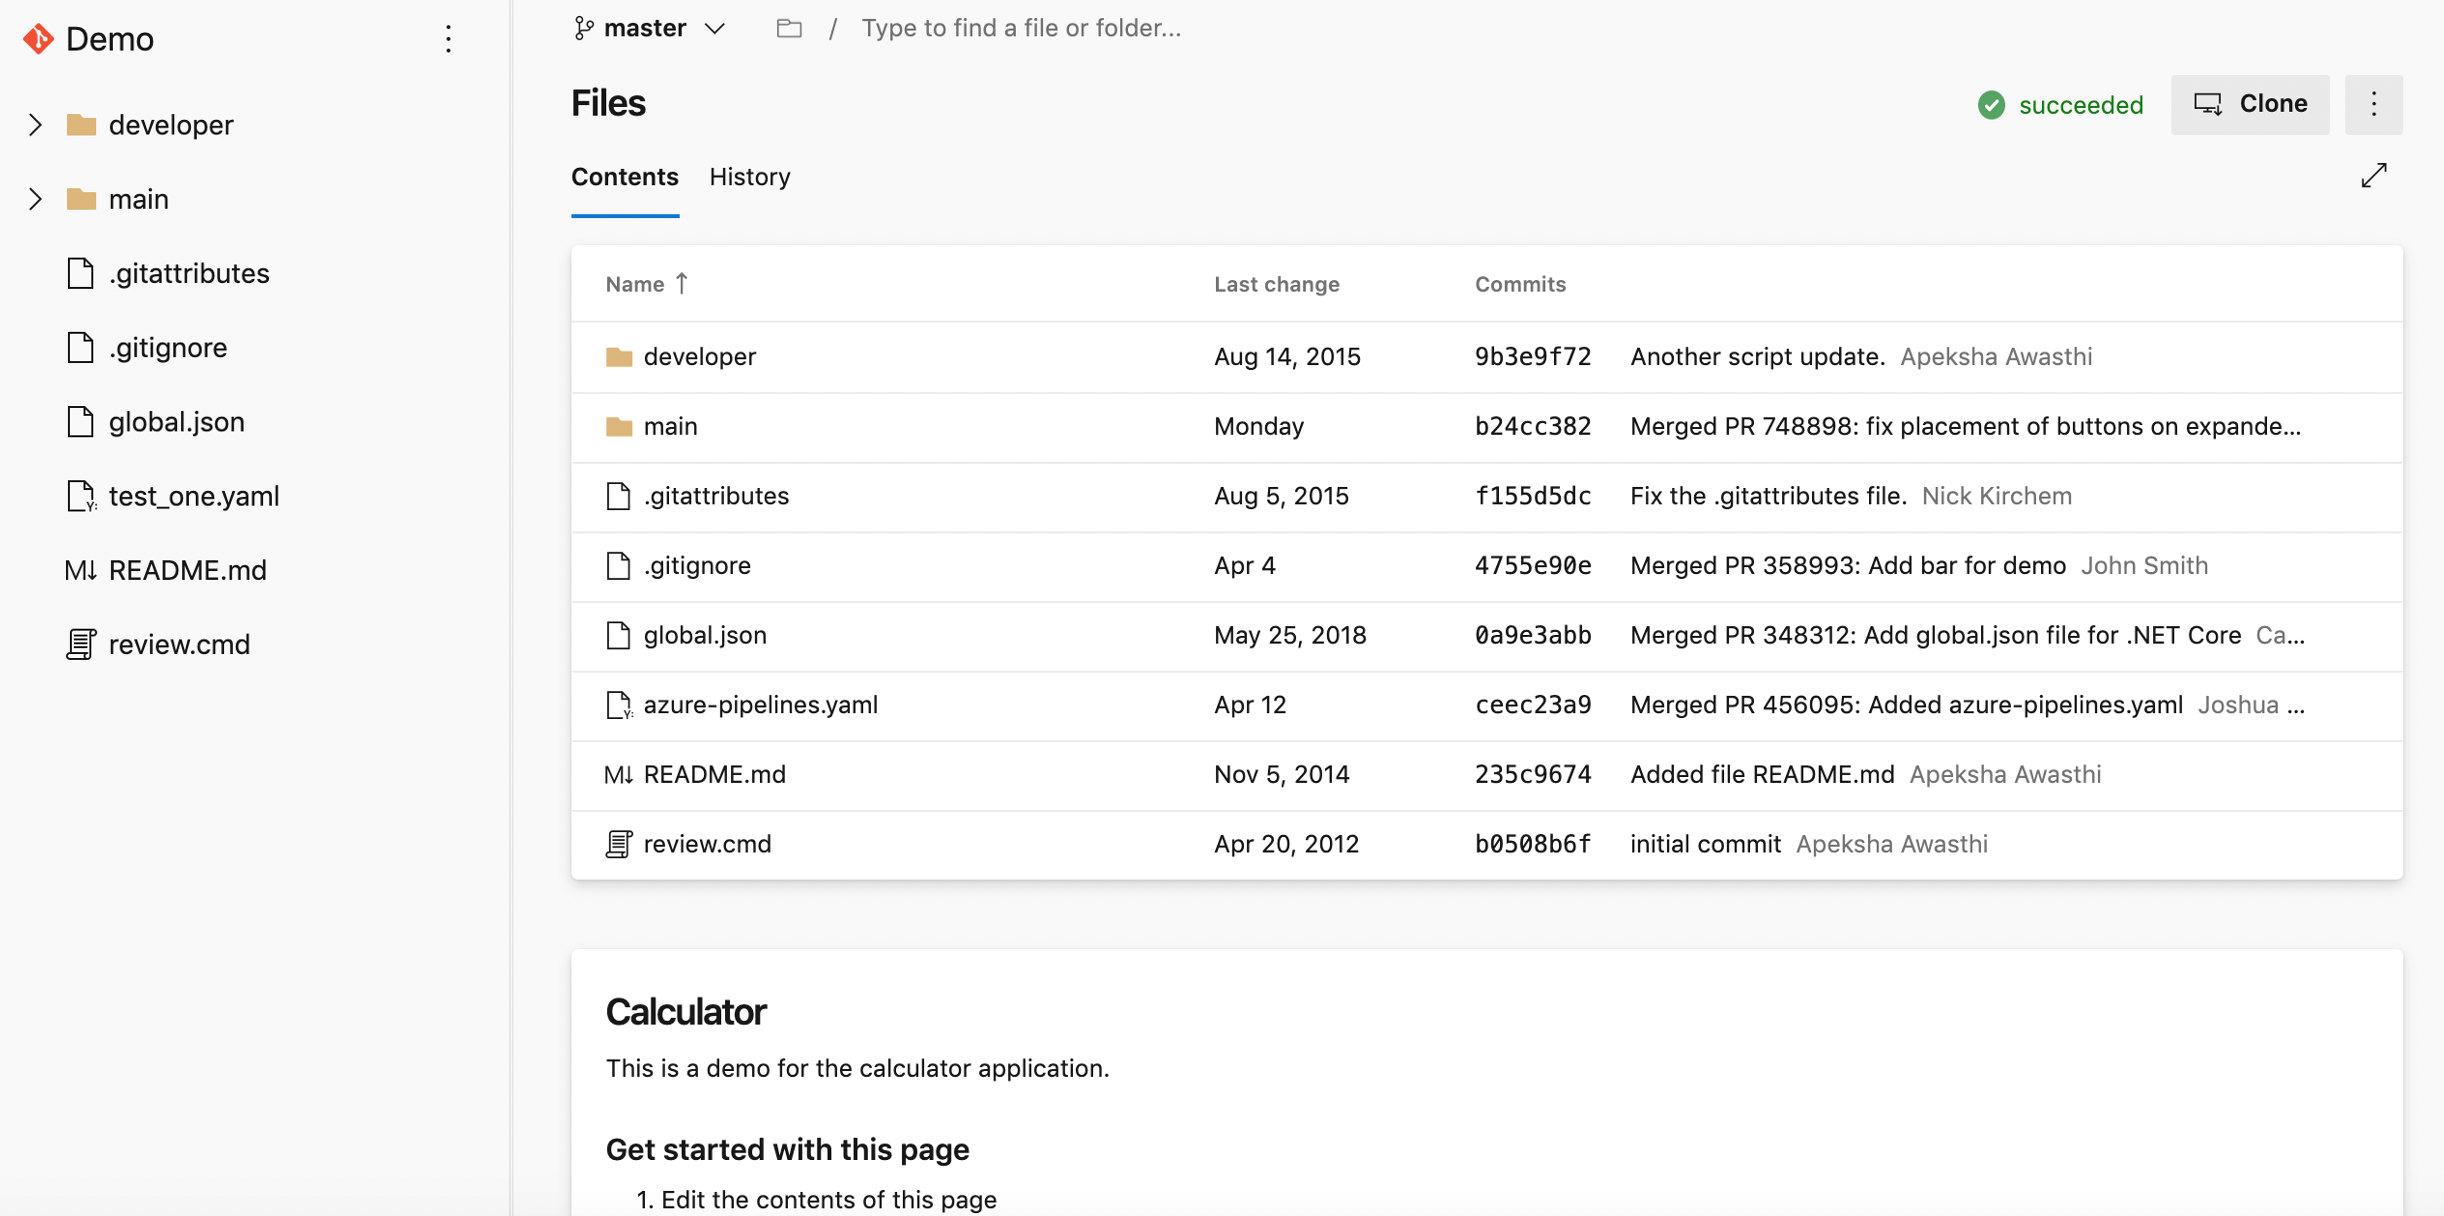
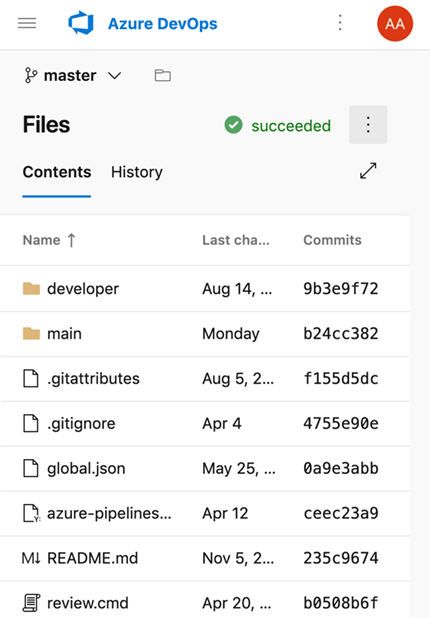
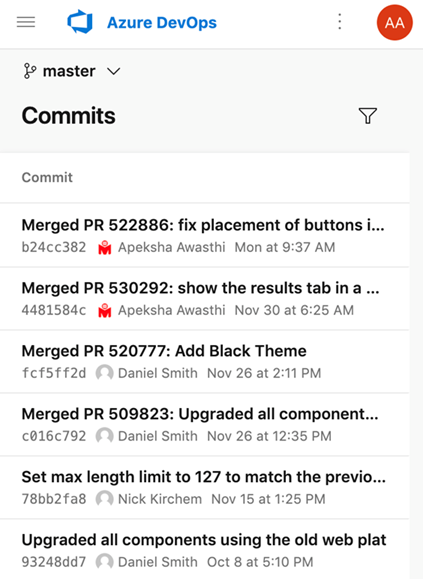
New web platform conversion landing pages
We've updated the Repos landing pages user experience to make it modern, fast, and mobile-friendly. Here are two examples of the pages that have been updated, we will continue to update other pages in future updates.
Web experience:
Mobile experience:
Support for Kotlin language
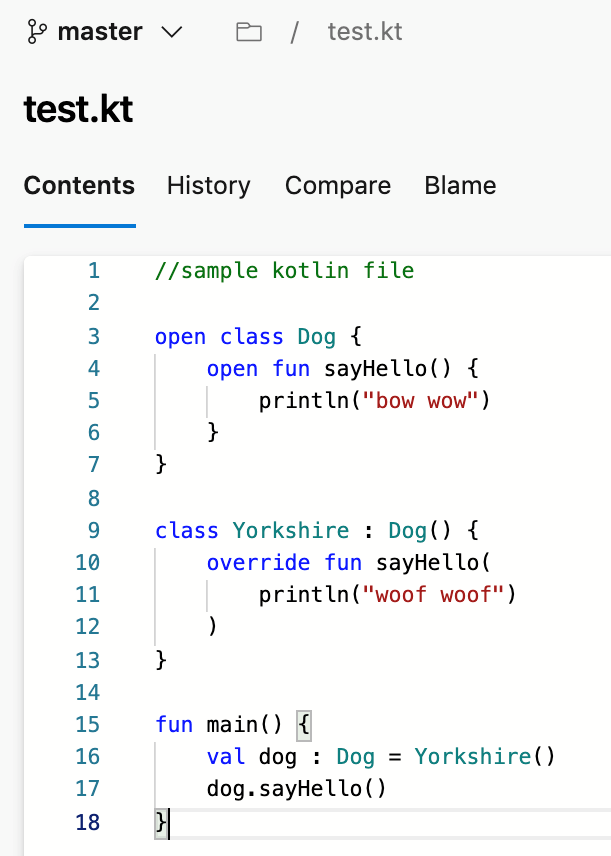
We're excited to announce that we now support Kotlin language highlighting in the file editor. Highlighting will improve the readability of your Kotlin text file and help you quickly scan to find errors. We prioritized this feature based on a suggestion from the Developer Community.
Azure Pipelines
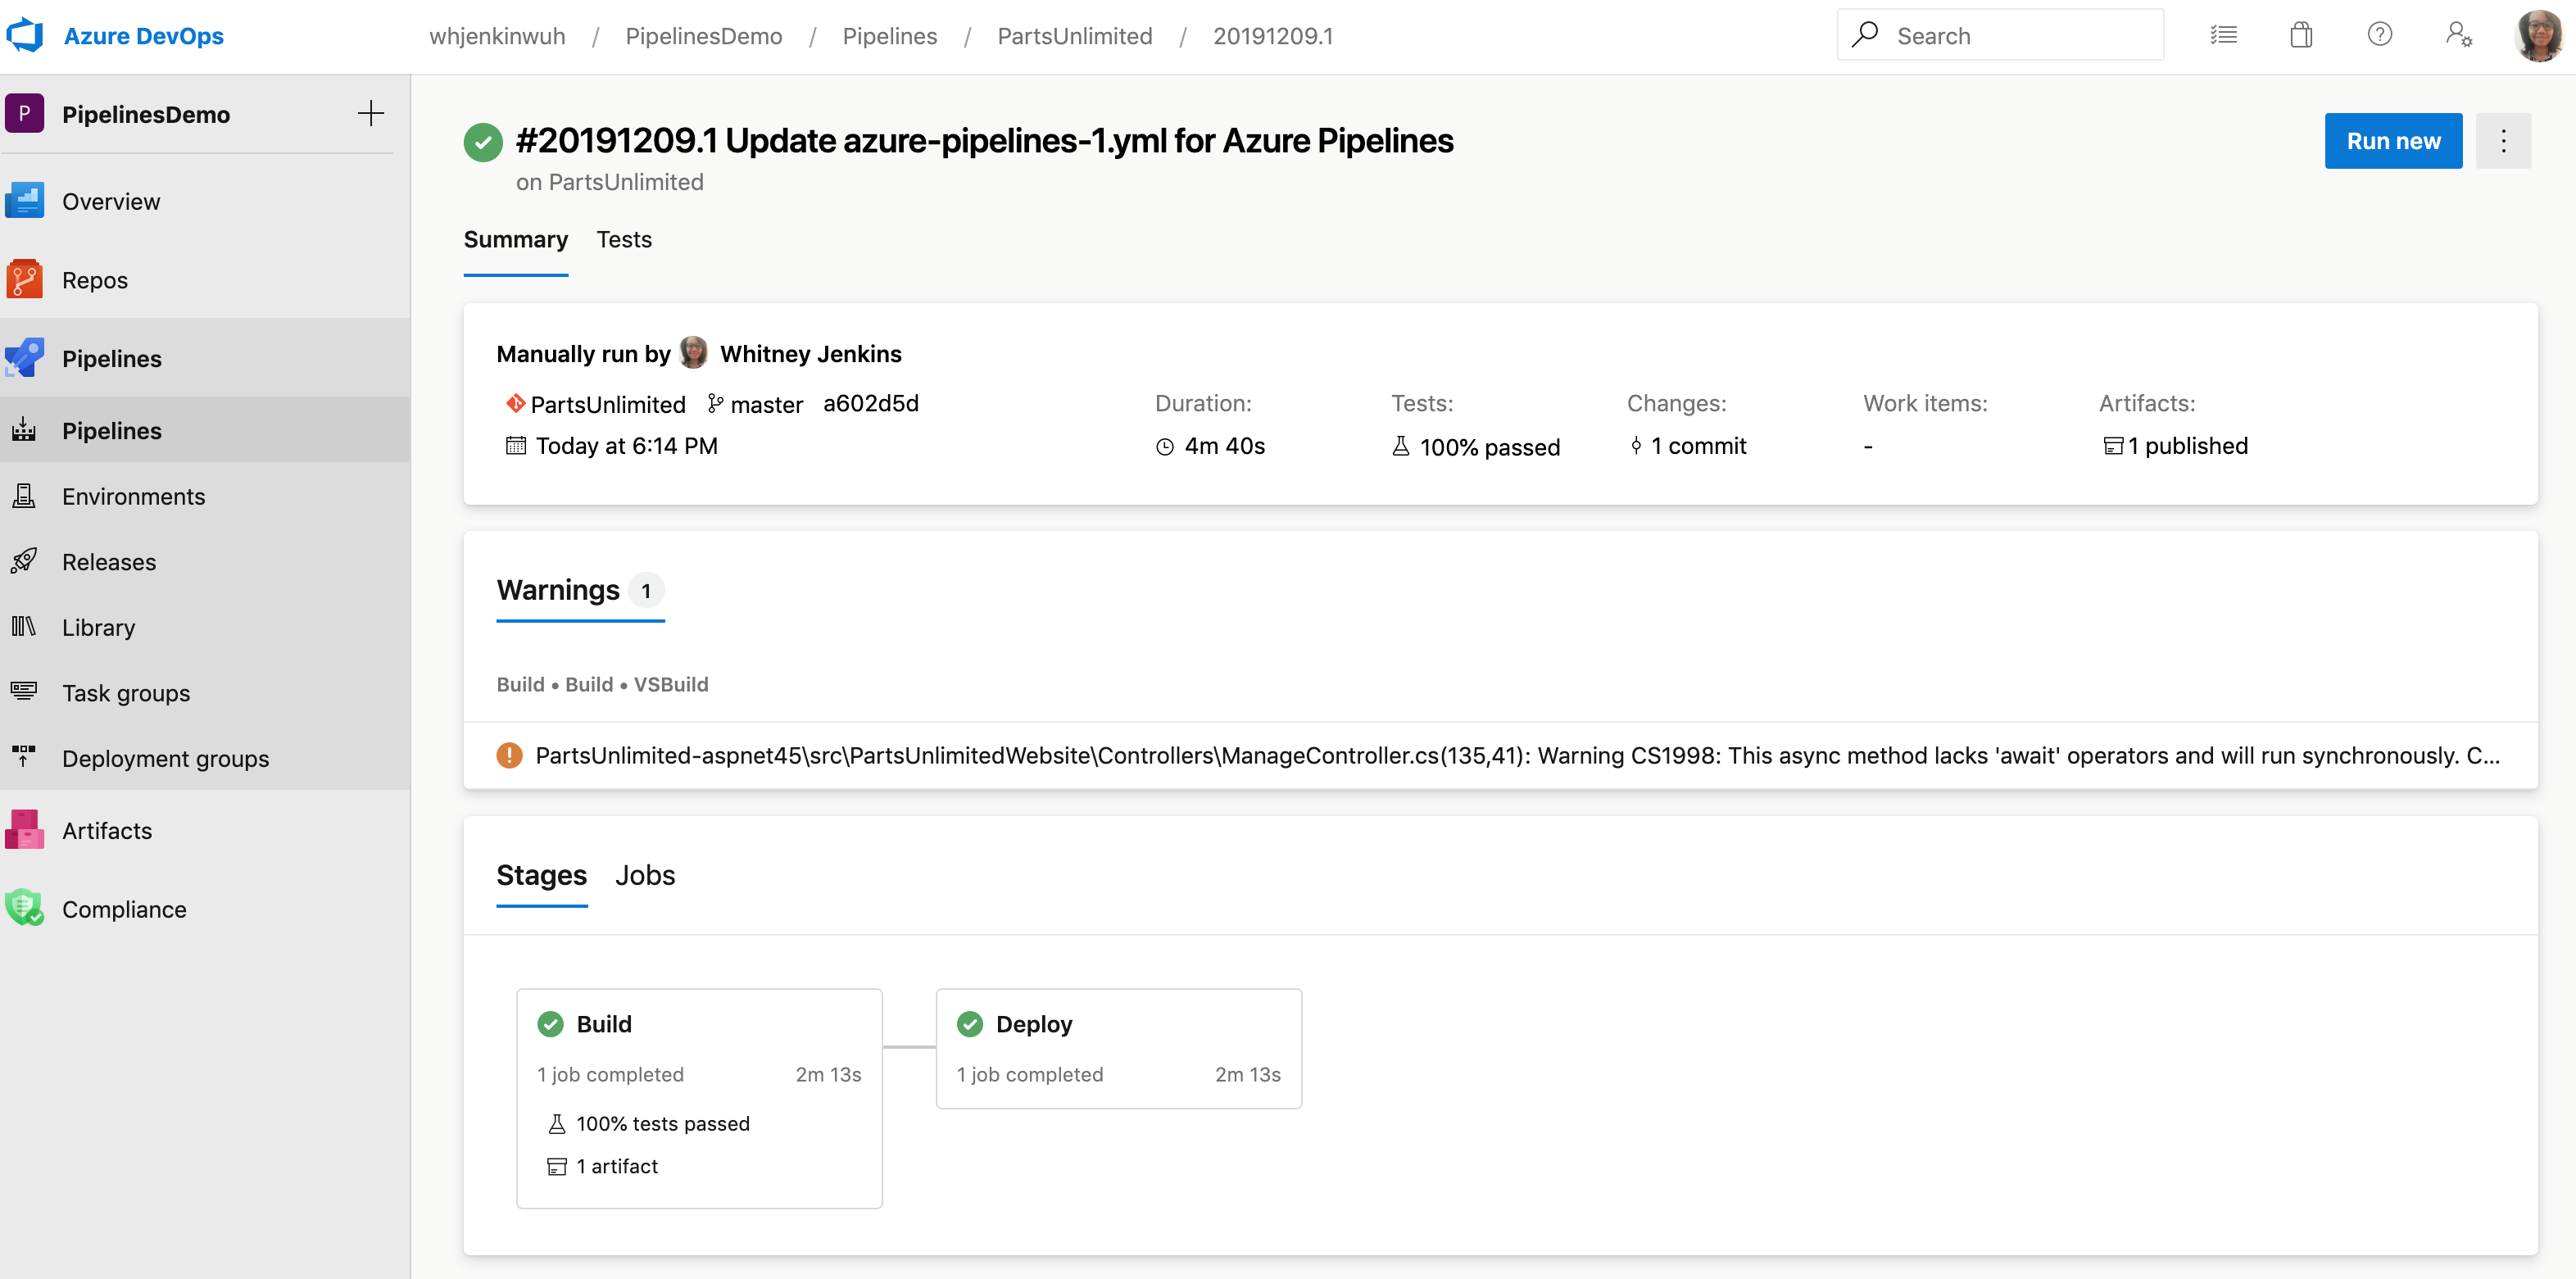
Updated multi-stage pipelines UI
An updated version of the multi-stage pipelines UI is now available by default. The multi-stage pipelines experience brings improvements and ease of use to the pipeline's portal UI. You can view and manage your pipelines by choosing Pipelines from the left-hand menu. In addition, you can drill down and view pipeline details, run details, pipeline analytics, job details, logs, and more.
To learn more about the multi-stage pipelines user experience, see the documentation here.
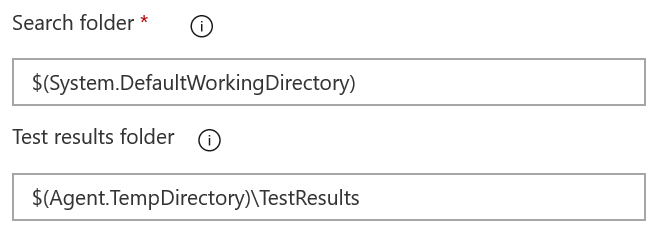
VSTest TestResultsDirectory option is available in the task UI
The VSTest task stores test results and associated files in the $(Agent.TempDirectory)\TestResults folder. We've added an option to the task UI to let you configure a different folder to store test results. Now any subsequent tasks that need the files in a particular location can use them.
Use extends keyword in pipelines
Currently, pipelines can be factored out into templates, promoting reuse and reducing boilerplate. The overall structure of the pipeline was still defined by the root YAML file. With this update, we added a more structured way to use pipeline templates. A root YAML file can now use the keyword extends to indicate that the main pipeline structure can be found in another file. This puts you in control of what segments can be extended or altered and what segments are fixed. We've also enhanced pipeline parameters with data types to make clear the hooks that you can provide.
This example illustrates how you can provide simple hooks for the pipeline author to use. The template will always run a build, will optionally run additional steps provided by the pipeline, and then run an optional testing step.
# azure-pipelines.yml
extends:
  template: build-template.yml
  parameters:
    runTests: true
    postBuildSteps:
    - script: echo This step runs after the build!
    - script: echo This step does too!

# build-template.yml
parameters:
- name: runTests
  type: boolean
  default: false
- name: postBuildSteps
  type: stepList
  default: []
steps:
- task: MSBuild@1   # this task always runs
- ${{ if eq(parameters.runTests, true) }}:
  - task: VSTest@2  # this task is injected only when runTests is true
- ${{ each step in parameters.postBuildSteps }}:
  - ${{ step }}
Markdown support in automated test error messages
We've added Markdown support to error messages for automated tests. Now you can easily format error messages for both test run and test result to improve readability and ease the test failure troubleshooting experience in Azure Pipelines. The supported Markdown syntax can be found here.

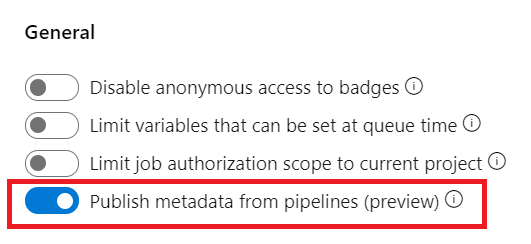
Collect automatic and user-specified metadata from pipeline
Now you can enable automatic and user-specified metadata collection from pipeline tasks. You can use metadata to enforce artifact policy on an environment using the evaluate artifact check.
Updates to service connections UI
We've been working on an updated user experience to manage your service connections. These updates make the service connection experience modern and consistent with the direction of Azure DevOps. We introduced the new UI for service connections as a preview feature earlier this year. Thanks to everyone who tried the new experience and provided their valuable feedback to us.
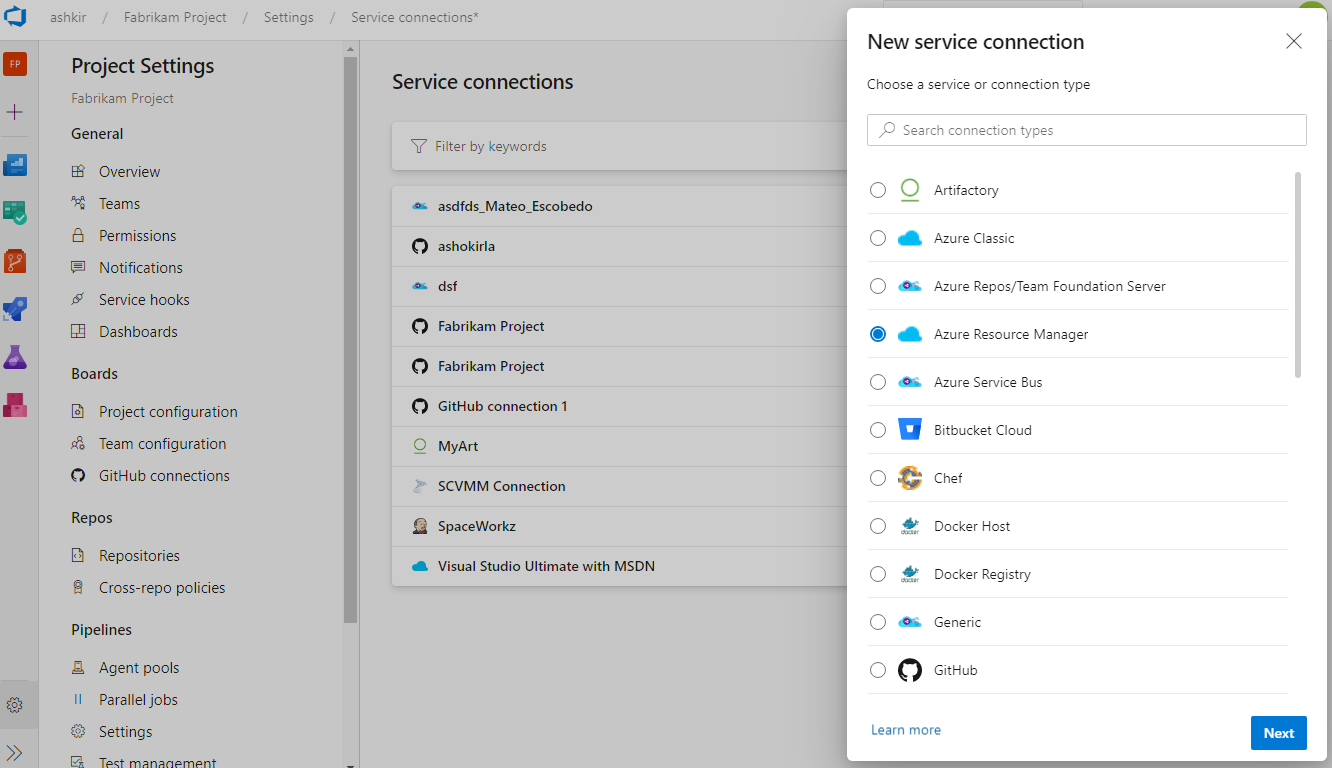
Along with the user experience refresh, we've also added two capabilities which are critical for consuming service connections in YAML pipelines: pipeline authorizations and approvals and checks.
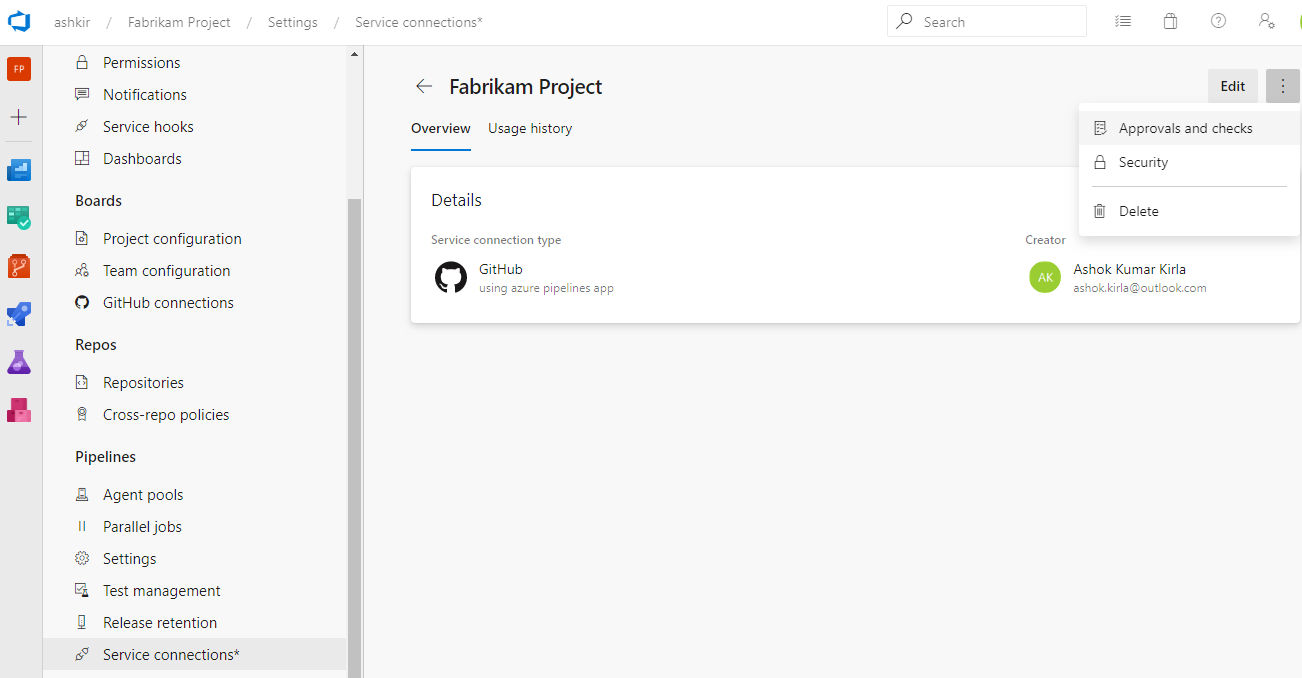
The new user experience will be turned on by default with this update. You will still have the option to opt-out of the preview.
Note
We plan to introduce Cross-project Sharing of Service Connections as a new capability. You can find more details about the sharing experience and the security roles here.
VM deployments with Environments
One of the most requested features in Environments was VM deployments. With this update, we are enabling Virtual Machine resource in Environments. You can now orchestrate deployments across multiple machines and perform rolling updates using YAML pipelines. You can also install the agent on each of your target servers directly and drive rolling deployment to those servers. In addition, you can use the full task catalog on your target machines.
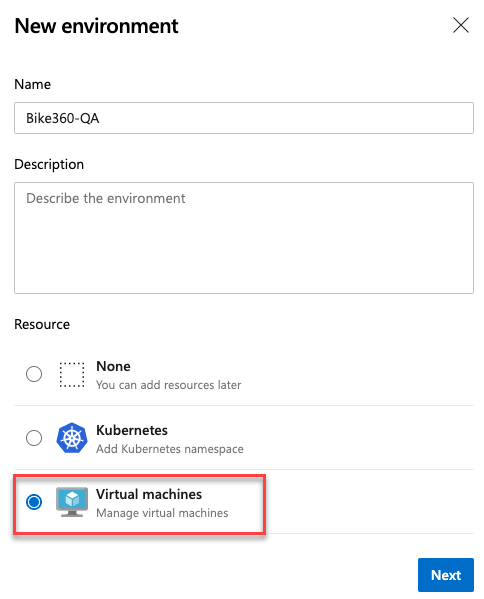
A rolling deployment replaces instances of the previous version of an application with instances of the new version of the application on a set of machines (rolling set) in each iteration.
For example, below rolling deployment updates up to five targets in each iteration. maxParallel will determine the number of targets that can be deployed in parallel. The selection accounts for the number of targets that must remain available at any time, excluding the targets that are being deployed to. It is also used to determine the success and failure conditions during deployment.
jobs:
- deployment:
  displayName: web
  environment:
    name: musicCarnivalProd
    resourceType: VirtualMachine
  strategy:
    rolling:
      maxParallel: 5 #for percentages, mention as x%
      preDeploy:
        steps:
        - script: echo initialize, cleanup, backup, install certs...
      deploy:
        steps:
        - script: echo deploy ...
      routeTraffic:
        steps:
        - script: echo routing traffic...
      postRouteTraffic:
        steps:
        - script: echo health check post routing traffic...
      on:
        failure:
          steps:
          - script: echo restore from backup ..
        success:
          steps:
          - script: echo notify passed...
Note
With this update, all available artifacts from the current pipeline and from the associated pipeline resources are downloaded only in deploy lifecycle-hook. However, you can choose to download by specifying Download Pipeline Artifact task.
There are a few known gaps in this feature. For example, when you retry a stage, it will re-run the deployment on all VMs not just failed targets. We are working to close these gaps in future updates.
Skipping stages in a YAML pipeline
When you start a manual run, you may sometimes want to skip a few stages in your pipeline. For instance, if you do not want to deploy to production, or if you want to skip deploying to a few environments in production. You can now do this with your YAML pipelines.
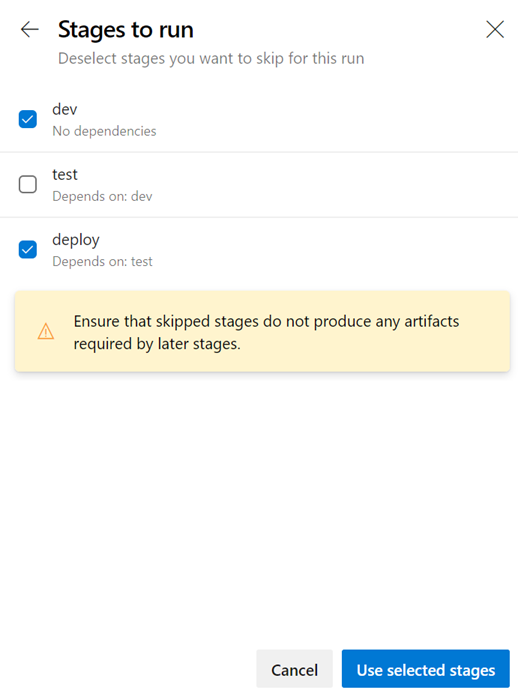
The updated run pipeline panel presents a list of stages from the YAML file, and you have the option to skip one or more of those stages. You must exercise caution when skipping stages. For instance, if your first stage produces certain artifacts that are needed for subsequent stages, then you should not skip the first stage. The run panel presents a generic warning whenever you skip stages that have downstream dependencies. It is left to you as to whether those dependencies are true artifact dependencies or whether they are just present for sequencing of deployments.
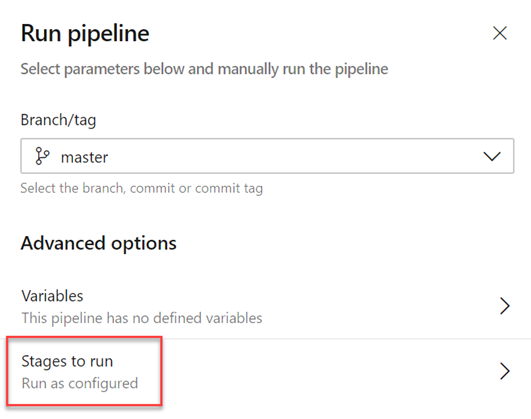
Skipping a stage is equivalent to rewiring the dependencies between stages. Any immediate downstream dependencies of the skipped stage are made to depend on the upstream parent of the skipped stage. If the run fails and if you attempt to rerun a failed stage, that attempt will also have the same skipping behavior. To change which stages are skipped, you have to start a new run.
Reporting
Inline sprint burndown thumbnail
The Sprint Burndown is back! A few sprint ago, we removed the in-context sprint burndown from the Sprint Burndown and Taskboard headers. Based on your feedback, we've improved and reintroduced the sprint burndown thumbnail.

Clicking on the thumbnail will immediately display a larger version of the chart with an option to view the full report under the Analytics tab. Any changes made to the full report will be reflected in the chart displayed in the header. So you can now configure it to burndown based on stories, story points, or by count of tasks, rather than just the amount of work remaining.
Create a dashboard without a team
You can now create a dashboard without associating it with a team. When creating a dashboard, select the Project Dashboard type.
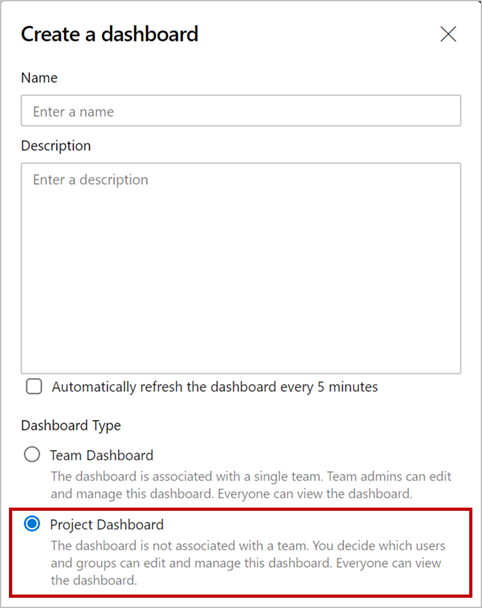
A Project Dashboard is like a Team Dashboard, except it's not associated with a Team and you can decide who can edit/manage the dashboard. Just like a Team Dashboard, it is visible to everyone in the project.
All Azure DevOps widgets that require a team context have been updated to let you select a team in their configuration. You can add these widgets to Project Dashboards and select the specific team you want.

Note
For custom or third-party widgets, a Project Dashboard will pass the default team's context to those widgets. If you have a custom widget that relies on team context, you should update the configuration to let you select a team.
Next steps
Note
These features will roll out over the next two to three weeks.
Head over to Azure DevOps and take a look.
How to provide feedback
We would love to hear what you think about these features. Use the help menu to report a problem or provide a suggestion.
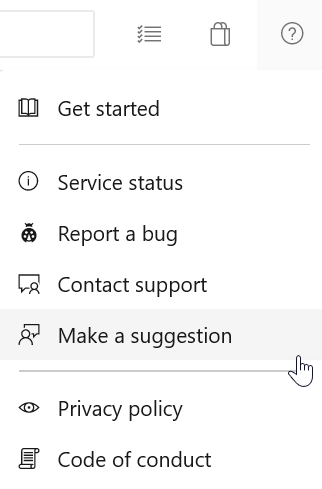
You can also get advice and your questions answered by the community on Stack Overflow.
Thanks,
Jeff Beehler