Create a Power BI report with an OData Query
Azure DevOps Services | Azure DevOps Server 2022 - Azure DevOps Server 2019
With Power BI Desktop, you can easily start creating reports for your project in Azure DevOps.
If you don't have Power BI Desktop, download and install it for free.
Prerequisites
To create a Power BI report, you must meet the following criteria:
- Be a project member. If you aren't, get added now. Anyone with access to the project, except Stakeholders, can view Analytics views.
- Have the View Analytics permission set to Allow. See Grant permissions for Analytics access.
- Enable Boards. To re-enable Boards, see Turn an Azure DevOps service on or off.
- Have Power BI Desktop October 2018 Update or later version.
- Track work items for some period of time on which to generate a trend report.
- Be a project member. If you aren't, get added now. Anyone with access to the project, except Stakeholders, can view Analytics views.
- Enable or install Analytics. You must be an account owner or a member of the Project Collection Administrators group to add extensions or enable the service.
- Enable Boards. To re-enable Boards, see Turn an Azure DevOps service on or off.
- Have the View Analytics permission set to Allow. See Grant permissions for Analytics access.
- Have Power BI Desktop October 2018 Update or later version.
- Track work items for some period of time on which to generate a trend report.
Create a Power BI query
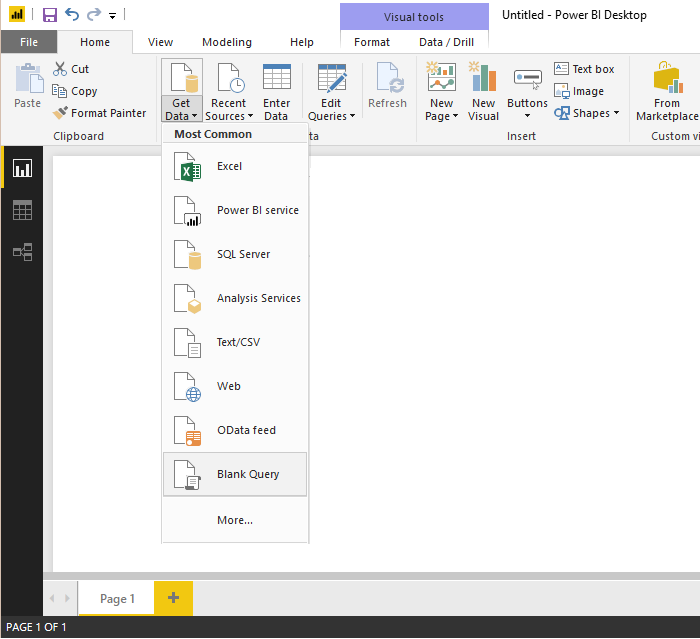
Create a Power BI query to pull the data into Power BI as follows:
Choose Get Data, and then Blank Query.
From the Power BI Query editor, choose Advanced Editor.
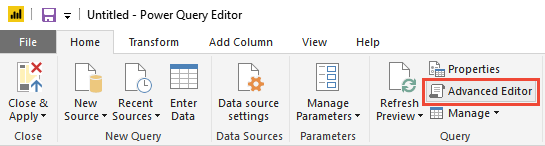
The Advanced Editor window opens.
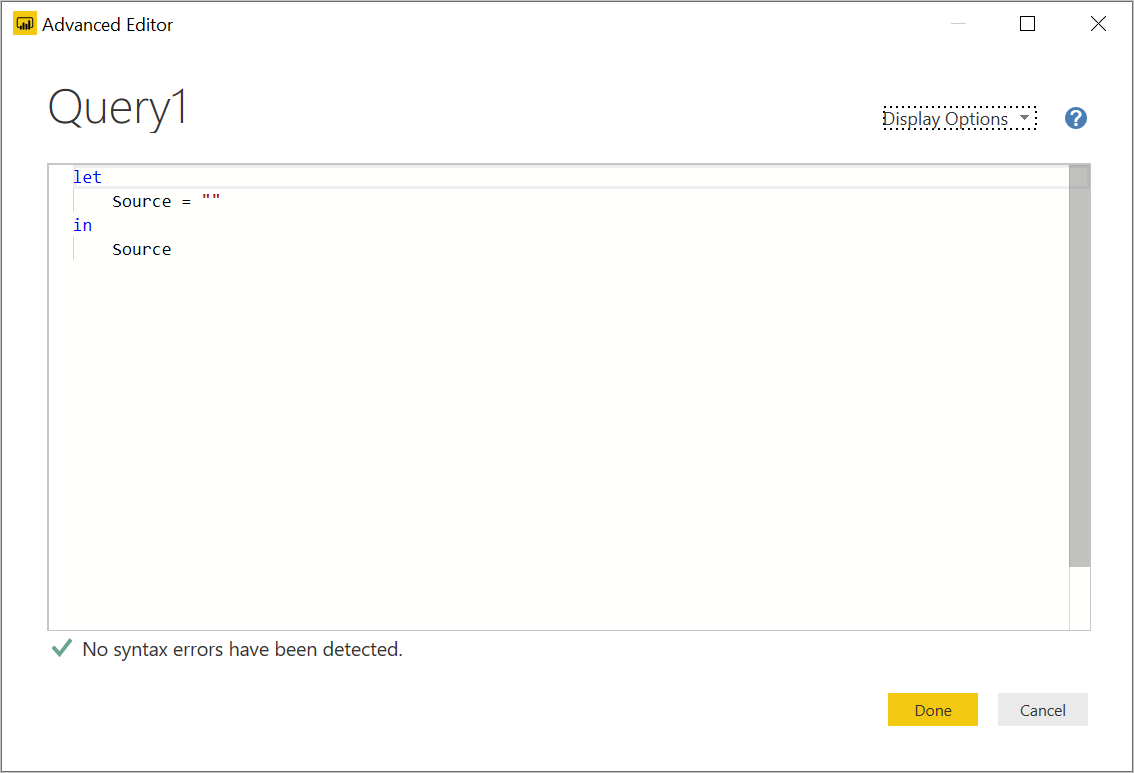
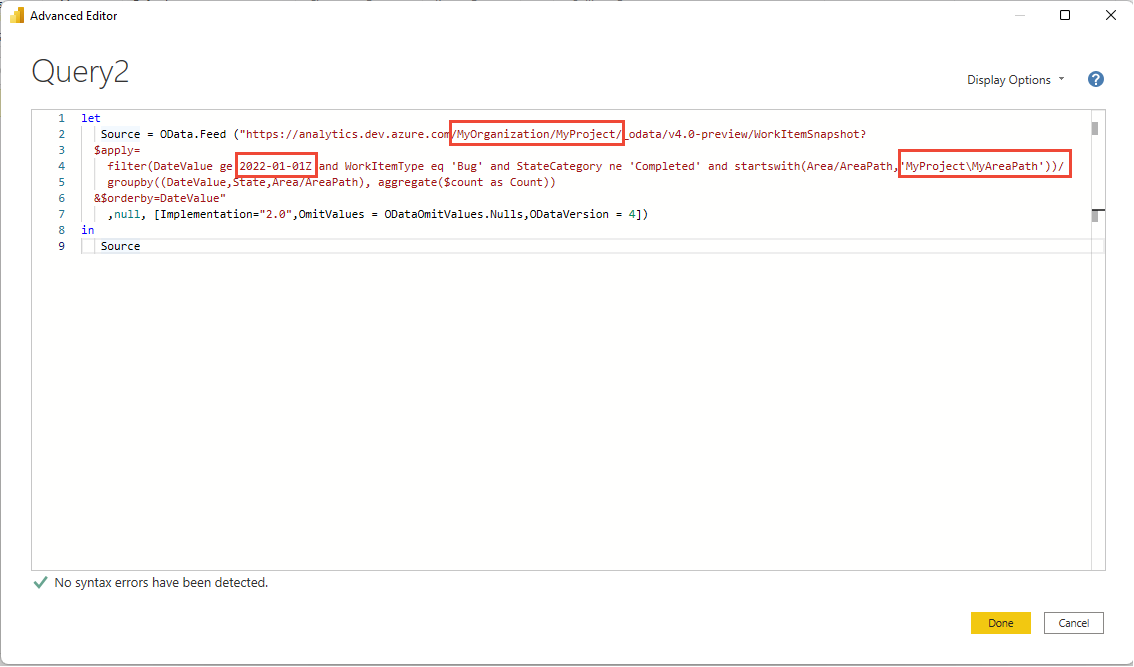
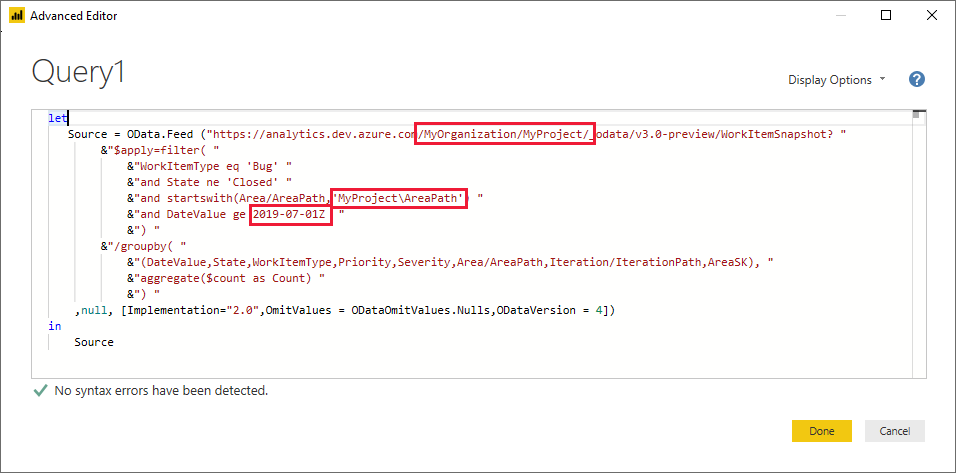
Replace the contents with the following query:
let
   The query you provided has a syntax issue due to the placement of double quotes. Specifically, the `$apply` and `$orderby` parameters should be part of the URL string, but they are not correctly concatenated. Here is the corrected version:
let
   Source = OData.Feed (
      "https://analytics.dev.azure.com/{organization}/{project}/_odata/v4.0-preview/WorkItemSnapshot?"
      &"$apply=filter("
      &"WorkItemType eq 'Bug' "
      &"AND StateCategory ne 'Completed' "
      &"AND startswith(Area/AreaPath,'{areapath}') "
      &"AND DateValue ge {startdate} )/"
      &"groupby((DateValue,State,WorkItemType,Area/AreaPath), aggregate($count as Count))"
      &"&$orderby=DateValue",
      null, [Implementation="2.0", OmitValues = ODataOmitValues.Nulls, ODataVersion = 4]
   )
in
    Source
Substitute your values within the sample query.
The sample query has strings that you must replace with your values:
{organization}- Your organization name{project}- Your team project name. Or omit/{project}entirely, for a cross-project query{areapath}- Your Area Path. Format: Project\Level1\Level2{startdate}- The date to start your trend report on. Format: YYYY-MM-DDZ. Example:2022-09-01Zrepresents 2022-September-01. Don't enclose in quotes.
Choose Done to execute the query.
Power BI might require you to authenticate. For more information, see Client authentication options.
Expand Area, Iteration, AssignedTo columns
The query returns several columns that you need to expand before you can use them in Power BI. Any entity pulled in using an $expand statement returns a record with potentially several fields. You need to expand the record to flatten the entity into its fields. Examples of such entities are: AssignedTo, Iteration, and Area.
After closing the Advanced Editor and while remaining in the Power Query Editor, select the expand button on the entities you need to flatten.
For example, choose the expand button for Area, select the properties you want to expand, and choose OK. Here, we choose
AreaNameandAreaPathto flatten. TheAreaNameproperty is similar to the Node Name field.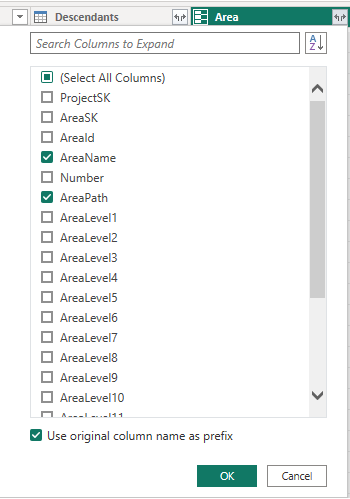
Note
The available properties to select depends on the properties requested to return in the query. If you don't specify any properties, then all properties are available. For more information about these properties, see the following metadata references: Areas, Iterations, and Users.
The table now contains entity fields.

Repeat steps 1 through 3 for all fields representing entities that need to expand. These fields appear with Record listed in the table column when unexpanded.
Rename fields and query, then Close & Apply
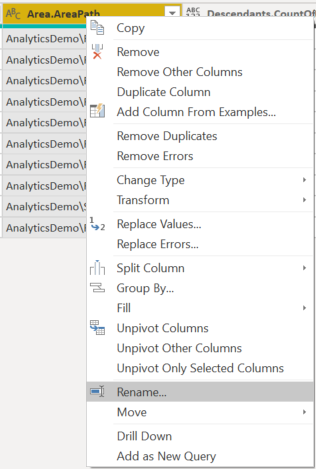
When finished, you might choose to rename columns.
Right-click a column header and select Rename...
You also might want to rename the query from the default Query1, to something more meaningful.
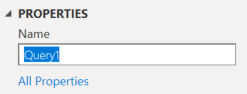
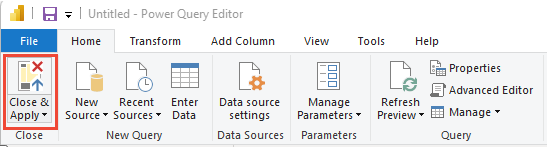
Once done, choose Close & Apply to save the query and return to Power BI.
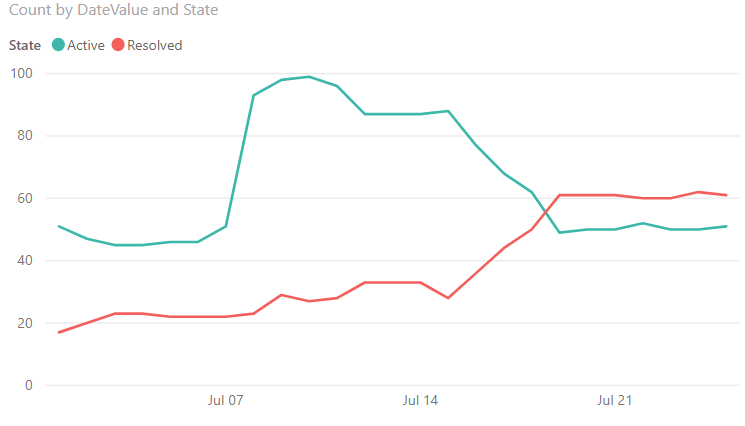
Create the report
Power BI shows you the fields you can report on.
Note
The following example assumes that no one renamed any columns.
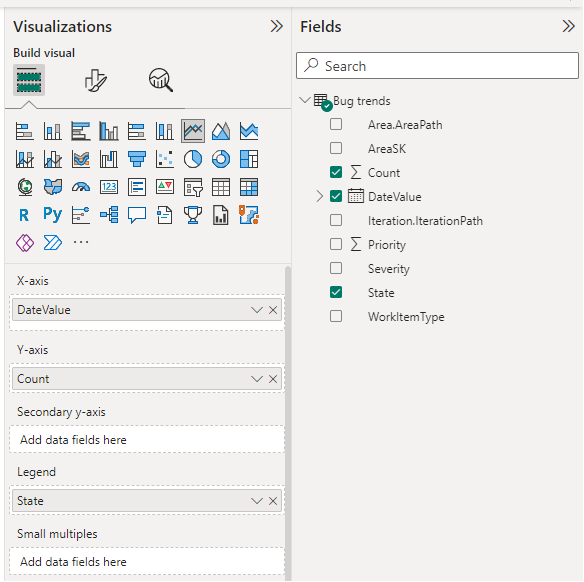
For a simple report, do the following steps:
- Select Power BI Visualization Line chart.
- Add the field "DateValue" to Axis
- Right-click "DateValue" and select "DateValue," rather than Date Hierarchy
- Add the field "State" to Legend
- Add the field "Count" to Values
- Right-click WorkItemId field and ensure Sum is selected
Example report: