Manage the Azure Native Dynatrace Service
This article describes how to manage the settings for Dynatrace for Azure.
Resource overview
To see the details of your Dynatrace resource, select Overview in the left pane.
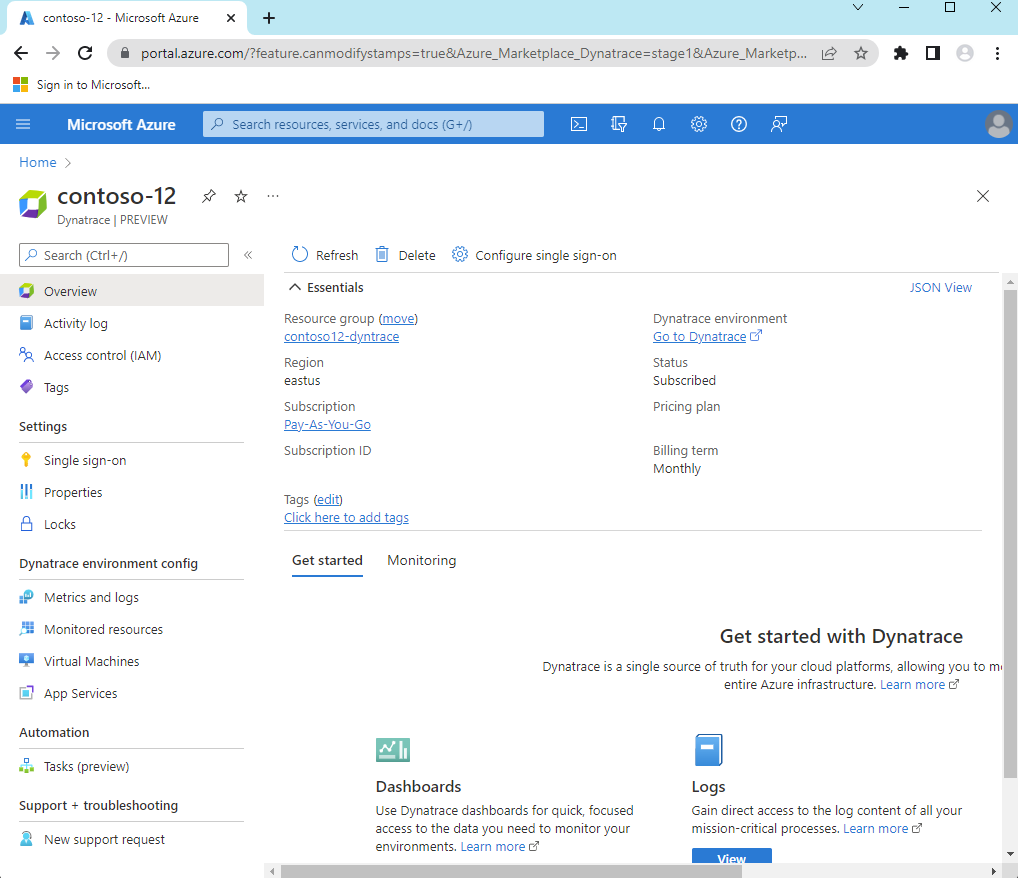
The details include:
- Resource group name
- Region
- Subscription
- Tags
- Single sign-on link to Dynatrace environment
- Dynatrace billing plan
- Billing term
At the bottom, you see two tabs:
- Get started tab also provides links to Dynatrace dashboards, logs and Smartscape Topology.
- Monitoring tab provides a summary of the resources sending logs to Dynatrace.
If you select the Monitoring pane, you see a table with information about the Azure resources sending logs to Dynatrace.
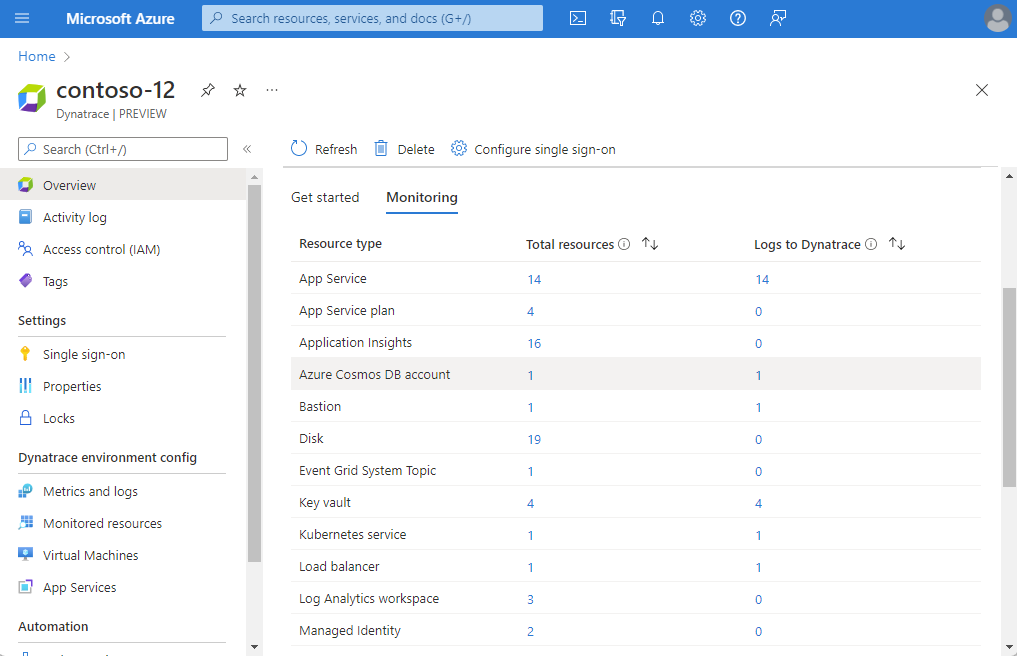
The columns in the table denote important information for your resource:
- Resource type - Azure resource type.
- Total resources - Count of all resources for the resource type.
- Logs to Dynatrace - Count of resources sending logs to Dynatrace through the integration.
Reconfigure rules for metrics and logs
To change the configuration rules for logs, select Metrics and logs in the Resource menu on the left.
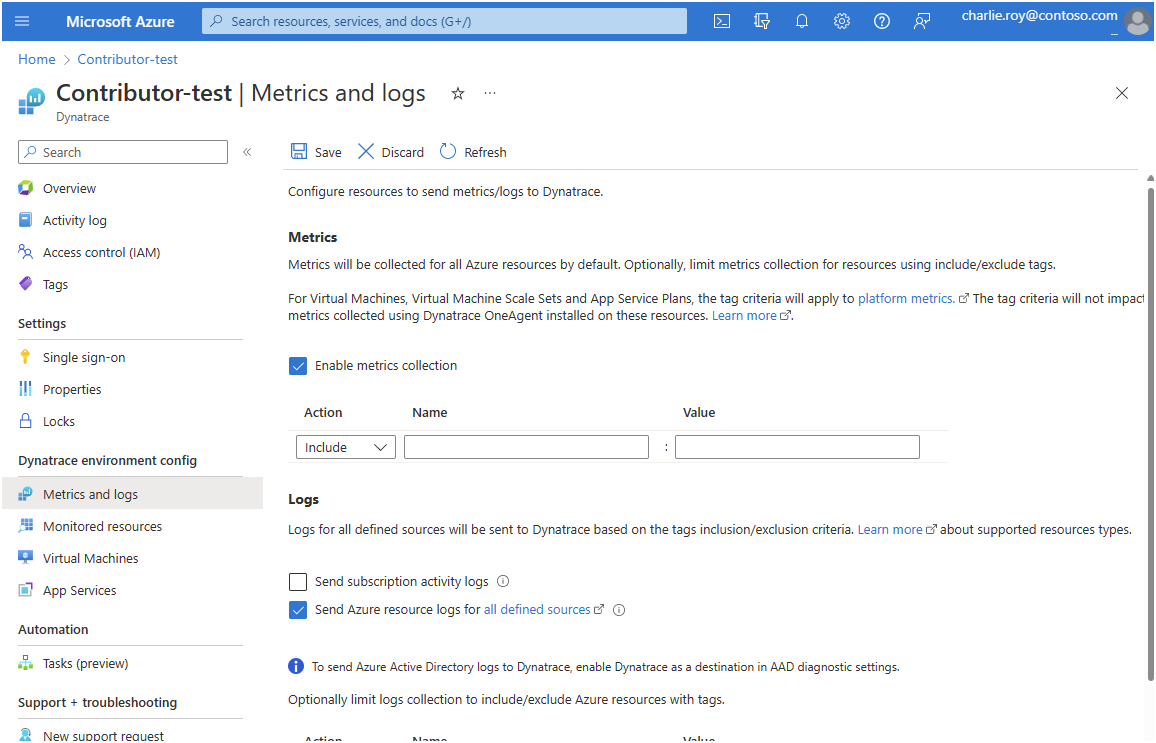
For more information, see Configure metrics and logs.
View monitored resources
To see the list of resources emitting logs to Dynatrace, select Monitored Resources in the left pane.
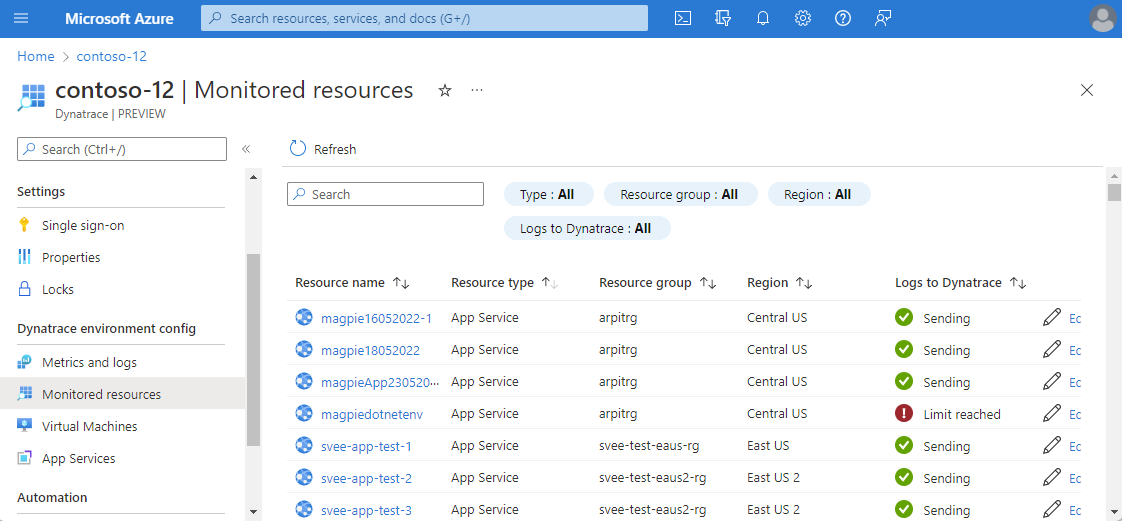
You can filter the list of resources by resource type, resource group name, region and whether the resource is sending logs.
The column Logs to Dynatrace indicates whether the resource is sending logs to Dynatrace. If the resource isn't sending logs, this field indicates why logs aren't being sent. The reasons could be:
- Resource doesn't support sending logs - Only resource types with monitoring log categories can be configured to send logs. See supported categories.
- Limit of five diagnostic settings reached - Each Azure resource can have a maximum of five diagnostic settings. For more information, see diagnostic settings.
- Error - The resource is configured to send logs to Dynatrace, but is blocked by an error.
- Logs not configured - Only Azure resources that have the appropriate resource tags are configured to send logs to Dynatrace.
- Agent not configured - Virtual machines without the Dynatrace OneAgent installed don't emit logs to Dynatrace.
Use one Dynatrace resource with multiple subscriptions
You can now monitor all your subscriptions through a single Dynatrace resource using Monitored Subscriptions. Your experience is simplified because you don't have to set up a Dynatrace resource in every subscription that you intend to monitor. You can monitor multiple subscriptions by linking them to a single Dynatrace resource that is tied to a Dynatrace environment. This provides a single pane view for all resources across multiple subscriptions.
To manage multiple subscriptions that you want to monitor, select Monitored Subscriptions in the Dynatrace environment configurations section of the Resource menu.
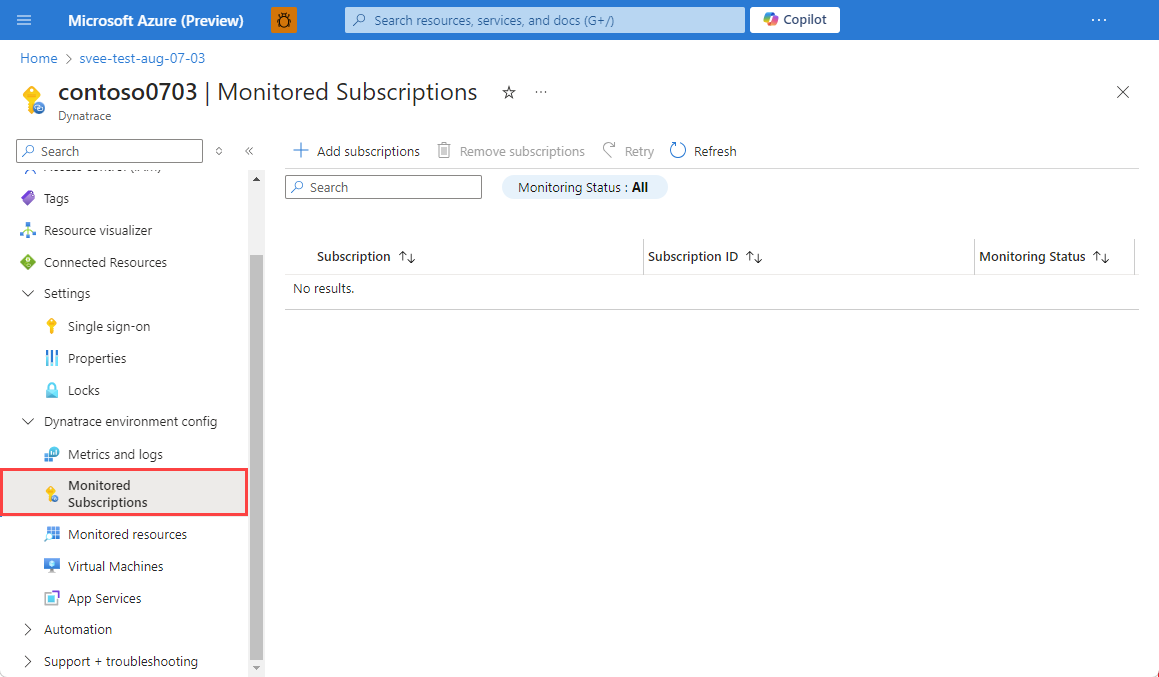
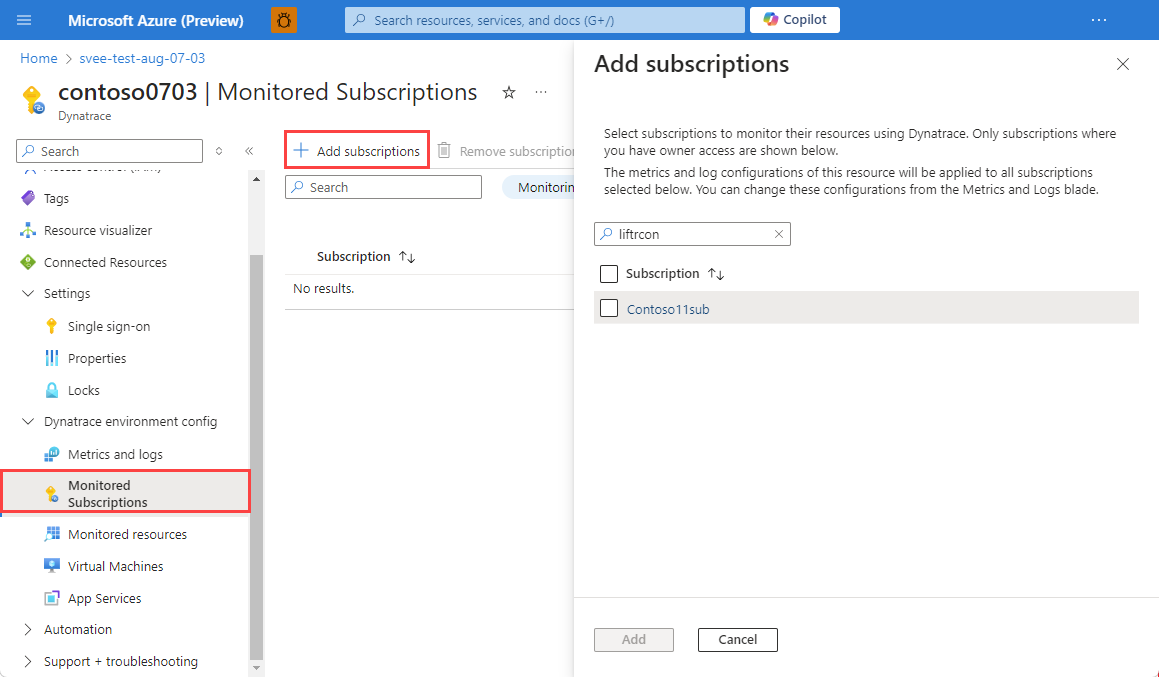
From Monitored Subscriptions in the Resource menu, select Add Subscriptions. The Add Subscriptions experience that opens and shows the subscriptions you have Owner role assigned to and any Dynatrace resource created in those subscriptions that is already linked to the same Dynatrace environment as the current resource.
If the subscription you want to monitor has a resource already linked to the same Dynatrace org, we recommend that you delete the Dynatrace resources to avoid shipping duplicate data and incurring double the charges.
Select the subscriptions you want to monitor through the Dynatrace resource and select Add.
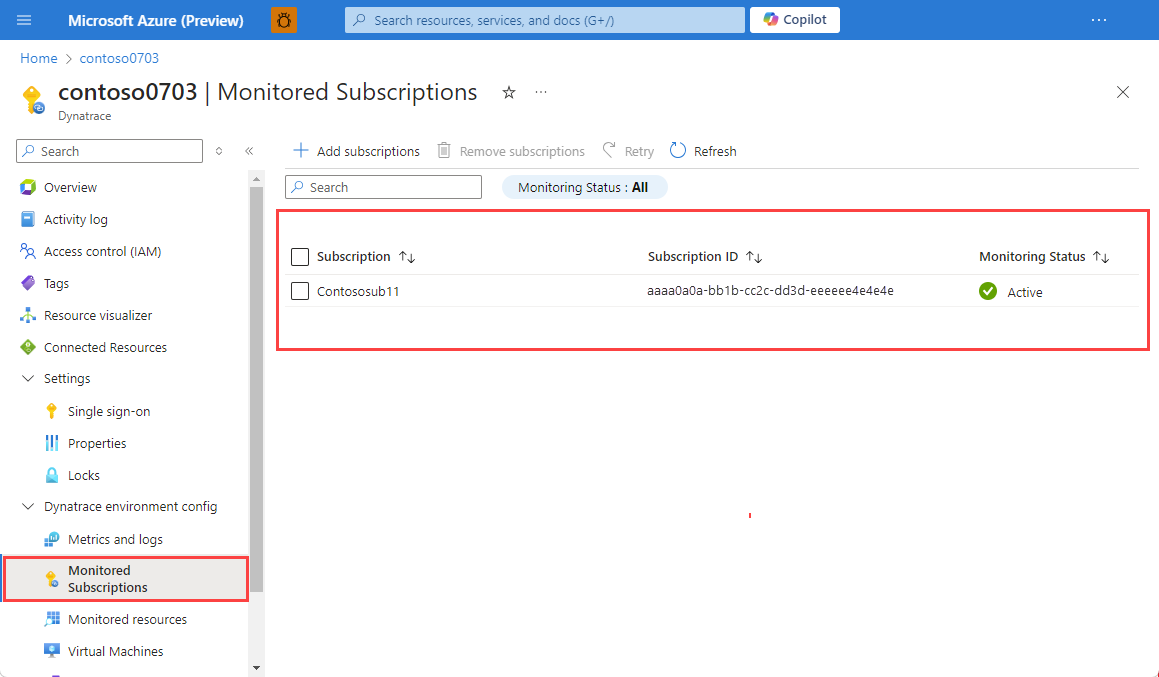
If the list doesn't get updated automatically, select Refresh to view the subscriptions and their monitoring status. You might see an intermediate status of In Progress while a subscription gets added. When the subscription is successfully added, you see the status is updated to Active. If a subscription fails to get added, Monitoring Status shows as Failed.
The set of tag rules for metrics and logs defined for the Dynatrace resource applies to all subscriptions that are added for monitoring. Setting separate tag rules for different subscriptions isn't supported. Diagnostics settings are automatically added to resources in the added subscriptions that match the tag rules defined for the Dynatrace resource.
If you have existing Dynatrace resources that are linked to the account for monitoring, you can end up with duplication of logs that can result in added charges. Ensure you delete redundant Dynatrace resources that are already linked to the account. You can view the list of connected resources and delete the redundant ones. We recommend consolidating subscriptions into the same Dynatrace resource where possible.
Monitor virtual machines using Dynatrace OneAgent
You can install Dynatrace OneAgent on virtual machines as an extension. Select Virtual Machines under Dynatrace environment config in the Resource menu. In the working pane, you see a list of all virtual machines in the subscription.
For each virtual machine, the following info is displayed:
| Column | Description |
|---|---|
| Name | Virtual machine name. |
| Status | Indicates whether the virtual machine is stopped or running. Dynatrace OneAgent can only be installed on virtual machines that are running. If the virtual machine is stopped, installing the Dynatrace OneAgent will be disabled. |
| OneAgent status | Whether the Dynatrace OneAgent is running on the virtual machine. |
| OneAgent version | The Dynatrace OneAgent version number. |
| Auto-update | Whether auto-update has been enabled for the OneAgent. |
| Log monitoring | Whether log monitoring option was selected when OneAgent was installed. |
| Monitoring mode | Whether the Dynatrace OneAgent is monitoring hosts in full-stack monitoring mode or infrastructure monitoring mode. |
Note
If a virtual machine shows that an OneAgent is installed, but the option Uninstall extension is disabled, then the agent was configured through a different Dynatrace resource in the same Azure subscription. To make any changes, please go to the other Dynatrace resource in the Azure subscription.
Monitor App Services using Dynatrace OneAgent
You can install Dynatrace OneAgent on an App Service as an extension. Select an App Service in the Resource menu. In the working pane, you see a list of any App Service in the subscription.
For each App Service, the following information is displayed:
| Column | Description |
|---|---|
| Name | App Service name. |
| Status | Indicates whether the App Service is running or stopped. Dynatrace OneAgent can only be installed on an App Service that is running. |
| App Service plan | The plan configured for the App Service. |
| OneAgent version | The Dynatrace OneAgent version. |
| OneAgent status | status of the agent. |
To install the Dynatrace OneAgent, select the App Service and select Install Extension. The application settings for the selected App Service are updated and the App Service is restarted to complete the configuration of the Dynatrace OneAgent.
Note
App Service extensions are currently supported only for App Services that are running on Windows OS. App Services using the Linux OS are not shown in the list.
Note
This screen currently only shows App Services of type Web App. Managing agents for Function apps is not supported at this time.
Reconfigure single sign-on
If you would like to reconfigure single sign-on, select Single sign-on in the left pane.
If single sign-on was already configured, you can disable it.
To establish single sign-on or change the application, select Enable single sign-on through Microsoft Entra ID. The portal retrieves Dynatrace application from Microsoft Entra ID. The app comes from the enterprise app name selected during the pre-configuration steps.
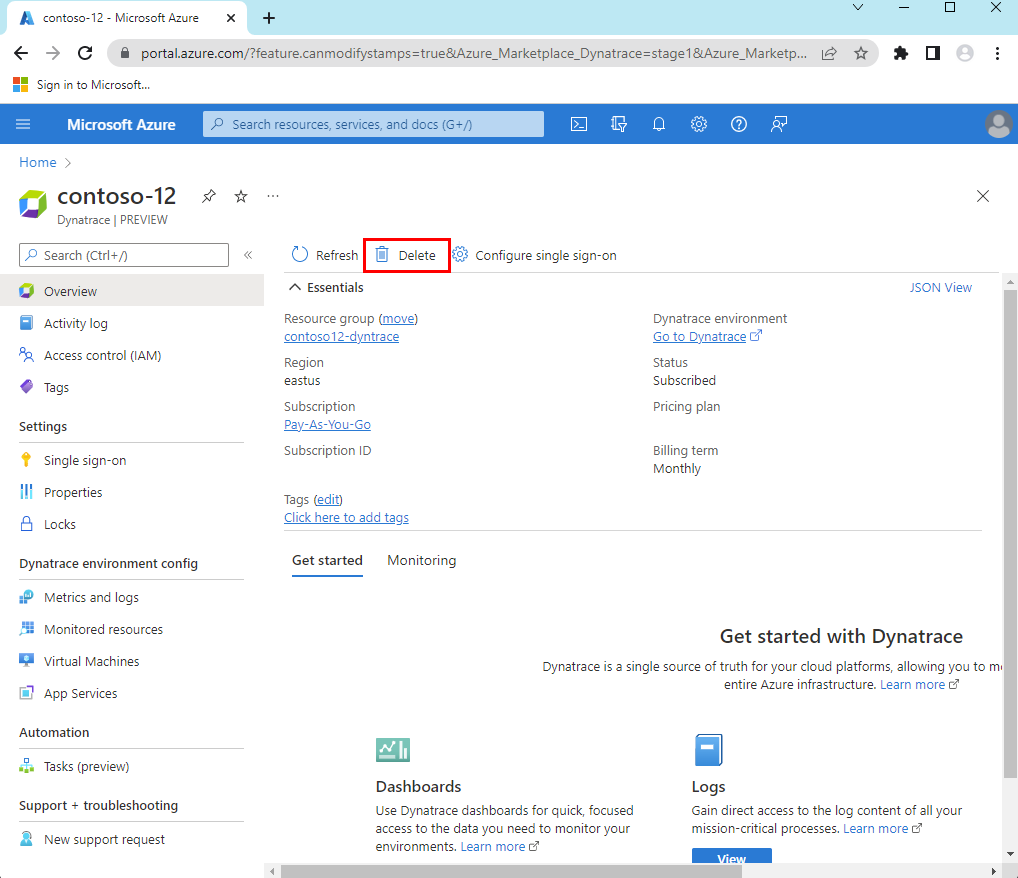
Delete Dynatrace resource
Select Overview in Resource menu. Then, select Delete. Confirm that you want to delete the Dynatrace resource. Select Delete.
If only one Dynatrace resource is mapped to a Dynatrace environment, logs are no longer sent to Dynatrace. All billing through Azure Marketplace stops for Dynatrace.
If more than one Dynatrace resource is mapped to the Dynatrace environment using the link Azure subscription option, deleting the Dynatrace resource only stops sending logs for Azure resources associated to that Dynatrace resource. However, since this one Dynatrace environment might still be linked to other Dynatrace resources, billing continues through the Azure Marketplace.
Next steps
For help with troubleshooting, see Troubleshooting Dynatrace integration with Azure.
Get started with Azure Native Dynatrace Service on