Troubleshoot the Global Secure Access client: Advanced diagnostics
This document provides troubleshooting guidance for the Global Secure Access client. It explores each tab of the Advanced diagnostics utility.
Introduction
The Global Secure Access client runs in the background and routes relevant network traffic to Global Secure Access. It doesn't require user interaction. The advanced diagnostics tool makes the client's behavior visible to the administrator and helps with troubleshooting.
Launch the advanced diagnostics tool
To launch the advanced diagnostics tool:
- Right-click the Global Secure Access client icon in the system tray.
- Select Advanced Diagnostics. If enabled, User Account Control (UAC) prompts for elevation of privileges.
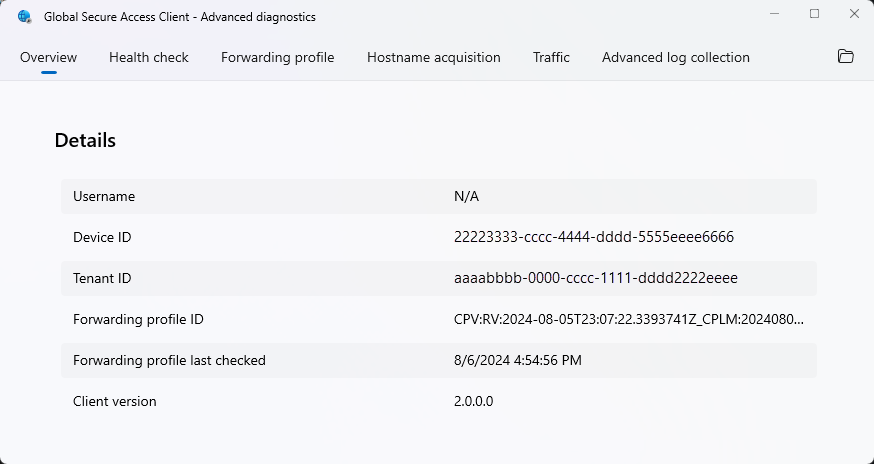
Overview tab
The advanced diagnostics Overview tab shows general configuration details about the Global Secure Access client:
- Username: The Microsoft Entra user principal name of the user who authenticated to the client.
- Device ID: The ID of the device in Microsoft Entra. The device must be joined to the tenant.
- Tenant ID: The ID of the tenant that the client points to, which is the same tenant the device is joined to.
- Forwarding Profile ID: The ID of the forwarding profile currently in use by the client.
- Forwarding Profile last checked: The time when the client last checked for an updated forwarding profile.
- Client version: The version of the Global Secure Access client that is currently installed on the device.
Health check tab
The Health check tab executes common tests to verify that the client works correctly and that its components are running. For deeper coverage of the Health check tab, see Troubleshoot the Global Secure Access client: Health check tab.
Forwarding profile tab
The Forwarding profile tab shows the list of current, active rules that are set for the forwarding profile. The tab contains the following information:
- Forwarding profile ID: The ID of the forwarding profile currently in use by the client.
- Forwarding profile last checked: The time when the client last checked for an updated forwarding profile.
- Refresh details: Select to reload the forwarding data from the client's cache (in case it was updated from the last refresh).
- Policy tester: Select to show the active rule for a connection to a specific destination.
- Add filter: Select to set filters to see only a subset of the rules according to a specific set of filter properties.
- Columns: Select to choose the columns to display in the table.
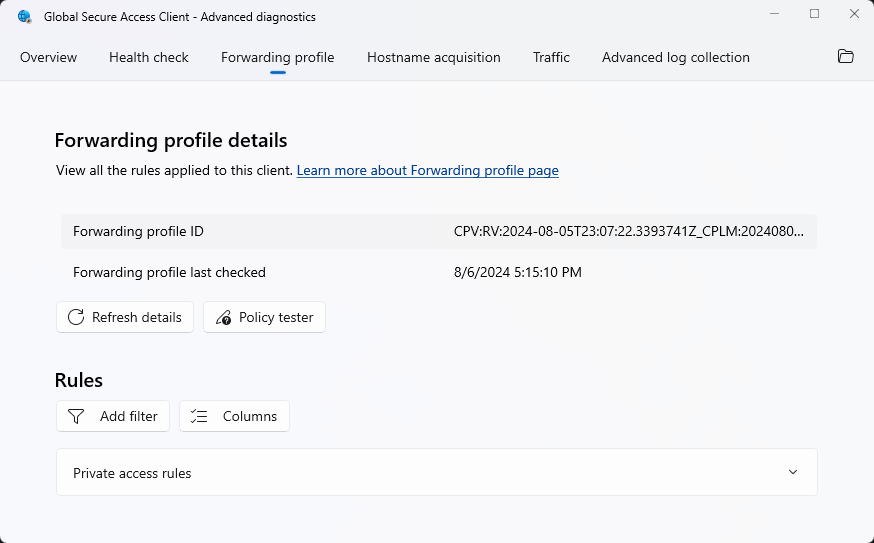
The rules section shows the list of rules grouped by each workload (M365 rules, Private access rules, Internet access rules). This list only includes rules for the workloads activated in your tenant.
Tip
If a rule contains several destinations (fully qualified domain name (FQDN) or IP range), the rule will span several rows, with one row for each destination.
For each rule, the available columns include:
- Priority: The priority of the rule. Rules with higher priority (smaller numerical value) take precedence over rules with lower priority.
- Destination (IP/FQDN): The destination of the traffic by FQDN or by IP.
- Protocol: The network protocol for the traffic: TCP or UDP.
- Port: The destination port of the traffic.
- Action: The action that the client takes when outgoing traffic from the device matches the destination, protocol, and port. The supported actions are tunnel (route to Global Secure Access) or bypass (go directly to the destination).
- Hardening: The action when traffic should be tunneled (routed to Global Secure Access) but the connection to the cloud service fails. The supported hardening actions are block (drop the connection) or bypass (let the connection go directly to the network).
- Rule ID: The unique identifier of the rule in the forwarding profile.
- Application ID: The ID of the private application associated with the rule. This column is relevant only for private applications.
Hostname acquisition tab
The Hostname acquisition tab allows for the collection of a live list of client-acquired hostnames, based on the FQDN rules in the forwarding profile. Each hostname is shown in a new row.
- Start collecting: Select to begin the live collection of acquired hostnames.
- Export CSV: Select to export the list of acquired hostnames to a CSV file.
- Clear table: Select to clear the acquired hostnames displayed in the table.
- Add filter: Select to set filters to see only a subset of the acquired hostnames according to a specific set of filter properties.
- Columns: Select to choose the columns to display in the table.
For each hostname, the available columns include:
- Timestamp: The date and time of each FQDN hostname acquisition.
- FQDN: The FQDN of acquired hostname.
- Generated IP address: The IP address generated by the client for internal purposes. This IP is shown in the traffic tab for connections that are established to the corresponding FQDN.
- Acquired: Shows Yes or No to indicate if an FQDN matches a rule in the forwarding profile.
- Original IP address: The first IPv4 address in the DNS response for the FQDN query. If the end-user device DNS server doesn’t return an IPv4 address for the query, the original IP address column shows a blank value.
Traffic tab
The traffic tab allows for the collection of a live list of connections opened by the device, based on the rules in the forwarding profile. Each connection is shown in a new row.
- Start collecting: Select to begin the live collection of connections.
- Export CSV: Select to export the list of connections to a CSV file.
- Clear table: Select to clear the connections displayed in the table.
- Add filter: Select to set filters to see only a subset of the connections according to a specific set of filter properties.
- Columns: Select to choose the columns to display in the table.
For each connection, the available columns include:
- Timestamp begin: The time when the operating system opened the connection.
- Timestamp end: The time when the operating system closed the connection.
- Connection status: Indicates whether the connection is still active or is already closed.
- Protocol: The network protocol for the connection; either TCP or UDP.
- Destination FQDN: The destination FQDN for the connection.
- Source port: The source port for the connection.
- Destination IP: The destination IP for the connection.
- Destination port: The destination port for the connection.
- Correlation vector ID: a unique ID attributed to each connection that can be correlated with Global Secure Access traffic logs in the portal. Microsoft Support can also use this ID to investigate internal logs related to a specific connection.
- Process name: The name of the process that opened the connection.
- Process ID: The ID number for the process that opened the connection.
- Bytes sent: The number of bytes sent from the device to the destination.
- Bytes received: The number of bytes received by the device from the destination.
- Channel: The channel to which the connection was tunneled; can be Microsoft 365, Private Access, or Internet Access.
- Flow ID: The internal ID number for the connection.
- Rule ID: The identifer for the forwarding profile rule used to determine the actions for this connection.
- Action: The action that was taken for this connection; possible actions are:
- Tunnel: The client tunneled the connection to the Global Secure Access service in the cloud.
- Bypass: The connection goes directly to the destination through the device's network with no intervention by the client.
- Block: The client blocked the connection (only possible in Hardening mode).
- Hardening: Indicates whether hardening was applied to this connection; can be Yes or No. Hardening applies when the Global Secure Access service isn't reachable from the device.
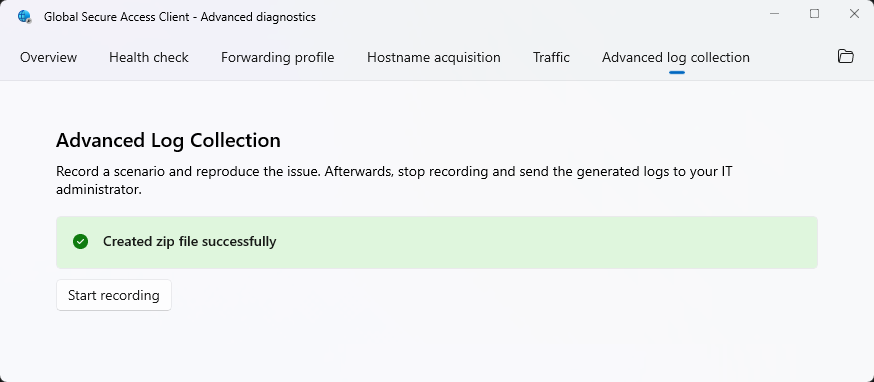
Advanced log collection tab
The advanced log collection tab allows for the collection of verbose logs of the client, the operating systems, and the network traffic during a specific period. The logs are archived to a ZIP file that can be sent to the administrator or Microsoft Support for investigation.
- Start recording: Select to begin recording the verbose logs. You need to reproduce the issue while recording.
- Stop recording: After reproducing the issue, select this button to stop the recording and save the collected logs to a ZIP file. Share the ZIP file with support for troubleshooting assistance.