Browse the Apache Spark applications in the Fabric monitoring hub
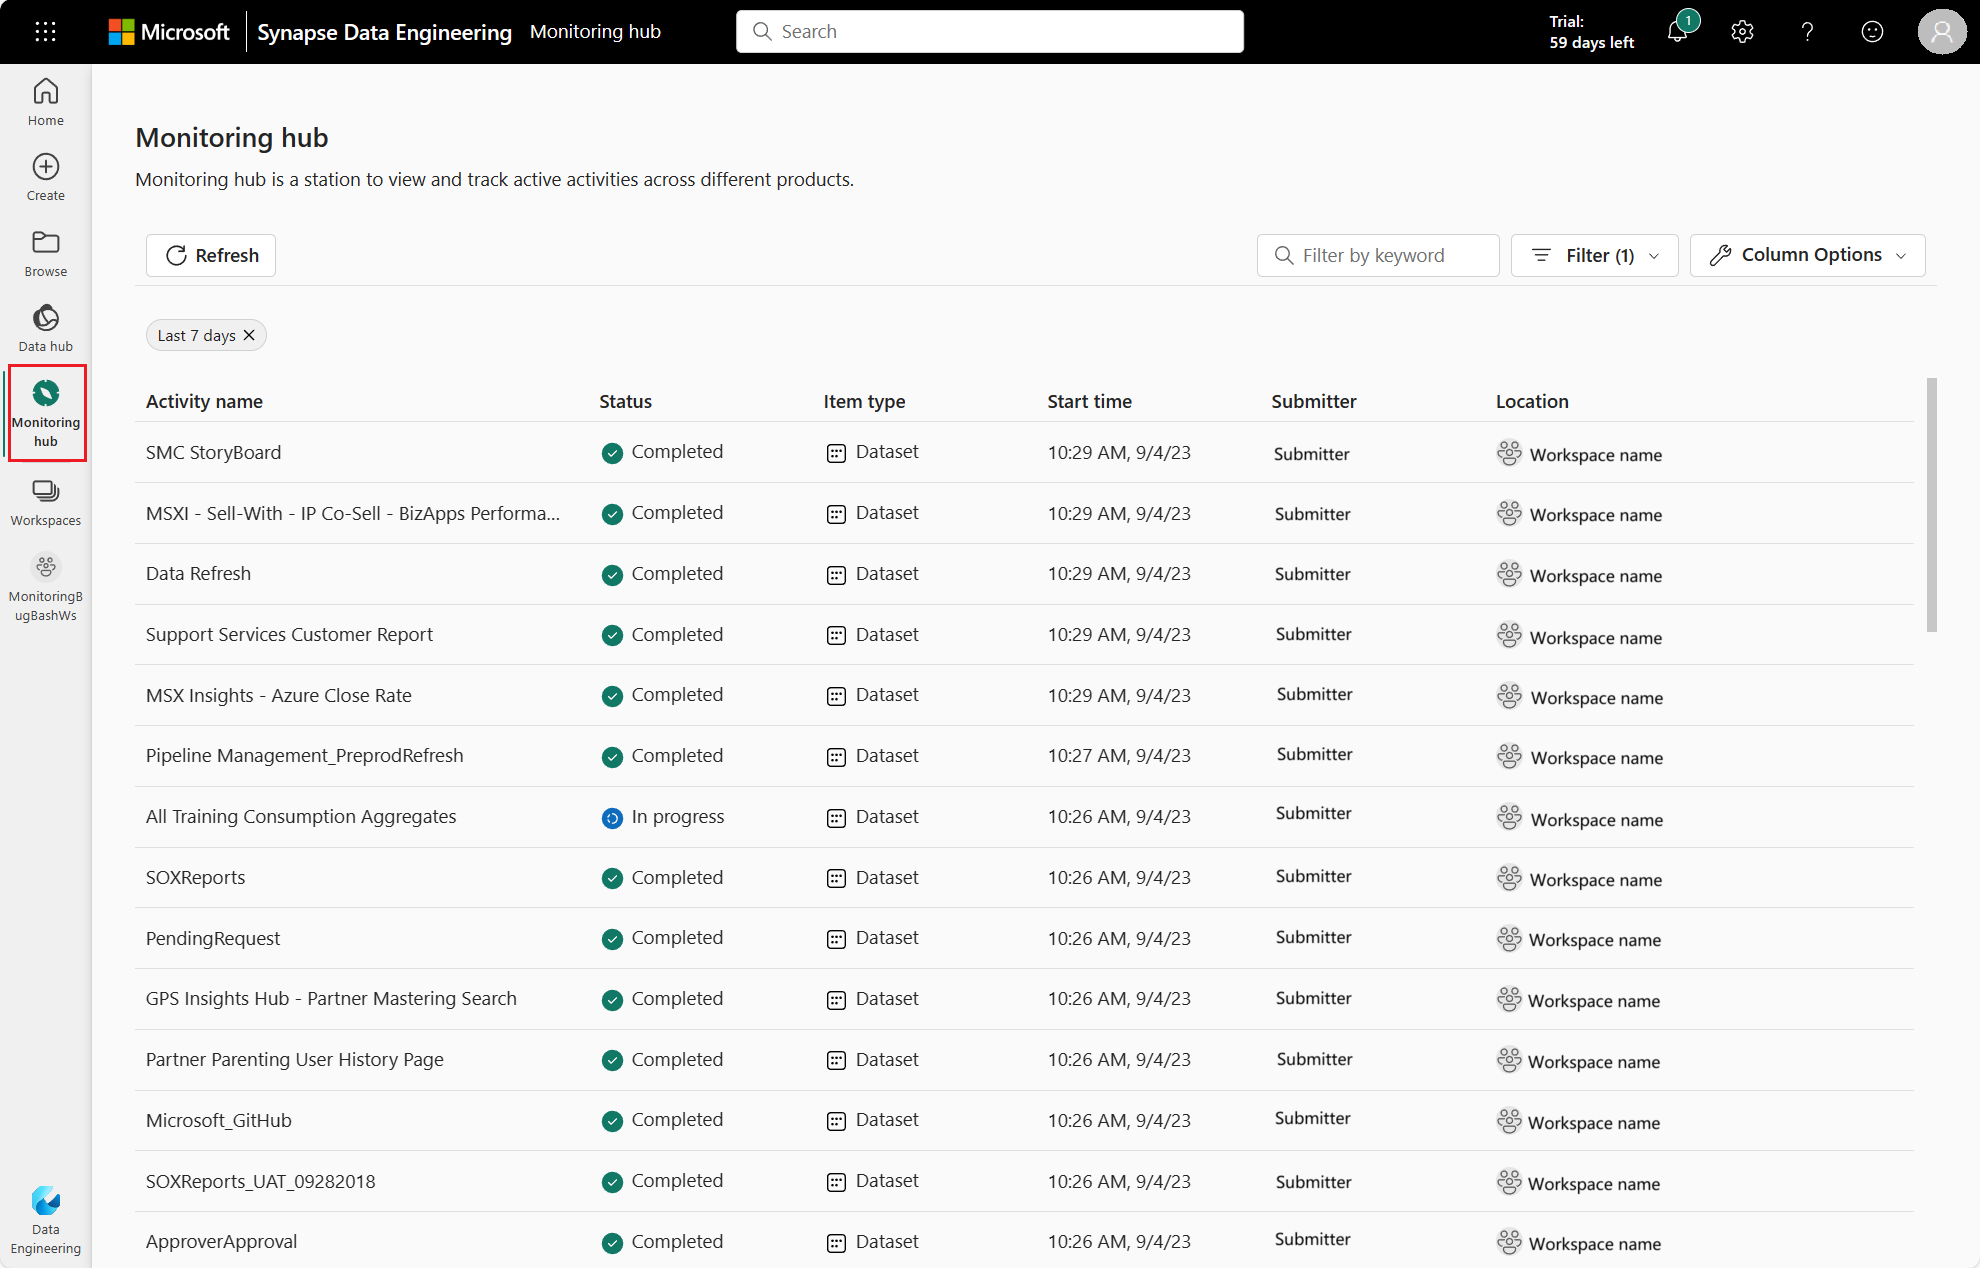
The Monitoring hub serves as a centralized portal for browsing Apache Spark activities across items. When you are in Data Engineering or Data Science, you can view in-progress Apache Spark applications triggered from notebooks, Apache Spark job definitions, and pipelines. You can also search and filter Apache Spark applications based on different criteria. Additionally, you can cancel your in-progress Apache Spark applications and drill down to view more execution details of an Apache Spark application.
Access the monitoring hub
You can access the Monitoring hub to view various Apache Spark activities by selecting Monitoring hub in the left-side navigation links.
Sort, search, filter and column options Apache Spark applications
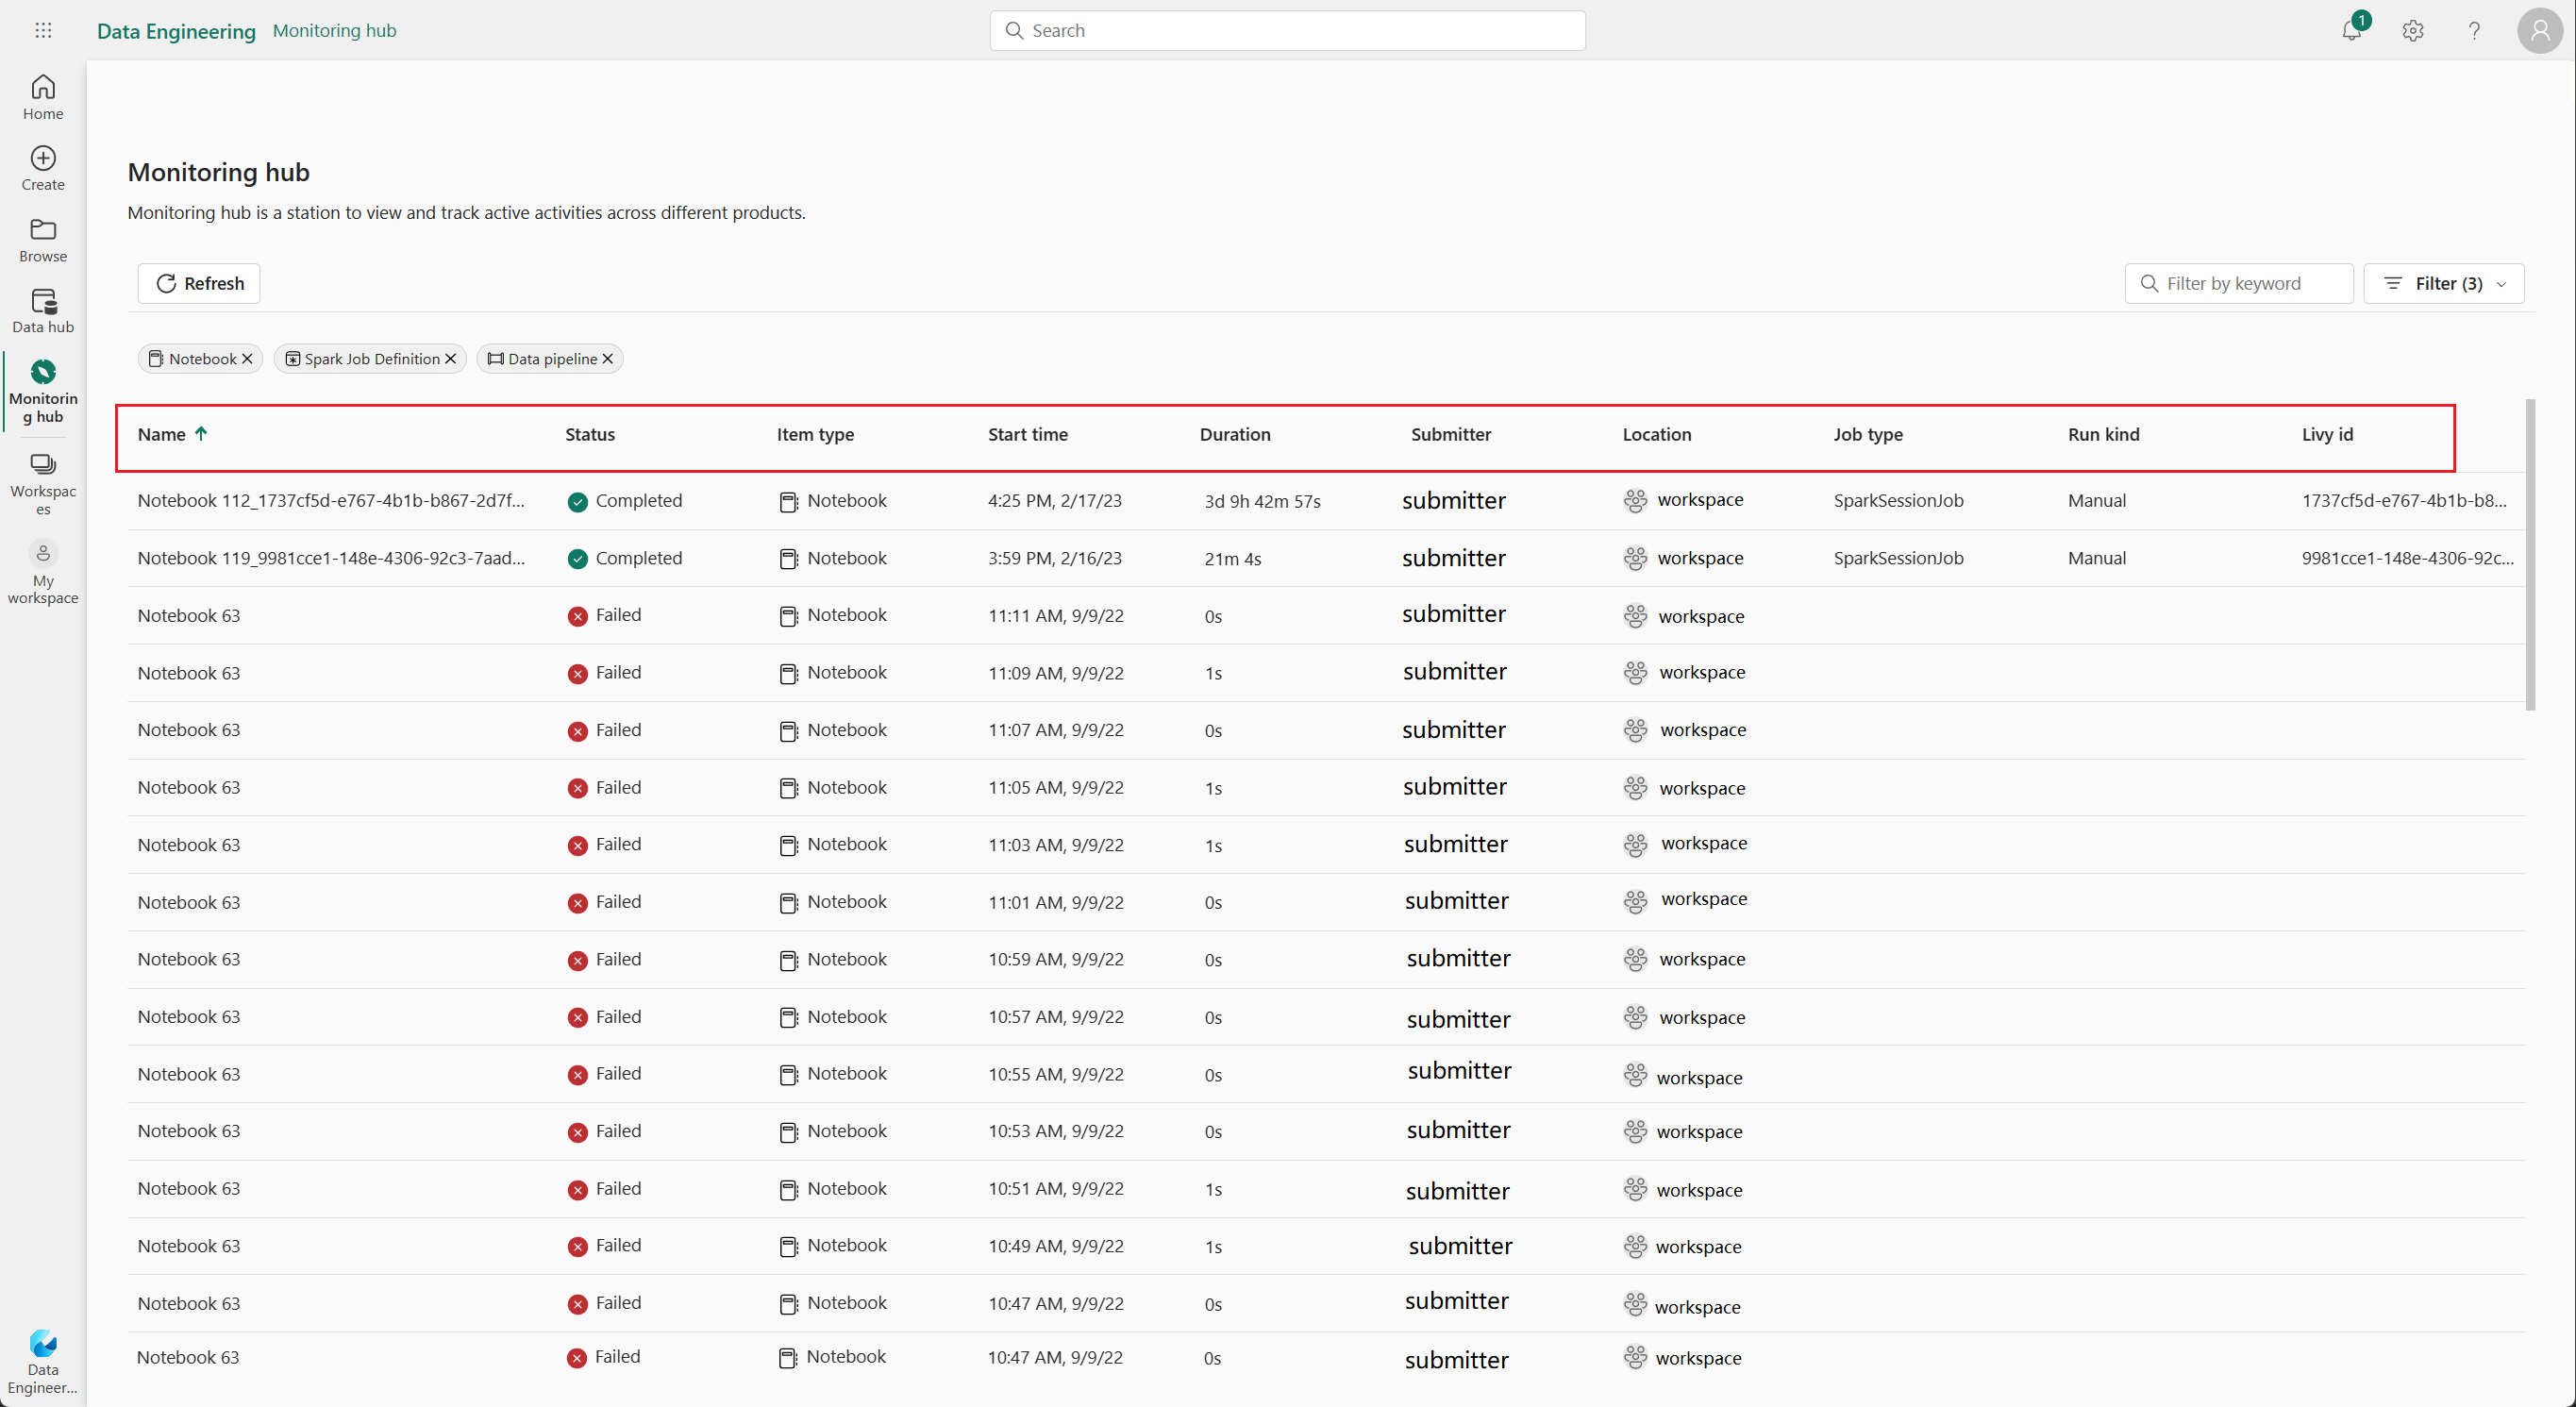
For better usability and discoverability, you can sort the Apache Spark applications by selecting different columns in the UI. You can also filter the applications based on different columns and search for specific applications. You can also adjust the display and sort order of the columns independently through the column options.
Sort Apache Spark applications
To sort Apache Spark applications, you can select on each column header, such as Name, Status, Item Type, Start Time, Location, and so on.
Filter Apache Spark applications
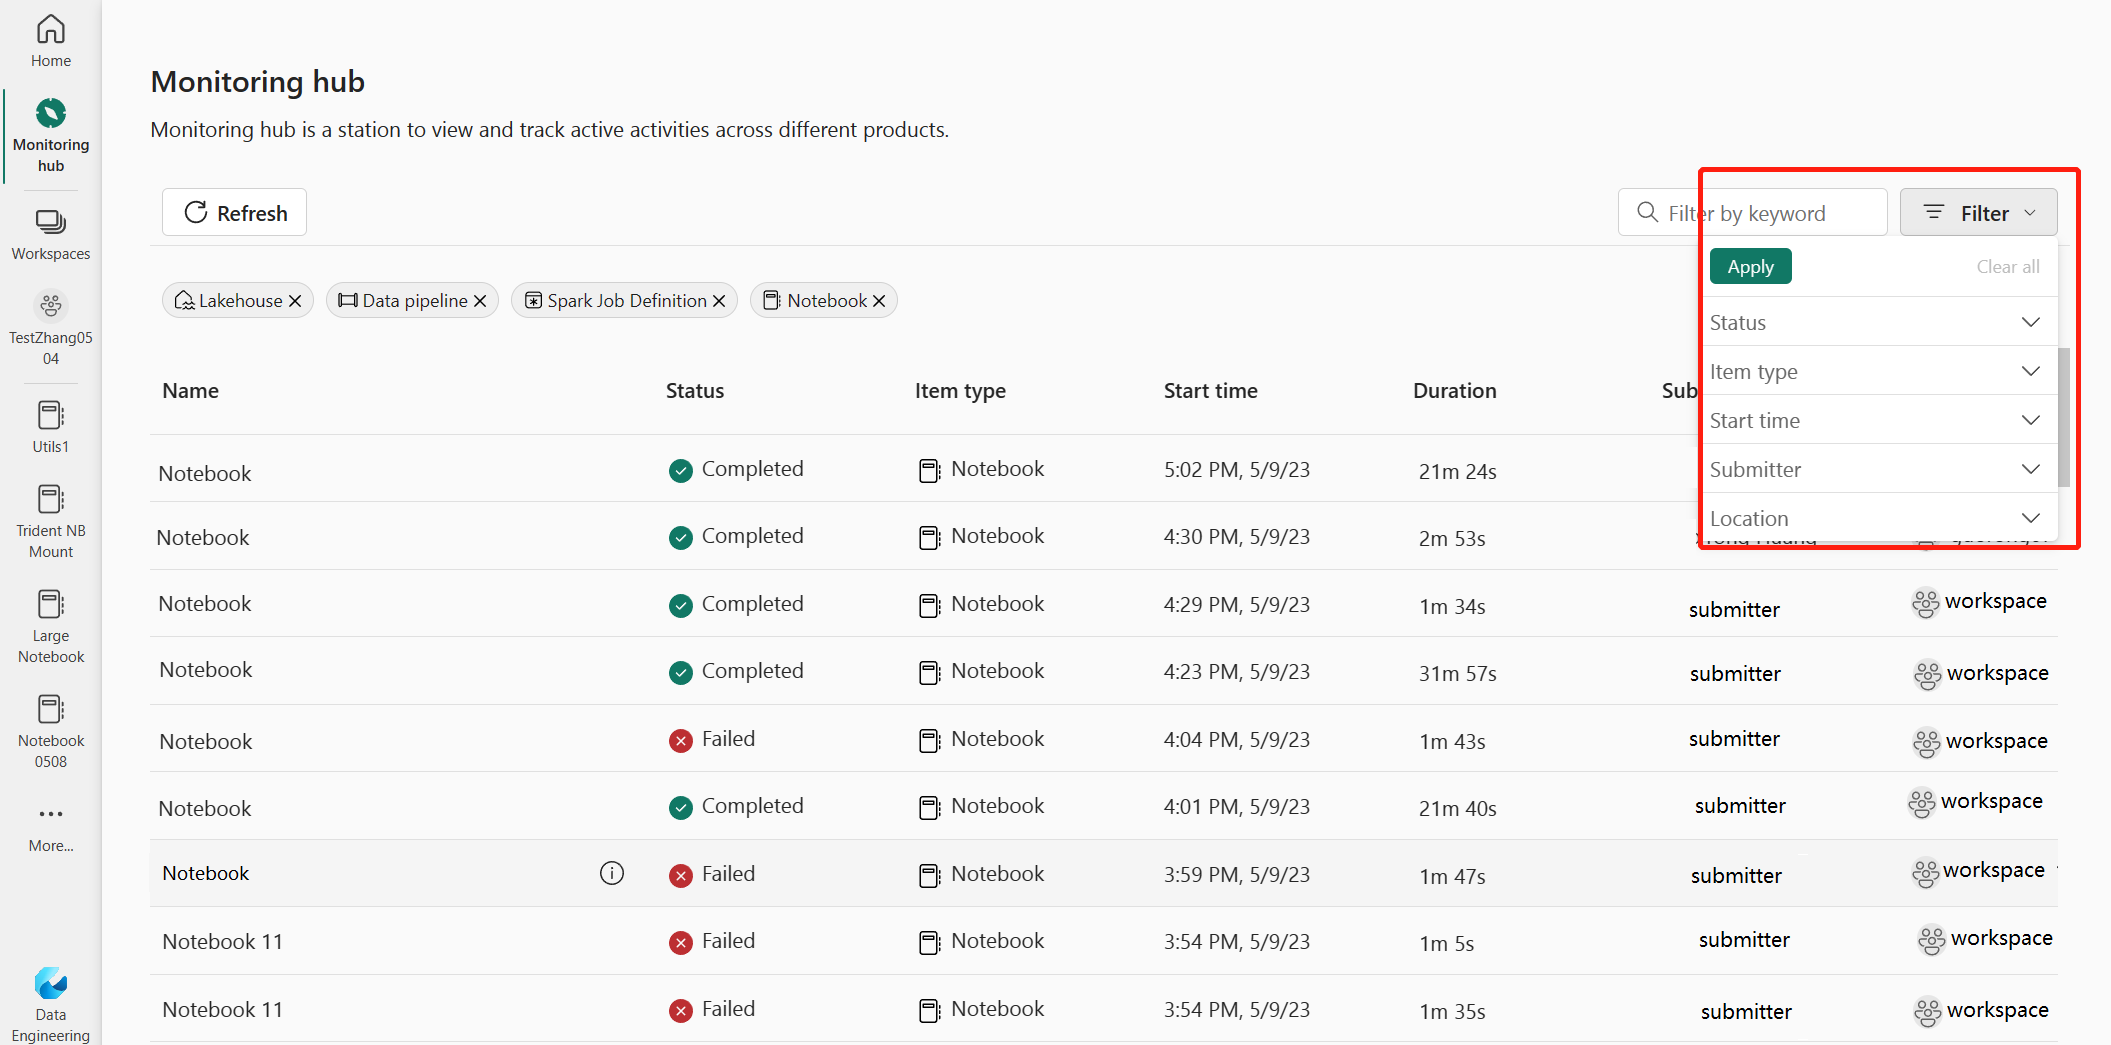
You can filter Apache Spark applications by Status, Item Type, Start Time, Submitter, and Location using the Filter pane in the upper-right corner.
Search Apache Spark applications
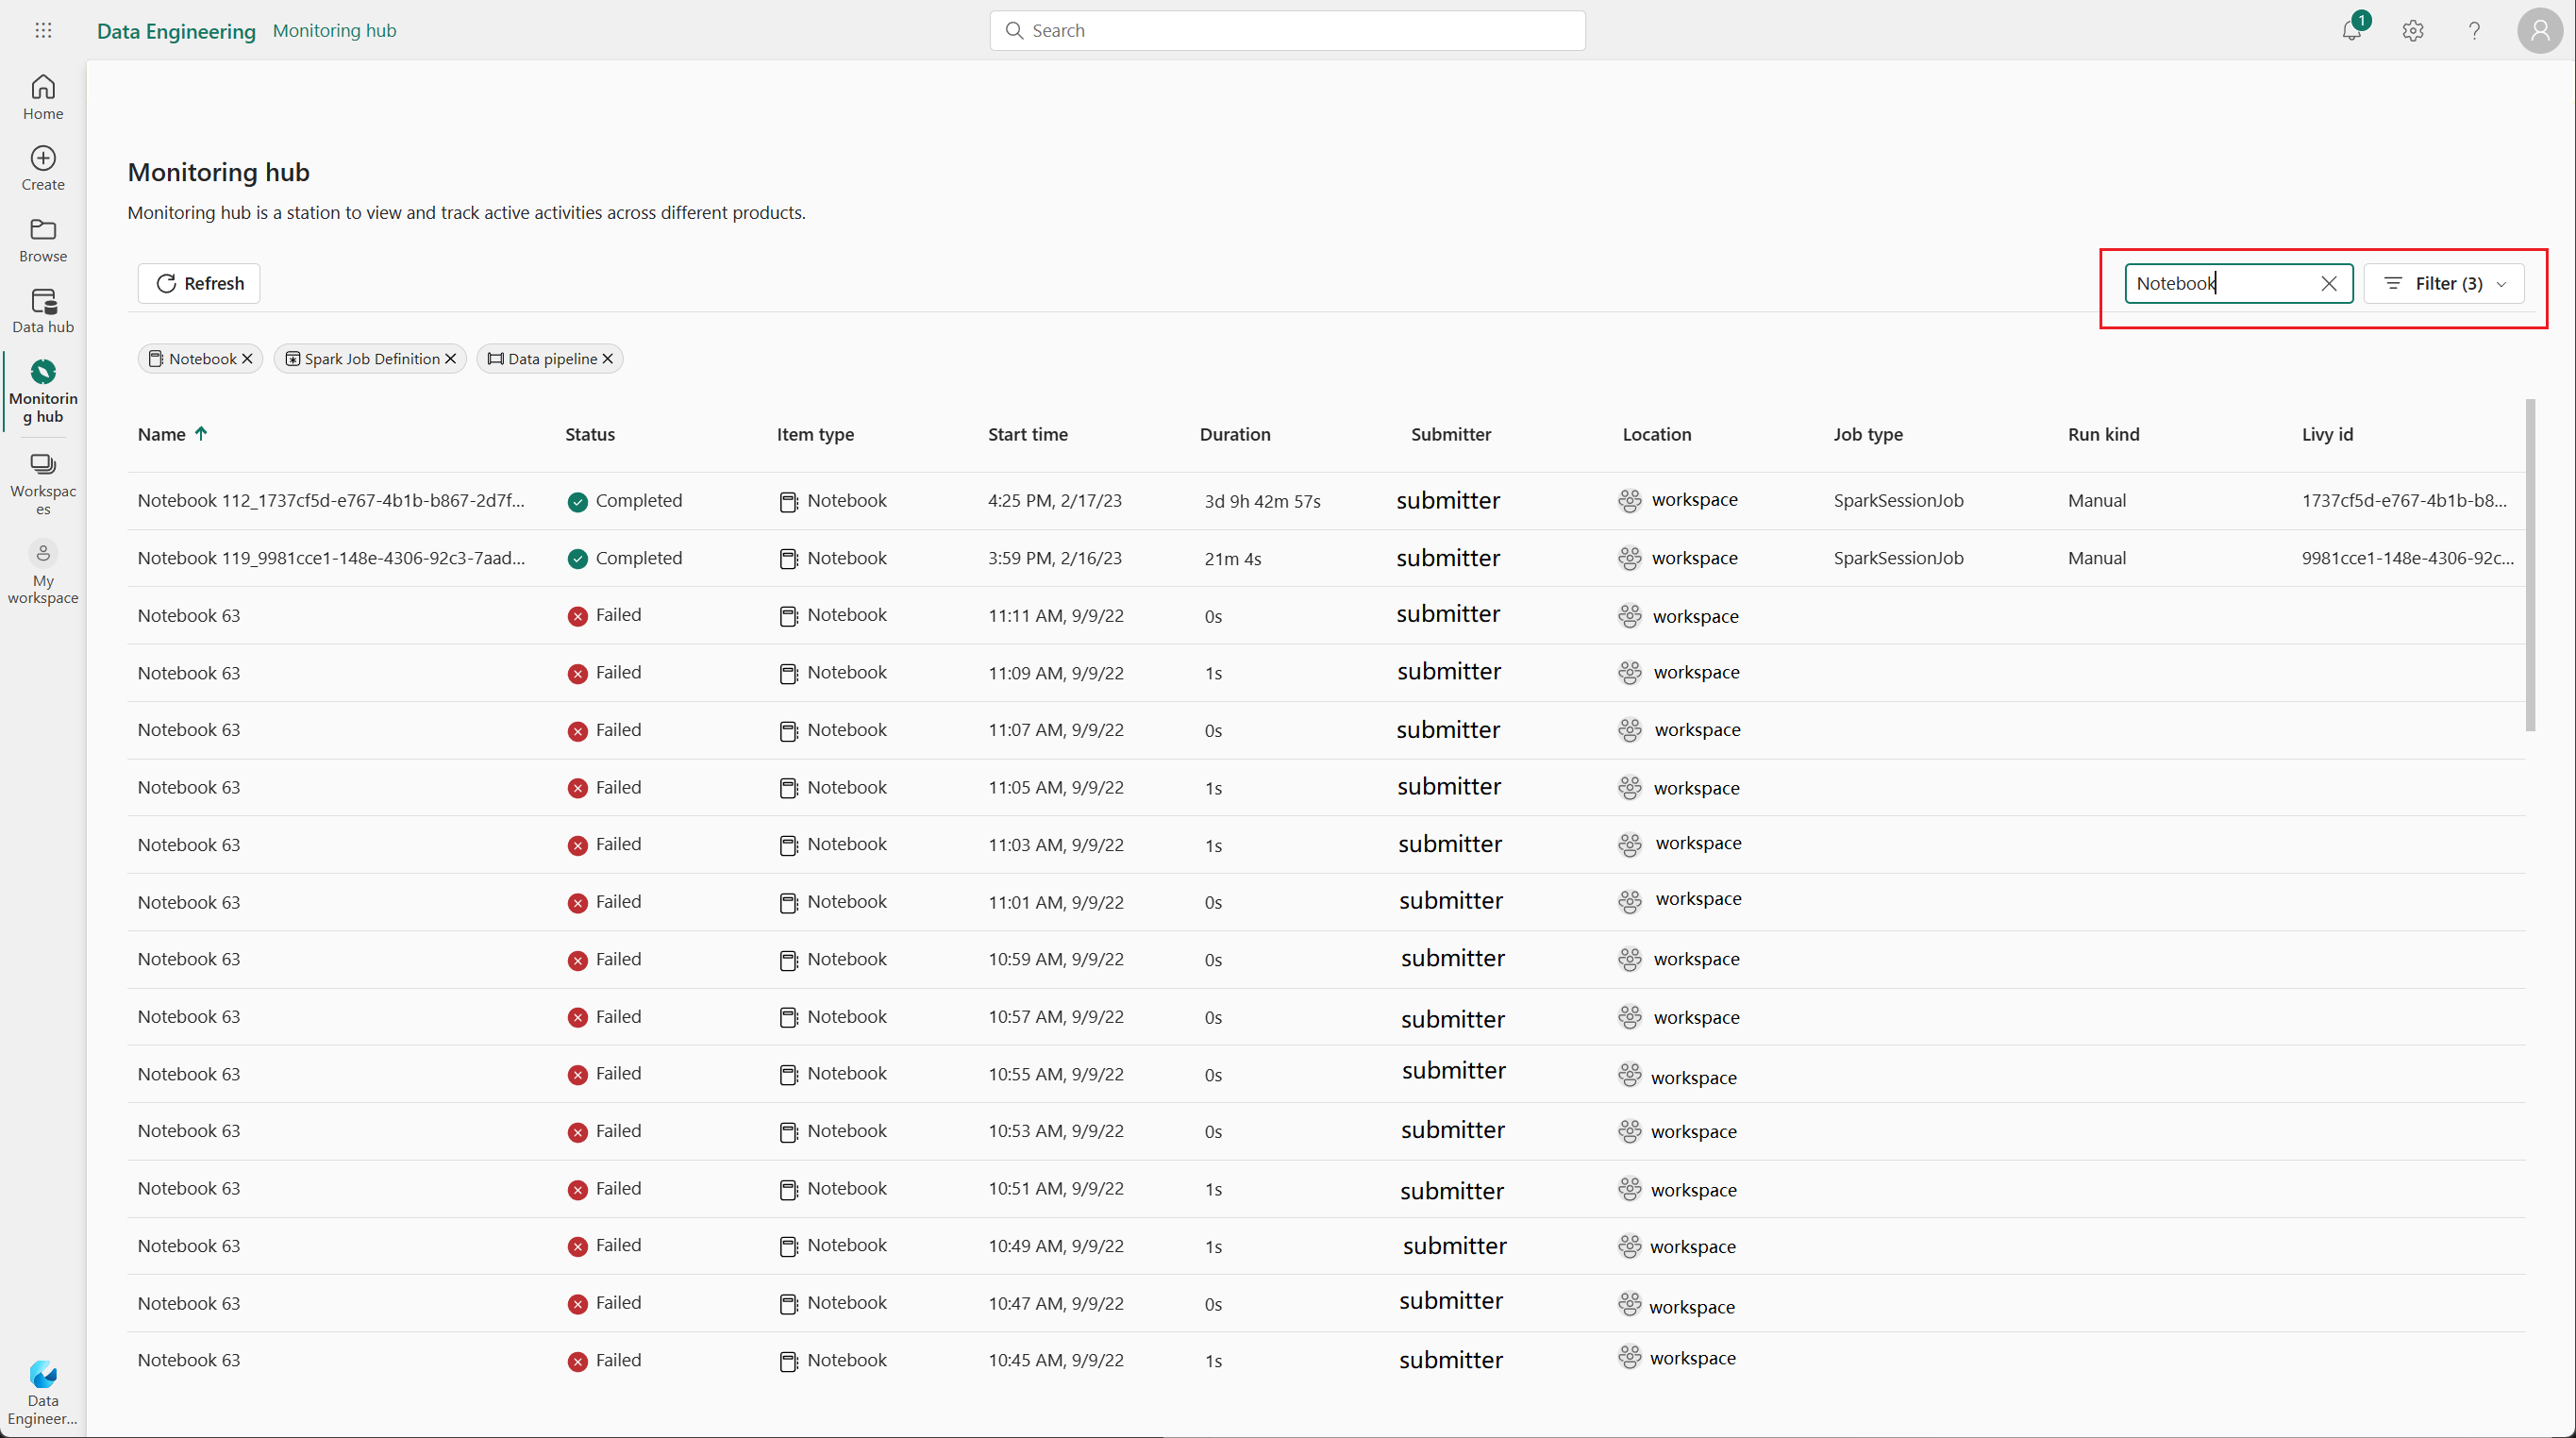
To search for specific Apache Spark applications, you can enter certain keywords in the search box located in the upper-right corner.
Column options Apache Spark applications
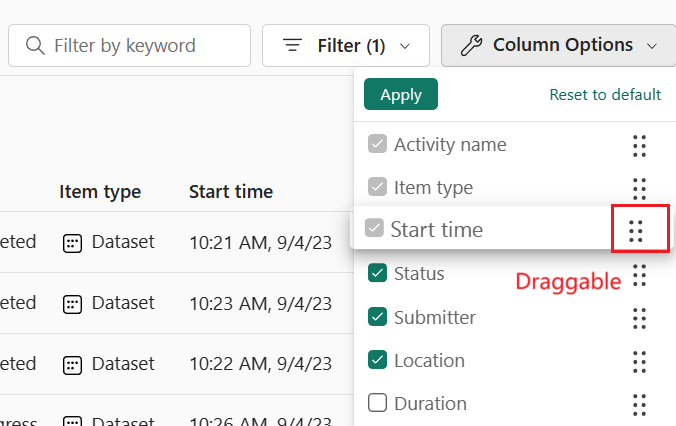
You can change the order in which the lists are displayed by selecting the list you want to display and then dragging the list options.
Enable upstream view for related Pipelines
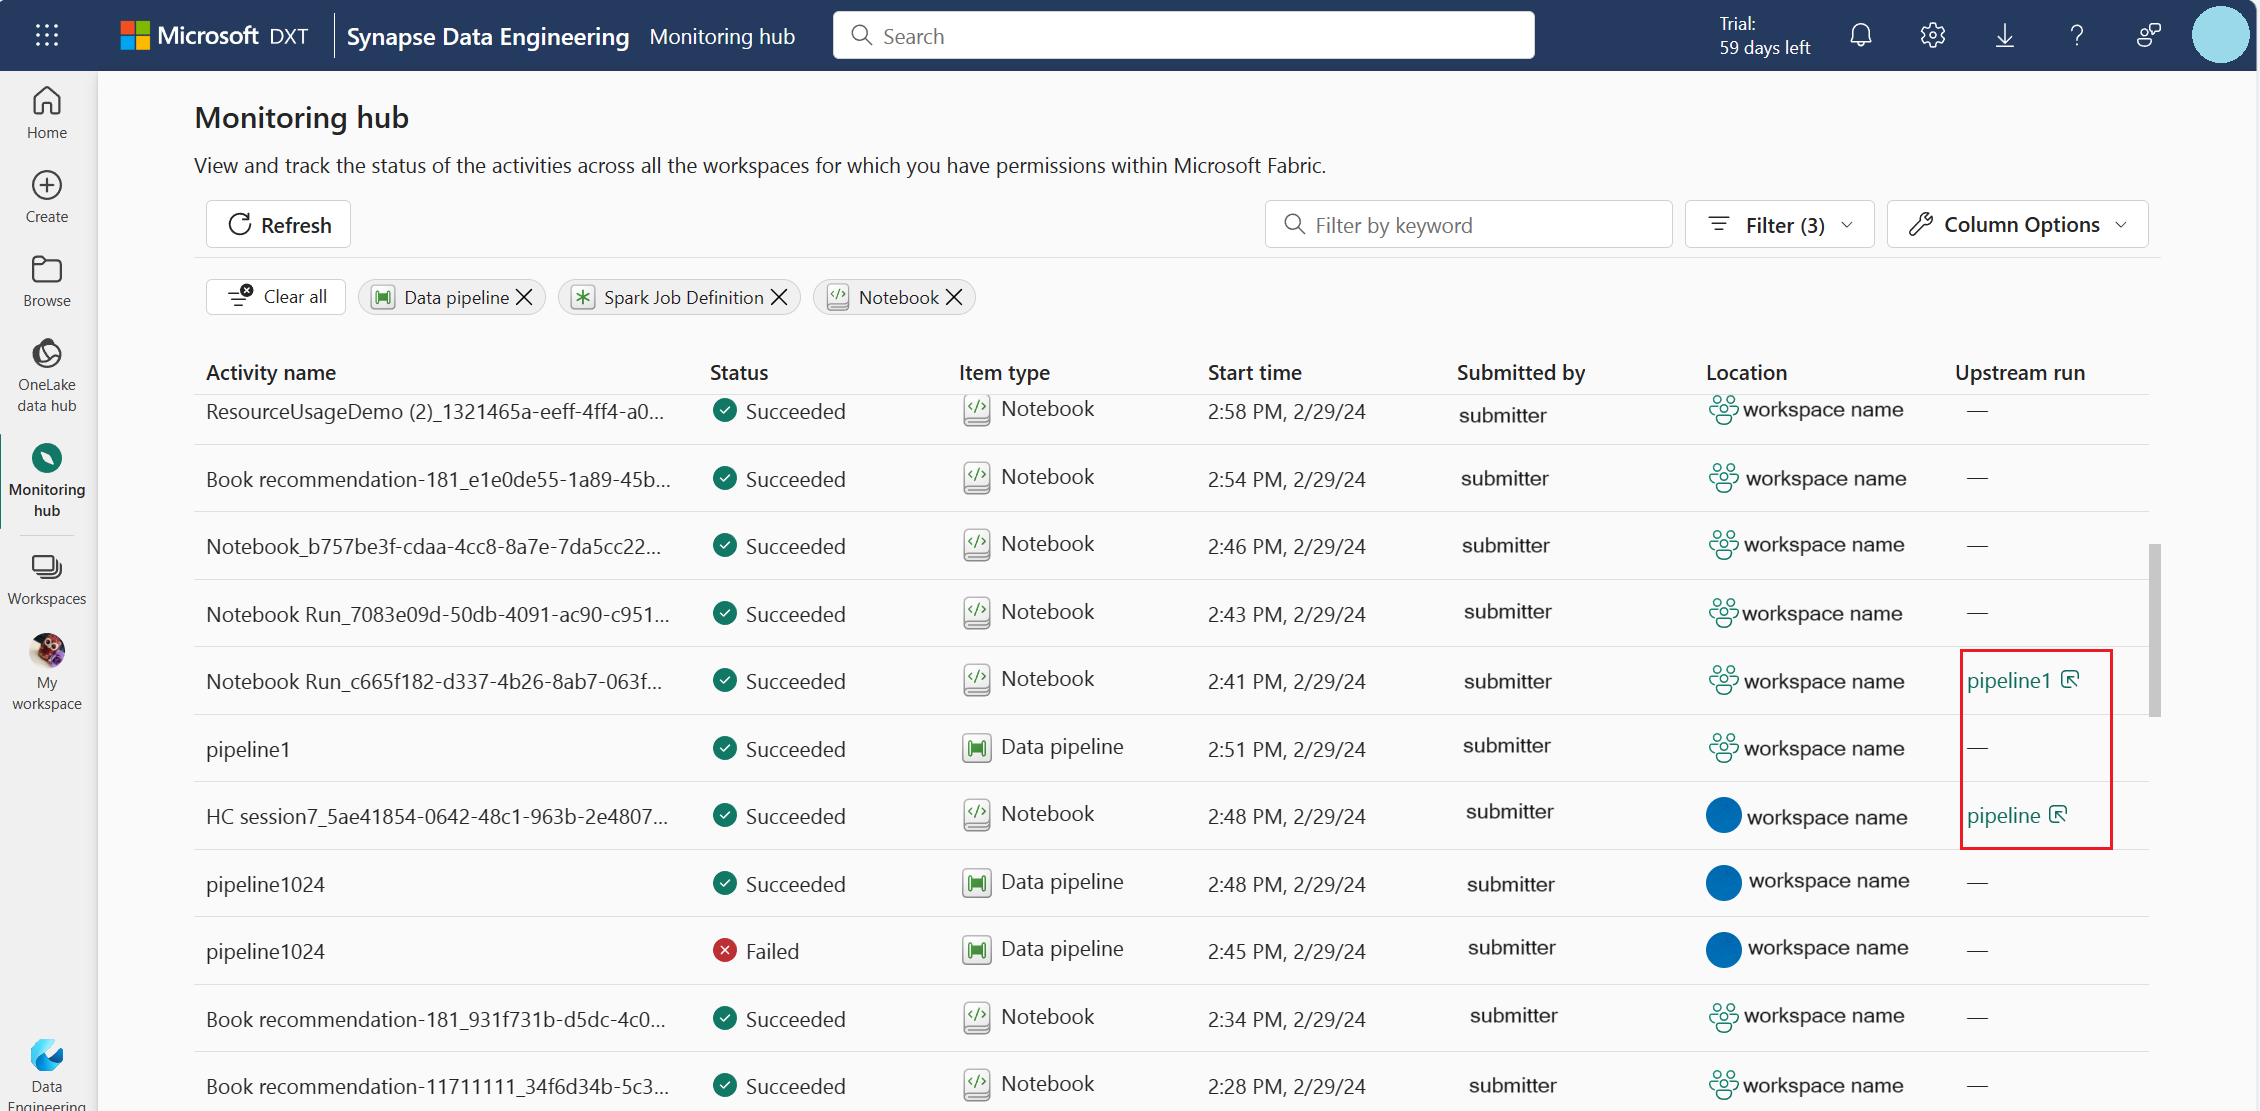
If you have scheduled notebook and Spark job definitions to run in pipelines, you can view the Spark activities from these notebooks and Spark job definitions in the monitoring hub. Additionally, you can also see the corresponding parent pipeline and all its activities in the monitoring Hub.
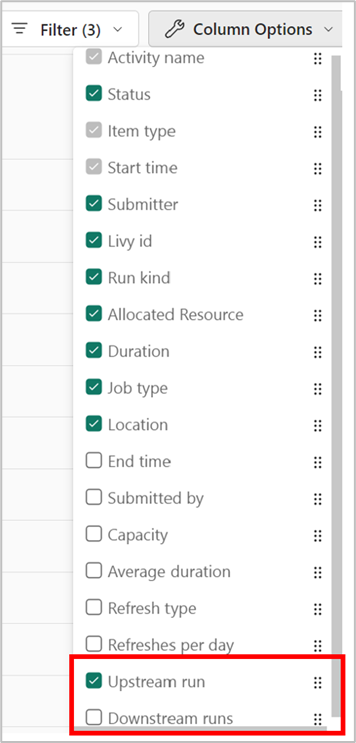
- Select the Upstream run column option.
- View the related parent pipeline run in the Upstream run column, and click the pipeline run to view all its activities.
Manage an Apache Spark application
When you hover over an Apache Spark application row, you can see various row-level actions that enable you to manage a particular Apache Spark application.
View Apache Spark application detail pane
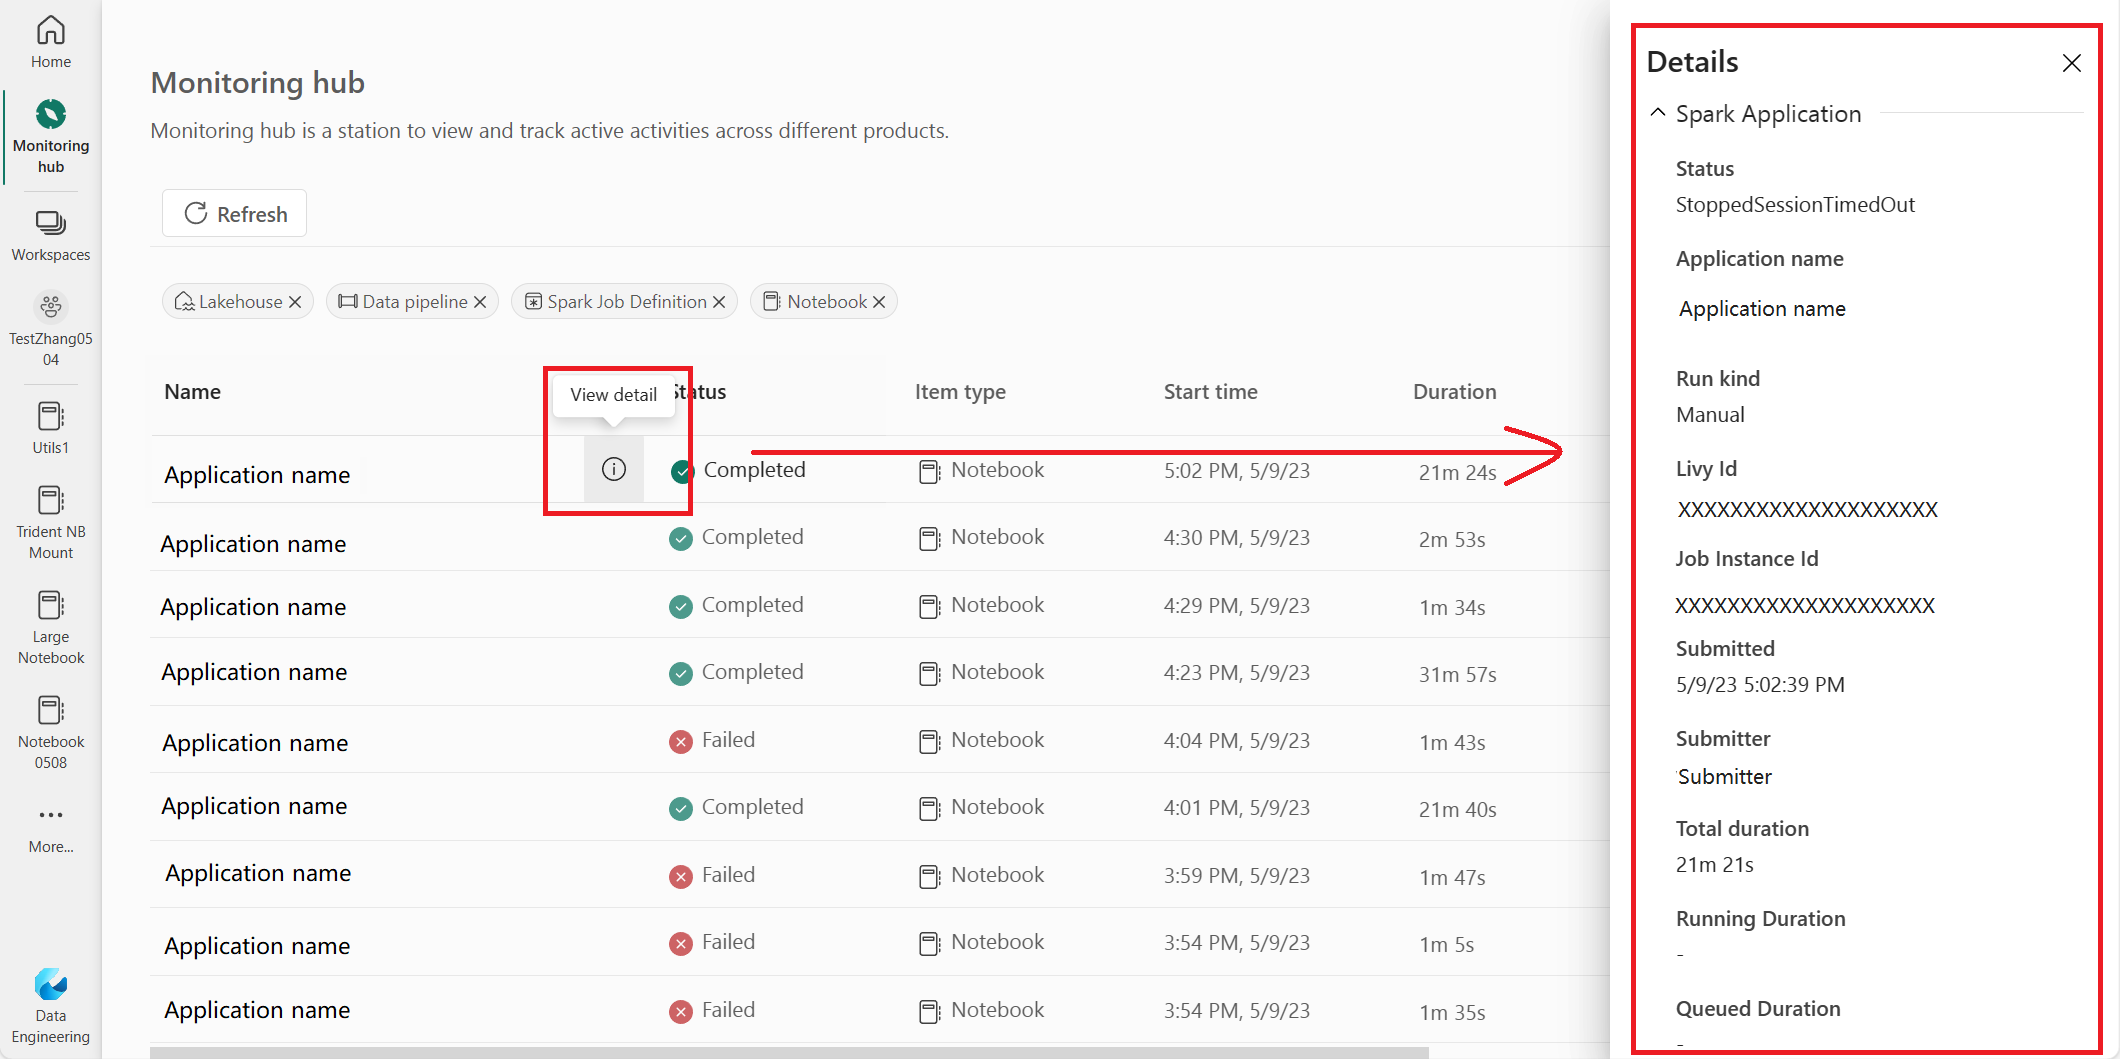
You can hover over an Apache Spark application row and click the View details icon to open the Detail pane and view more details about an Apache Spark application.
Cancel an Apache Spark application
If you need to cancel an in-progress Apache Spark application, hover over its row and click the Cancel icon.
Navigate to Apache Spark application detail view
If you need more information about Apache Spark execution statistics, access Apache Spark logs, or check input and output data, you can click on the name of an Apache Spark application to navigate to its corresponding Apache Spark application detail page.
Related content
Feedback
Coming soon: Throughout 2024 we will be phasing out GitHub Issues as the feedback mechanism for content and replacing it with a new feedback system. For more information see: https://aka.ms/ContentUserFeedback.
Submit and view feedback for
