Build patient cohorts with generative AI in discover and build cohorts (preview)
[This article is prerelease documentation and is subject to change.]
Discover and build cohorts (preview) uses generative AI to help you build patient cohorts faster and easier, without needing any advanced programming skills. You can use the cohorts for different purposes, such as:
- Health trend studies
- Quality assessments
- Clinical trials
- Historical research
Building queries with generative AI is an iterative process. Here's a high-level overview:
- Generate query criteria using natural language input: Describe the target patient group by entering natural language in a generative AI Copilot experience.
- Refine the query criteria: Adjust the query as needed by providing more natural language input or manually editing the criteria.
- Run the query: Run the query to assess its effectiveness in retrieving patients for the cohort.
- Iterate: Evaluate the results and repeat the process as necessary.
- Save the data: Save the finalized cohort data in a lakehouse.
Complete the steps in Set up discover and build cohorts (preview) in healthcare data solutions before exploring the query generation process.
Generate a query with natural language input
Discover and build cohorts (preview) uses AI to help you design queries.
Open the healthcare cohort item in your healthcare data solutions environment.
On the right pane, select Query Builder.
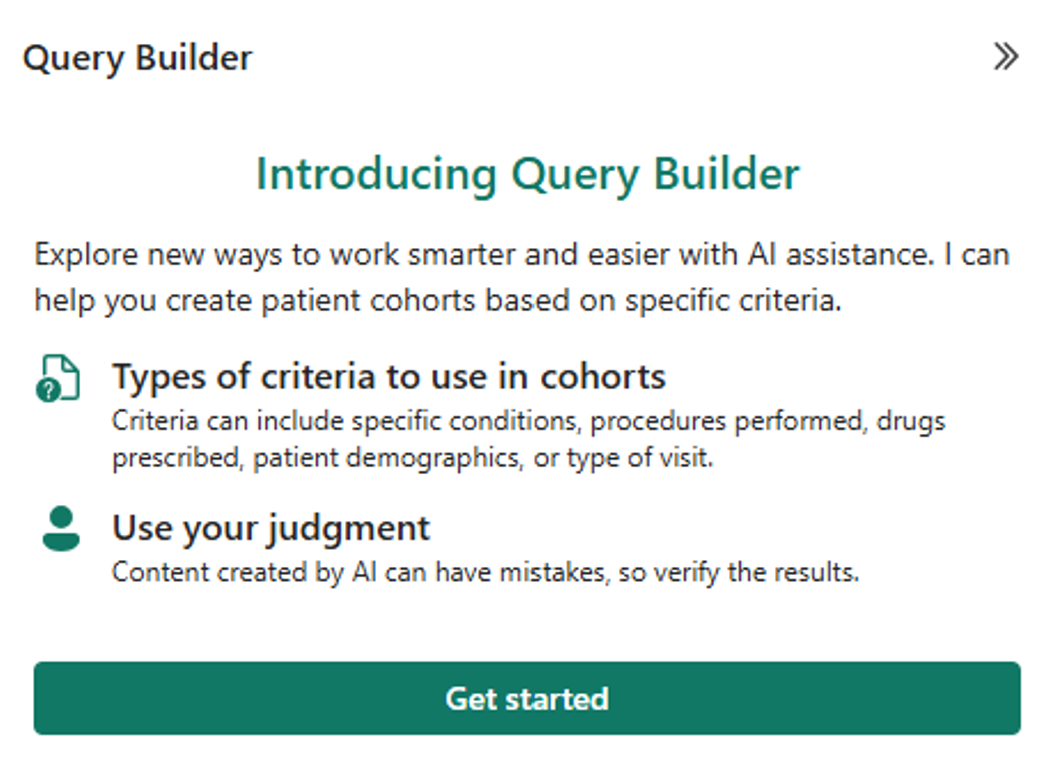
Review the preview terms and the AI transparency note, and then select Get started.

In the Query Builder textbox, enter a question and then select the paper airplane icon. You can see some examples appear in the chat pane. For more examples of what you can enter, see Filter data using natural language input.
Review the query criteria. You can also manually edit the criteria as needed. Repeat steps 4 and 5 until you achieve the desired outcome.
Filter data using natural language input
These examples show how to use natural language to filter patient data based on diagnoses, medications, demographics, procedures, encounters, and dates.
Diagnosis filtering
- Single condition: Find patients diagnosed with gallstones.
- Multiple conditions: Identify patients diagnosed with high cholesterol and diabetes.
Medication history filtering
- Single medication: Retrieve patients who took lisinopril 10-mg oral tablet.
- Multiple medications: Locate patients who received a 1-ml epoetin alfa 4000 unit injection and also took prednisone.
Demographic filtering
- Retrieve female patients over the age of 35.
- Find African American patients.
- Find Hispanic patients.
Procedure filtering
- Find patients who had an appendectomy.
Encounter filtering
- Identify patients who had an appendectomy after January 1, 2020.
Date filtering
- Retrieve patients who took prednisone after July 10, 2023.
Observation filtering
- Find patients who have a hemorrhage.
Measurement filtering
- Find patients with psychosine in their blood.
Cross-condition filtering
You can combine multiple conditions such as Patients with {Diagnosis} x {Medication} x {Demographics} x {Procedure} x {Encounter}. For example:
- Patients who received a 1-ml epoetin alfa 4000 unit injection, took prednisone, and are over 30 years old.
- Patients diagnosed with epilepsy and asthma, or patients diagnosed only with diabetes mellitus.
Refine the query criteria manually
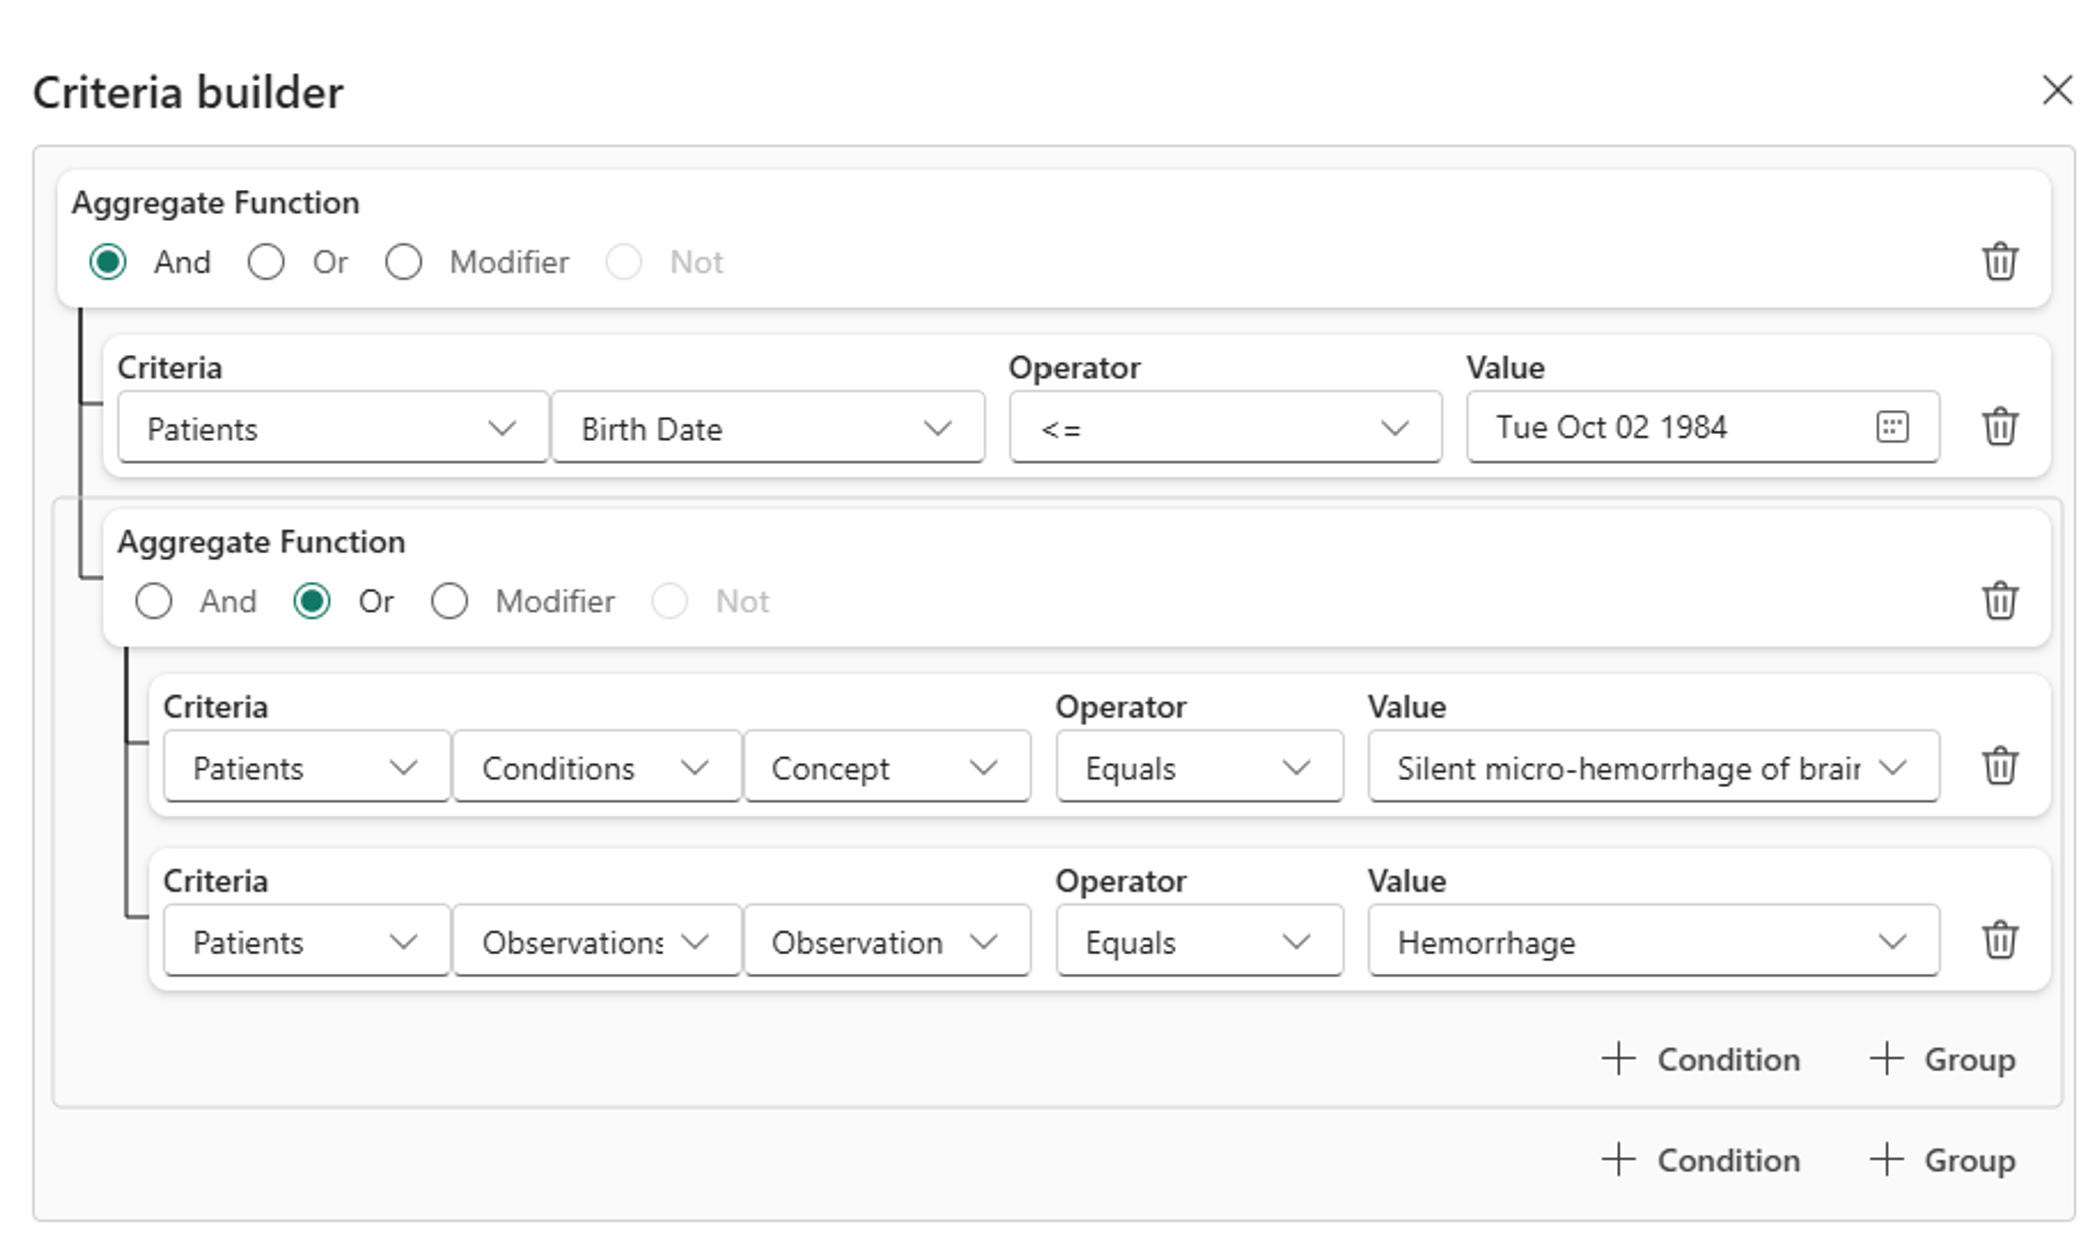
Discover and build cohorts (preview) uses AI to convert natural language requests into query criteria. However, the results may sometimes vary in accuracy. You can manually adjust the AI-generated query or build a new query using the Criteria builder. The criteria builder automatically populates fields based on the dataset connected in your lakehouse. You can refine your search by setting criteria, selecting an operator, and specifying a value. For more complex searches, combine multiple criteria using the AND or OR operators.
On the Criteria canvas, select the pencil icon.
In the Criteria builder pane, refine the criteria. The Criteria builder dialog is a useful tool for exploring available data fields for filtering. For example, you can filter patient data by expanding fields such as year of birth, conditions by concept code, or gender.

Select Update criteria.
Run the query
There are two different options to run a query.
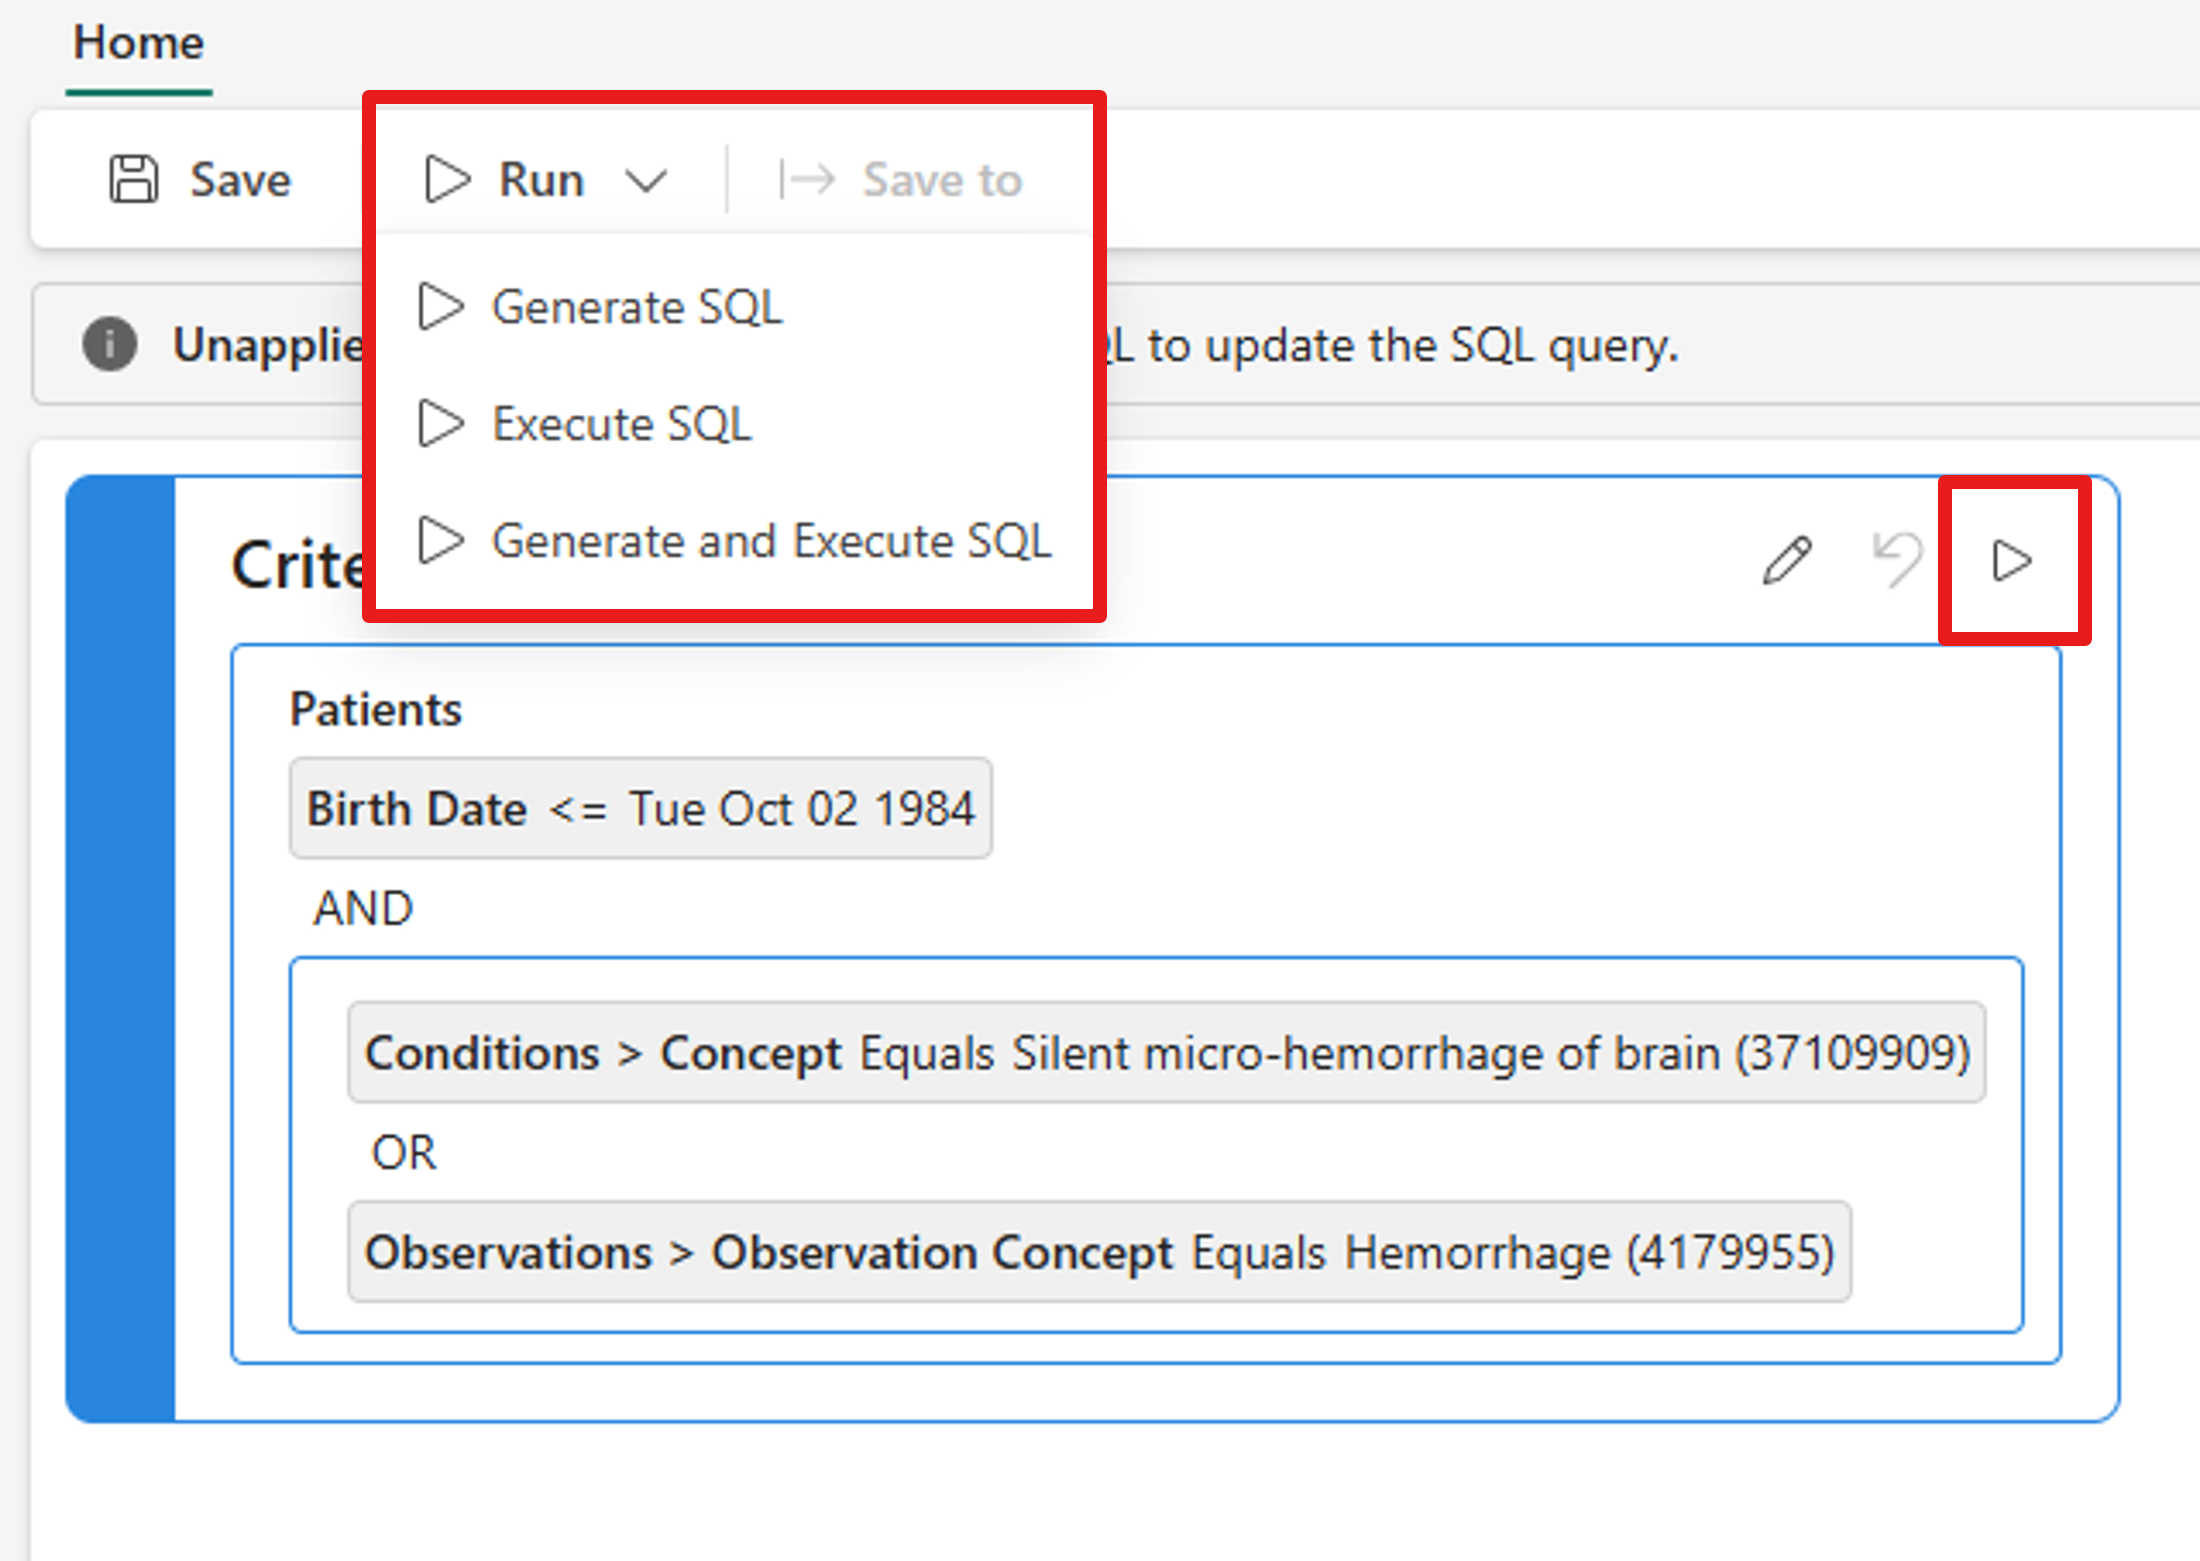
- On the Criteria canvas, select the Run query button. Discover and build cohorts (preview) generates a SQL code based on the query criteria and executes the SQL query against the dataset to create a cohort.
OR
- On the top toolbar, expand the Run dropdown list and select either Generate SQL, Execute SQL, or Generate and Execute SQL.

View the SQL code for the query
To view the SQL code for the query, select Query on the bottom toolbar.
If you haven't yet run Generate SQL, this page would be empty. After SQL generation, you can view the exact query here.
View patients that match the query criteria
To view the patient metadata in your cohort, select Data on the bottom toolbar. This page provides a simplified view of the Person table in your OMOP dataset.
To view the matching patient records, select Viewer on the bottom toolbar. This page displays specific patient files, including notes and images.
View demographic statistics about the dataset
Discover and build cohorts (preview) generates a Power BI report containing aggregated demographic statistics about the dataset. This report automatically updates each time you run a SQL job.
Initially, the report consists of a single Lakehouse page representing the full dataset. After you run the first SQL job, the report updates to include a Cohort page that represents the filtered data. Both pages contain a person_id filter to narrow down the statistics further.
To view this report, select Dashboard on the bottom toolbar.
Save the final dataset
To save the final dataset, select Save to on the top toolbar.
A wizard appears to guide you through the save process. Currently, the capability provides two options to save the data:
Save the full set of patient data to the lakehouse.
Download the patient IDs and metadata.
To save the full set of patient data, select option one and provide the cohort name, file format, and destination lakehouse.
After the export job completes, the files appear in your destination lakehouse under the Files folder. The lakehouse creates a new subfolder for each export, with each file corresponding to a single patient. Here's an example:
