Custom dimensions dashboard
![]()
Microsoft Sustainability Manager emission analytics offers a dedicated Custom dimensions report tab that provides the following capabilities:
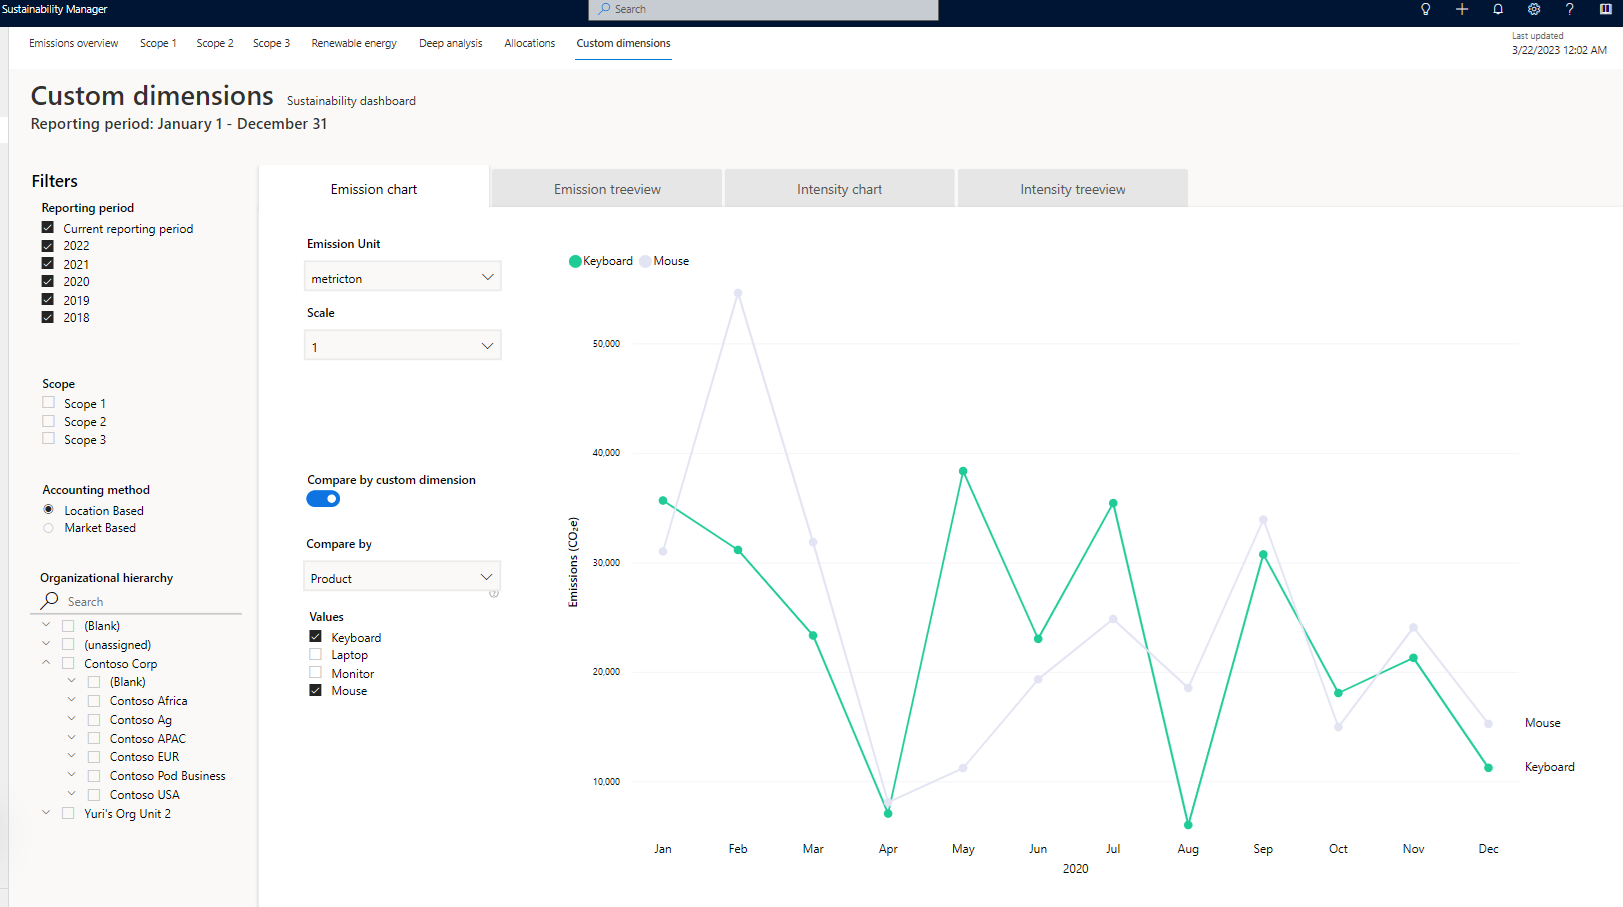
View a time chart of CO2E emissions broken out by custom dimension strings. For example, compare emissions by Product type, where Product type is a custom dimension with string values.
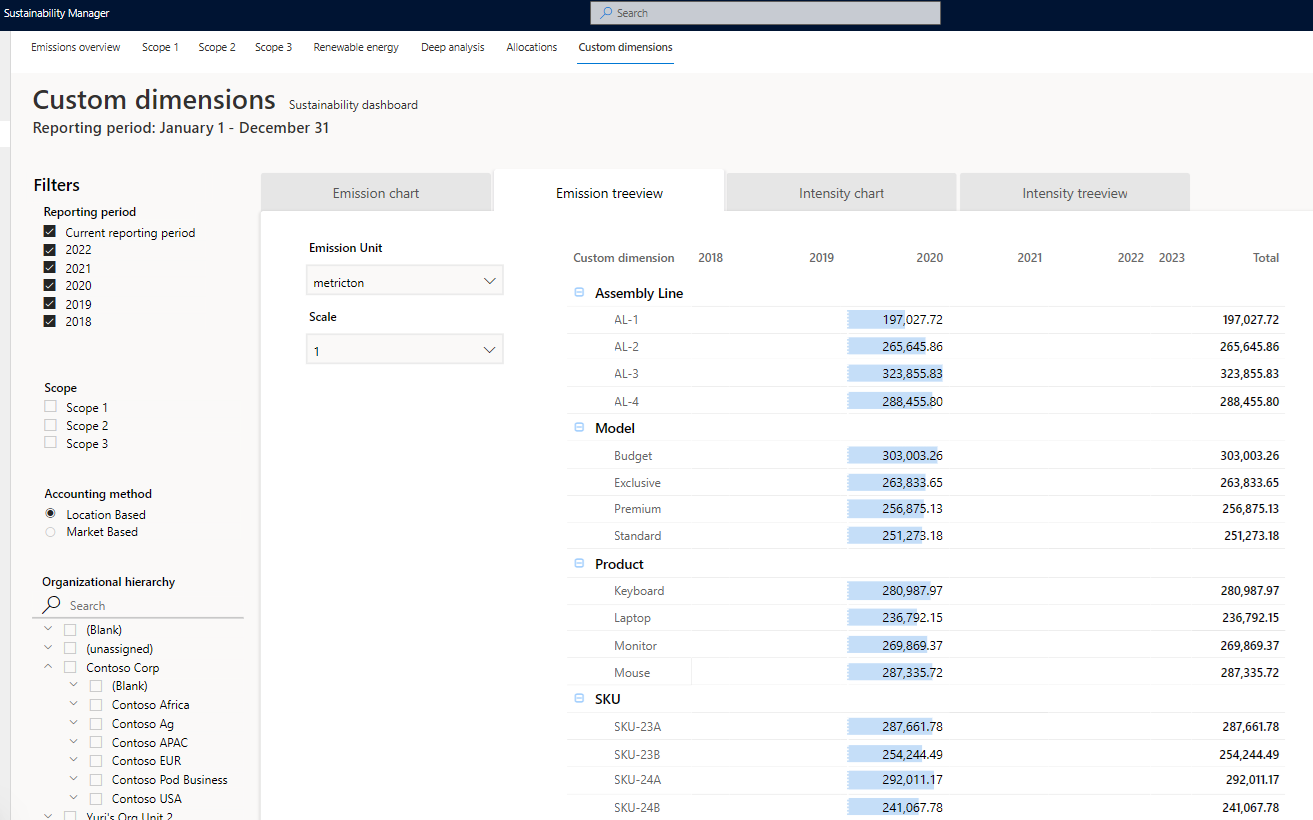
View a tree view of total CO2E emissions, where you can drill into each string custom dimension present in the data and view CO2E emissions by value.
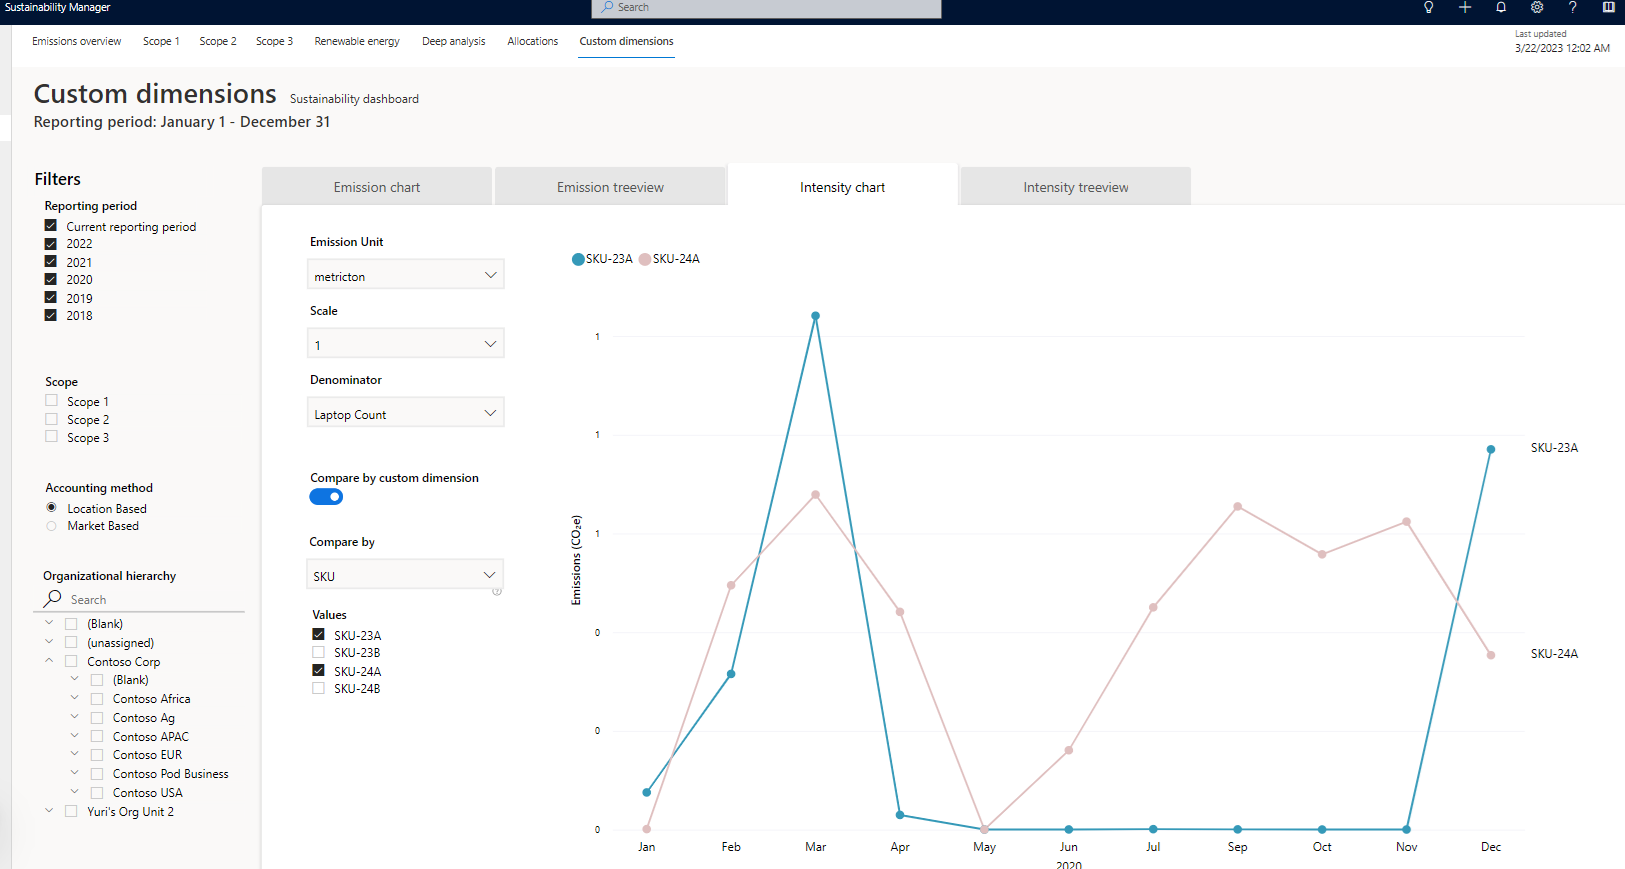
View a time chart of CO2E emissions intensity broken out by custom dimension strings, where the intensity denominator is a numeric custom dimension you select. For example, compare intensity of CO2e emissions per Product quantity by Product type, where Product quantity is a numeric custom dimension and Product type is a custom dimension with string values.
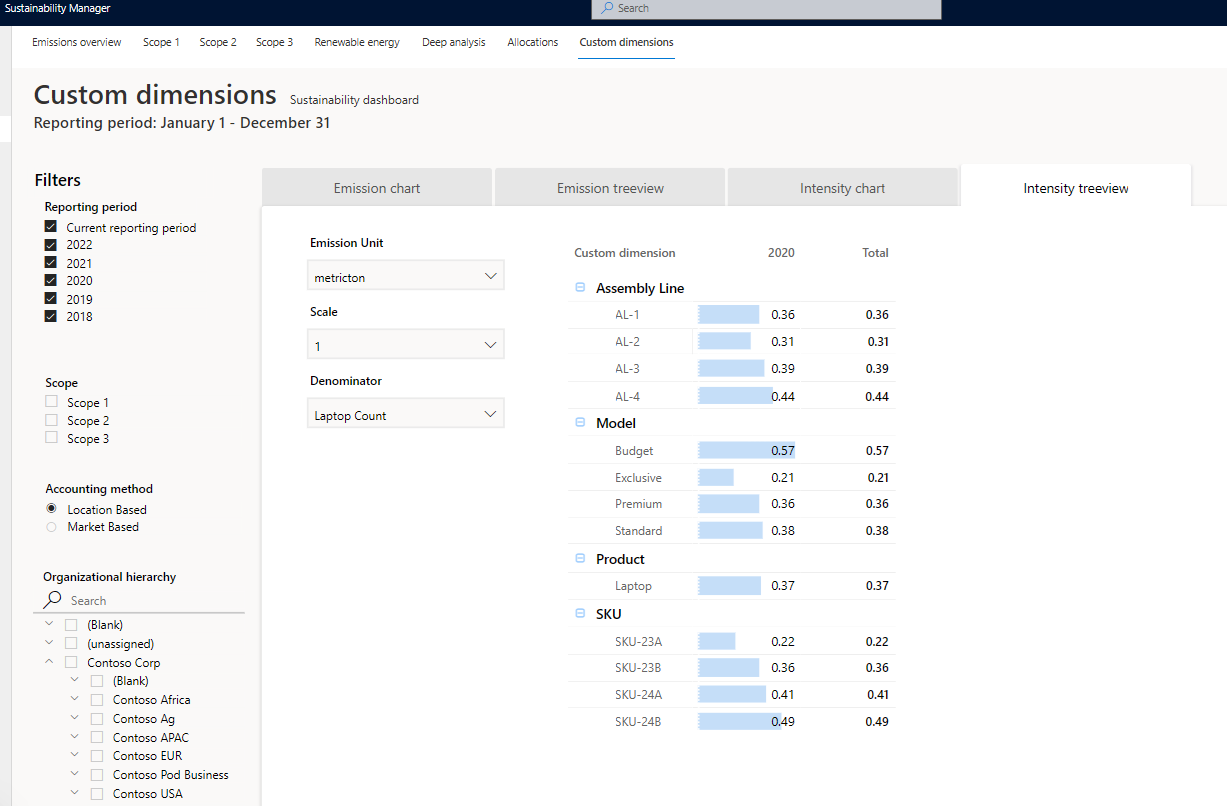
View a tree view of total CO2E emission intensity, where the intensity denominator is a numeric custom dimension you select. You can drill into each string custom dimension present in the data and view CO2E emission intensity associated with each unique string value.
Related information
- Extend the Cloud for Sustainability data model with custom dimensions
- Use custom dimensions in calculations
- Analytics
