Debug WebView2 apps with Visual Studio
Microsoft Visual Studio provides various debugging tools for web and native code in WebView2 apps, to debug web and native code in Win32 apps or Office Add-ins. This article focuses on debugging WebView2 controls. The other methods of debugging in Visual Studio are available, as well.
Summary of high-level steps
To debug JavaScript code in a WebView2 control:
Install the JavaScript diagnostics component in the Desktop development with C++ workload of Visual Studio, or in another platform's workload.
Set a breakpoint on a line of JavaScript code.
In the project's Properties > Debugging page, set Debugger Type to JavaScript (WebView2) (instead of Auto or Native).
Start the debugger, as usual. For example, in the menu bar, select Debug > Start Debugging (F5).
In the running WebView2 app, interact with a webpage that runs the JavaScript code. The debugger pauses on the line of JavaScript code that has the breakpoint.
Use the debugger panes in Visual Studio.
These steps are detailed below, using the main, Win32/C++ sample (WebView2APISample).
Requirements
Clone the WebView2Samples repo, if you want to follow the specific example steps below (using the main, Win32/C++ sample, WebView2APISample). A step below shows how to do this.
Install Visual Studio 2022. You can use Visual Studio 2022 to work with the WebView2 sample apps and your own WebView2 app. (Visual Studio 2019 works, as well.) A step below shows how to do this.
Install and set up the script debugger tools in Visual Studio. That is, install the Desktop development with C++ workload of Visual Studio (or the equivalent workload for a different language), including its JavaScript diagnostics component. A step below shows how to do this.
Build and run the main, Win32/C++ sample, so that the WebView2APISample app builds and runs (if you want to follow the specific example steps below). A step below shows how to do this.
To debug scripts, the app must be launched from within Visual Studio.
You cannot attach a debugger to a running WebView2 process.
Install the JavaScript diagnostics component
Use the Visual Studio Installer to install the Desktop development with C++ workload of Visual Studio, including its JavaScript diagnostics component, as follows. Or, if you are using a language workload other than C++, select that workload's JavaScript diagnostics component, similar to the below steps.
If not done already, clone the WebView2Samples repo, as described in Clone the WebView2Samples repo in Set up your Dev environment for WebView2.
If not done already, install Visual Studio 2022, as described in Install Visual Studio in Set up your Dev environment for WebView2.
In Visual Studio 2022, install the Desktop development with C++ workload, as follows:
In the Windows Explorer bar, type
Visual Studio Installer.Select Visual Studio Installer to open it.
In the Visual Studio Installer, on the installed version, click the More button, and then select Modify.
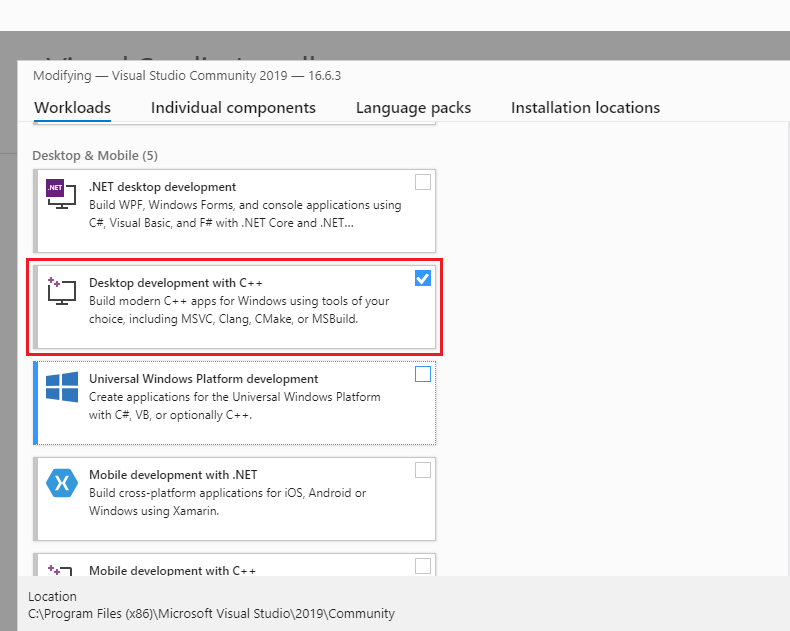
In Visual Studio, under Workloads, select the Desktop Development with C++ workload, so that a checkmark appears:
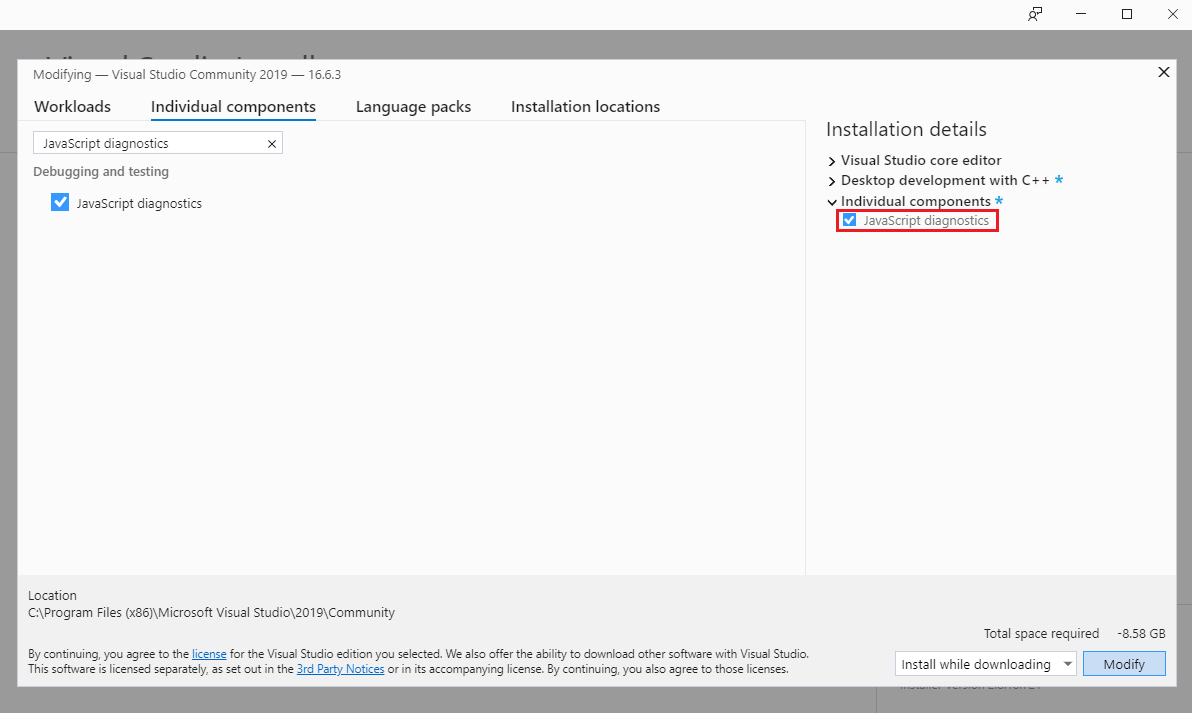
Select Individual components, at the top.
In the search box, enter
JavaScript diagnostics.Select the JavaScript diagnostics checkbox:
Click the Modify button.
Continue with the next section, below.
Select the JavaScript (WebView2) debugger
Next, enable script debugging for WebView2 apps, as follows.
If not done already, do the steps in Win32 sample app so that the WebView2APISample app builds and runs. The WebView2Samples solution should be open in Visual Studio, and the sample app should not be running. Or, open your own WebView2 app project in Visual Studio.
In Visual Studio, in Solution Explorer, right-click the WebView2APISample project (or your own project), and then select Properties.
The Property Pages dialog opens.
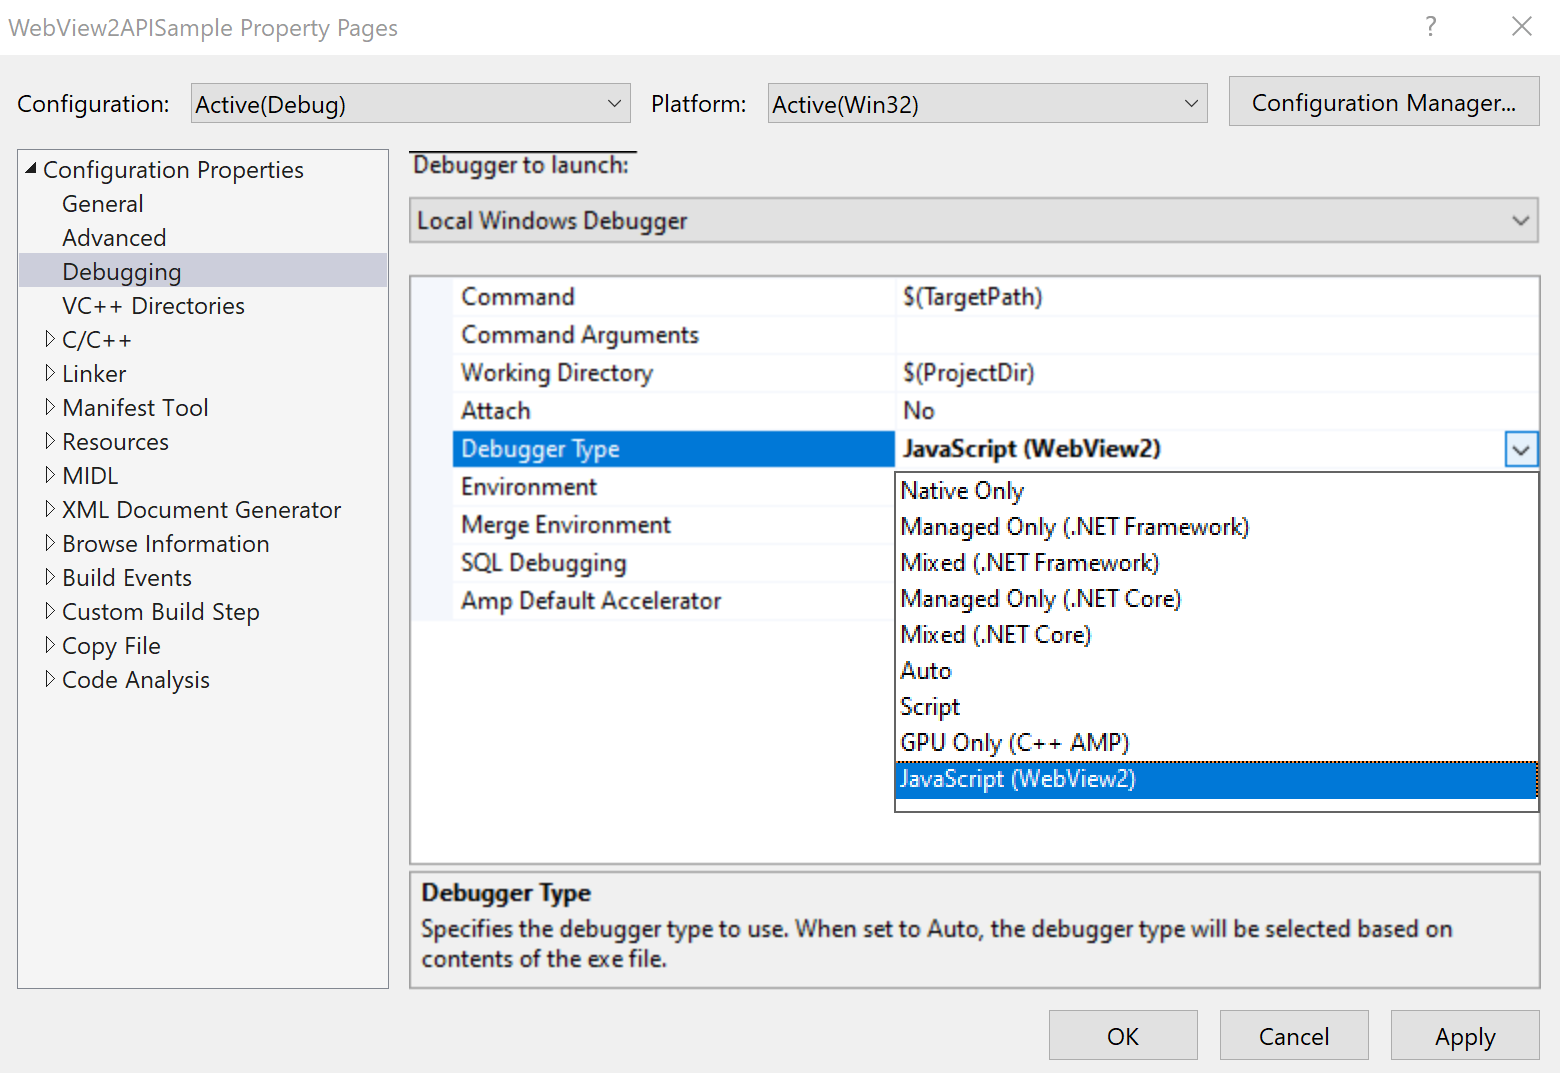
On the left, expand Configuration Properties, and then select Debugging.
To the right of Debugger Type, select JavaScript (WebView2), and then click the OK button:
Debug your WebView2 app
After doing the above setup, debug your WebView2 app, as follows.
To set a breakpoint in your source code, hover to the left of the line number, and click to set a breakpoint. For example, open
WebView2Samples\SampleApps\WebView2APISample\assets\ScenarioJavaScriptDebugIndex.js, and set a breakpoint on line 2:console.log("onAddClick+");, in the body of theonAddClickfunction: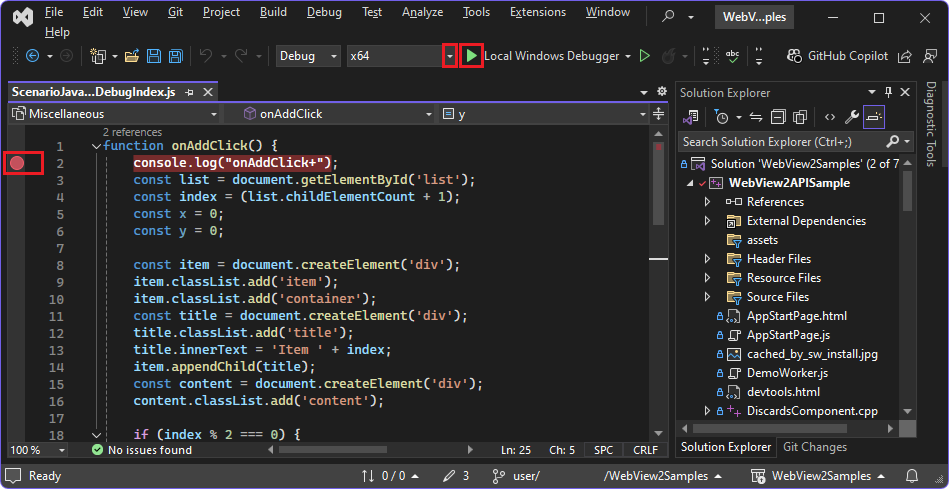
When setting a breakpoint, you must open the file that's in the exact same path that's associated with your WebView2 control, because the JS/TS debug adapter doesn't perform source path mapping.
The breakpoint will be triggered when this section of the code is executed. This breakpoint is triggered upon clicking the Add a new item button in the sample app, in a later step below.
Select the bit size of the platform, such as x64.
To run the debugger, do any of the following:
- In the menu bar, select Debug > Start Debugging (F5).
- In Solution Explorer, right-click the project > Debug > Start New Instance or Step Into New Instance.
- Click the green Play button to the left of Local Windows Debugger.
The WebView2APISample app (or your own app) runs and opens, and the debugger connects to the first WebView2 process that's created. In Properties > Debugging for the project, Local Windows Debugger was set to JavaScript (WebView2).
In Visual Studio, click the Output tab, in the lower right.
The tab contains only the following message, which mentions the JS debugger: "Verbose logs are written to: C:\Users\myUsername\AppData\Local\Temp\visualstudio-js-debugger.txt".
In the WebView2APISample app window, select Scenario > Script Debugging > JavaScript Local File.
The file
WebView2APISample/Debug/x64/assets/ScenarioJavaScriptDebugIndex.htmlis rendered: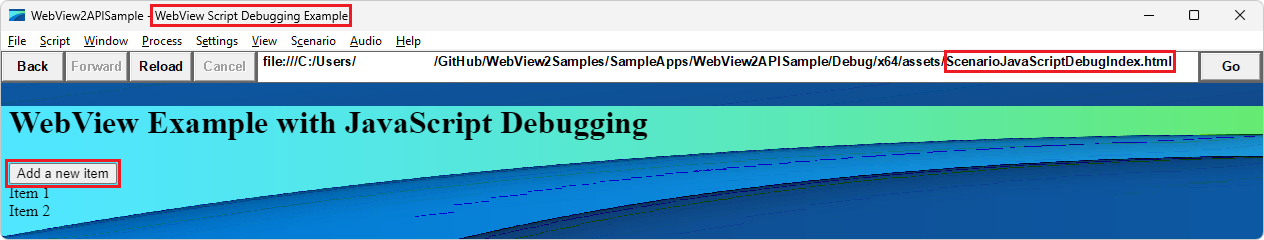
In Visual Studio, examine the Output pane. The following output has been added:
This is the very first line of code that executes.
Second
Third
inside
onAddClick+
onAddClick-
onAddClick+
onAddClick-
End
In the webpage in the app, click the Add a new item popup button.
The breakpoint in the
onAddClickfunction is hit, and the app is paused in the debugger.Switch to the Visual Studio window, and examine the debugger panes.
Click the Output tab, to display the app's output:
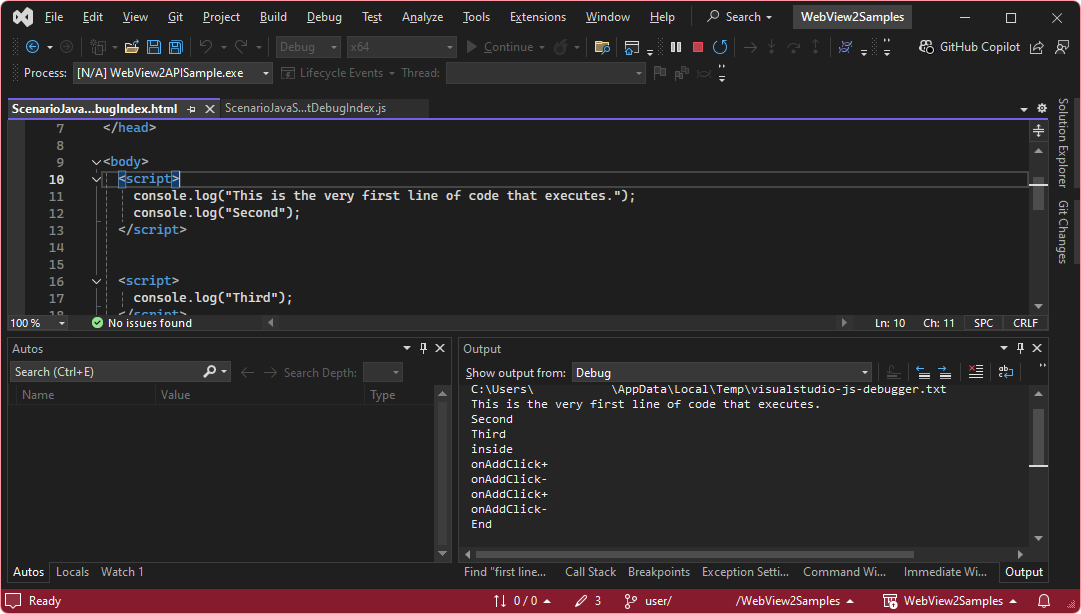
The app output shows "This is the very first line of code that executes", because of the line
console.log("This is the very first line of code that executes.");in the fileWebView2Samples\SampleApps\WebView2APISample\assets\ScenarioJavaScriptDebugIndex.html.
Troubleshooting
Open DevTools using an approach other than F12
When you debug your app in Visual Studio with the native debugger attached, when viewing your running app, pressing F12 might start the native debugger instead of starting Developer Tools.
To open DevTools, press Ctrl+Shift+I. Or, right-click the page in the running app, and then select Inspect.
Virtual source path mapping not supported in Visual Studio 2019
If you use the WebView2 SetVirtualHostNameToFolderMapping method, the debugger in Visual Studio 2019 doesn't understand the virtual source path mapping, so breakpoints don't work correctly.
When setting a breakpoint, you must open the file that's in the exact same path that's associated with your WebView2 control, because the JS/TS debug adapter doesn't perform source path mapping.
Virtual source path mapping is supported by the debugger in Visual Studio Code.
See also
- Get started with WebView2
- WebView2Samples repo - a comprehensive example of WebView2 capabilities.
- WebView2 API reference