Microsoft Search Usage Report – Queries
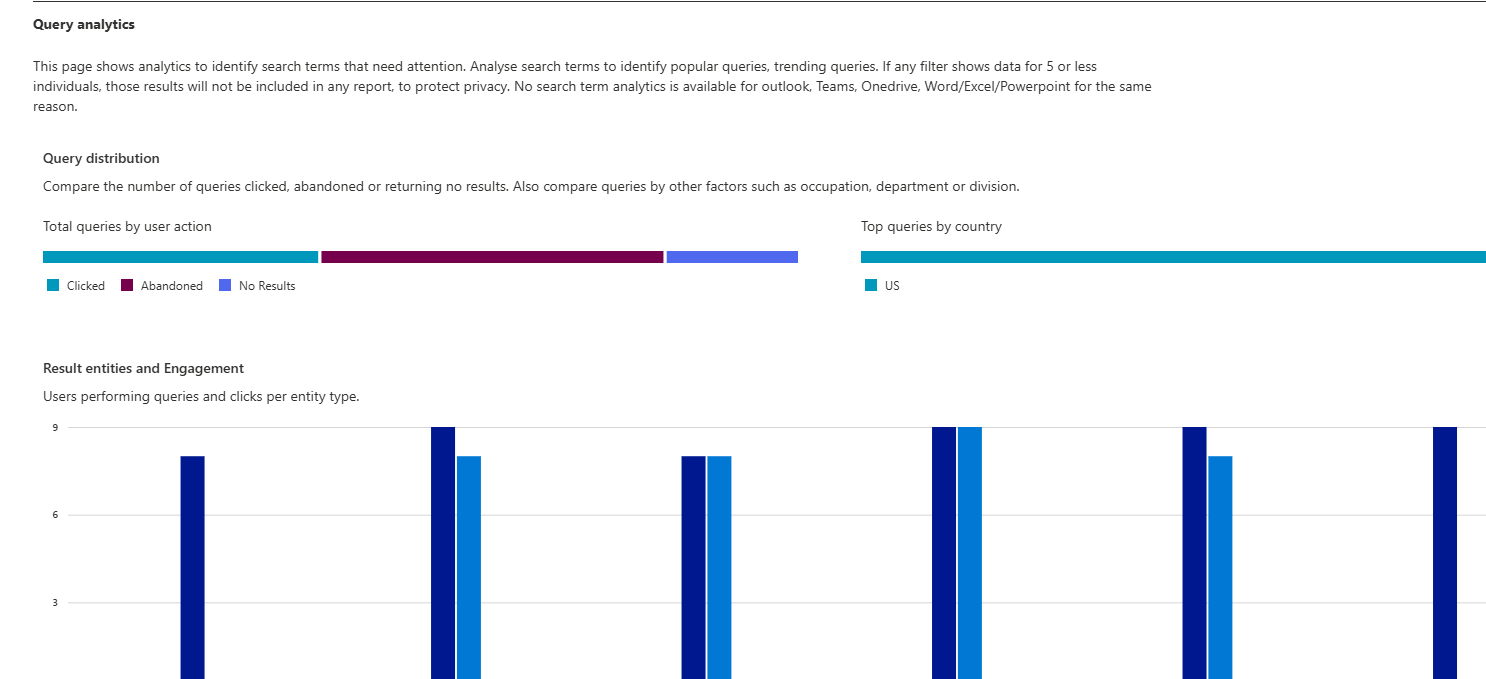
In the Microsoft Search Usage Report, the Query analytics section displays how queries are distributed, how frequently users interact with various kinds of entities in search outcomes, and the 10 most common search terms that need intervention.
Result entities and engagement
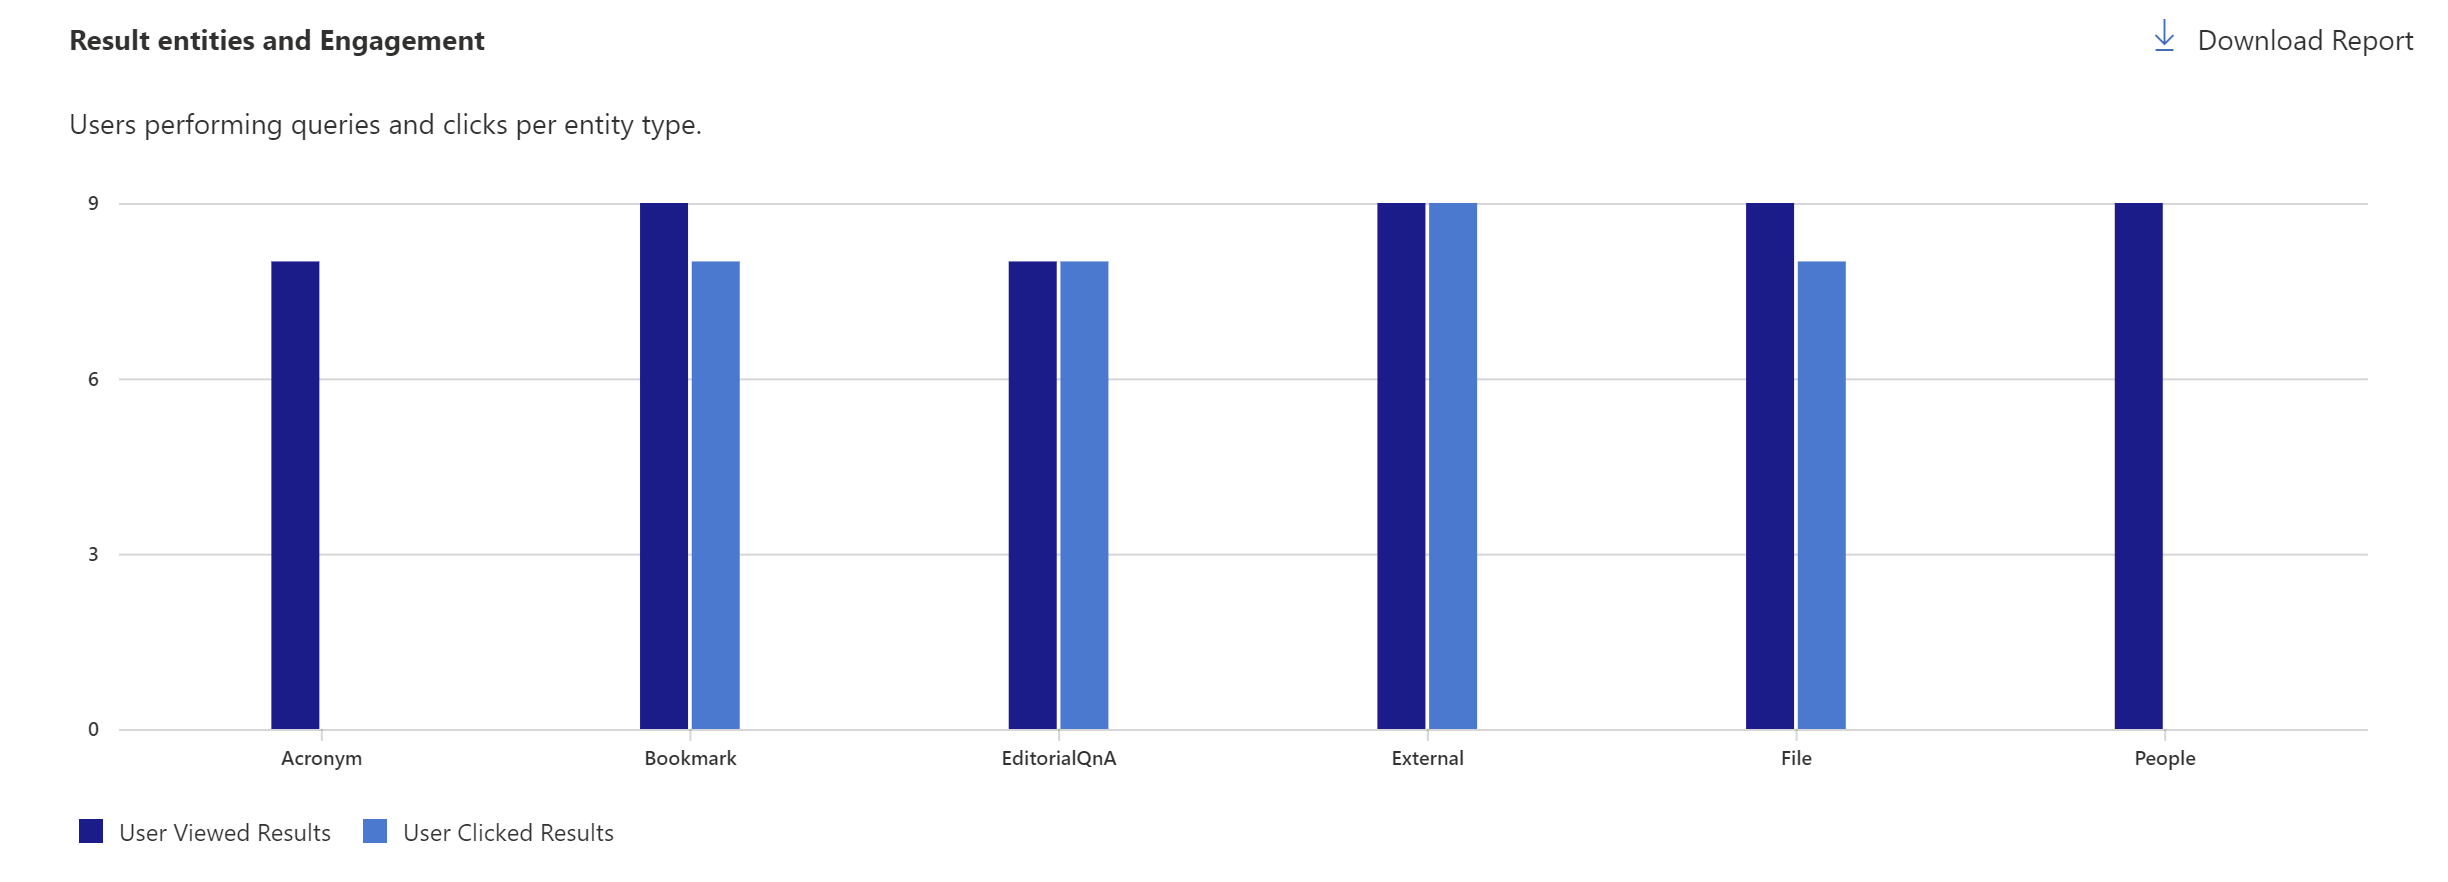
The data on top of the chart displays how often users engage with search results for each entity type. It lets you see the patterns of users who do queries and clicks for each entity type. Currently, it supports the following entity types:
- Acronym
- Bookmark
- EditorialQnA
- File
- People
- External (third-party connectors)
Query distribution
The query data is provided in four charts:
- Total queries by user action – Compares the number of queries with no results with the number of queries where a user clicked on a result or performed no action (abandoned).
- Total queries by country – Compares search queries by users in different countries based on a user’s country Microsoft Entra ID.
- Total queries by occupation – Compares the number of search queries by users in different occupations based on their title attribute in Microsoft Entra ID.
- Total queries by department or division – Compares the number of search queries by users in different departments or divisions in your organization. This is based on the department attribute of the second top-level user in the management chain of the user performing the search in Microsoft Entra ID.
Each chart shows the top five values, and the remaining values are summarized in the Others category. You can select the Download report link to download the report as an Excel file and see more details.
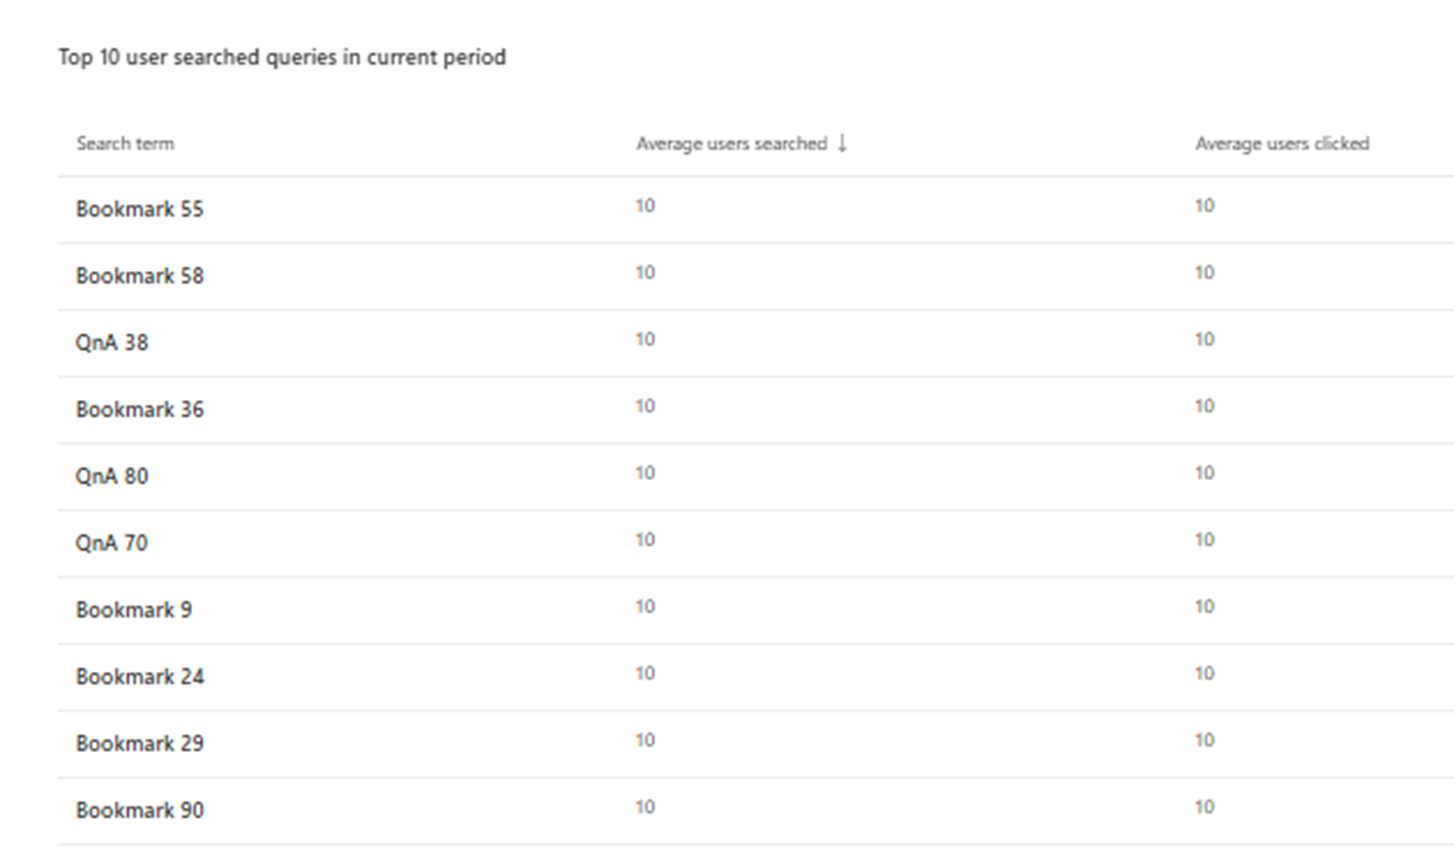
Top 10 user searched queries in current period
This report shows the top 10 most popular search queries. It shows the average users searched and clicked the search queries in the current period. Use this report to understand what types of information your users are searching for and the performance of the top 10 queries.
Query details page
The Query details page shows the frequency of search result engagement and identifies the user interactions with the top result for each query.
Each top search item provides the following data:
| Column | Description |
|---|---|
| Users searched | The number of users performed search |
| Search trend | The search trend compared with last period |
| Users clicked | The number of users performed click |
| Users with no clicks | The number of users performed no clicks |
| Users with no results | The number of users performed search that returned no results |
| Top clicked result | Top result clicked for this query |
| Result URL | URL of top search result |
| Type | The entity type of the top result (for example, file, bookmark, or external) |
| Clicked result | The number of times someone clicked on this search result |
| % of users clicked this | The percentage of users clicked the top search result |
Note
To protect privacy, if the selected filter combination results in queries that are performed by only five or fewer individuals, those results will not be included in any report.
When selecting a search term, a fly-out for the term is shown:
The flyout displays data for a particular search term across all Microsoft Search applications to help understand user behavior and top results for this query.
The following sections will show for each flyout:
- Top results for this query – This section shows top results for this query. If the top result has a low percentage of clicks, consider reviewing the content or setting up an answer like a bookmark for this query.
- Distribution by search application – Show search distribution of this query by different search applications.
- Distribution by country – Show search distribution of this query by different countries.
- Where on the result page did people click? – This graph shows where on the page people are clicking. Typically, people click on promoted items and initial results. Any other trend could indicate a less clear search result.
Download reports
Each report and table have a download option that allows you to download the background data for the report that you see on the screen in Excel format. Where the displayed report is limited to the top five to ten rows, the downloaded report will have up to 3,000 top records.
Downloading a report allows you to see reports from a broader range of time. The report is downloaded as an Excel spreadsheet based on the selected date filter. If you choose the past 28 days, the spreadsheet will have an individual tab for each day. The past 12 months download will have a tab for each month.
Note
New query analytics doesn't show Top 10 no-result queries and Top abandoned search terms, but you can still get these reports by switching to old query analytics.
Related articles
Microsoft Search Usage Report
Microsoft Search Usage Report - Users
Microsoft Search Usage Report - Connection analytics
Microsoft Search Usage Report - Answer analytics
View search usage reports in modern sites


