Finance and operations templates for process mining
If you're interested in analyzing your finance and operation process easily, onboard your data with templates in the process mining capability. Templates help you start mining your processes for insights by enabling you to connect to your system of record and surfacing contextual insights. You'll avoid the data identification and manipulation that's required with traditional process mining tools and reach process rich insights on analysis.
Accounts payable template
The accounts payable (AP) process tracks the process from receiving an invoice to paying it out. Between these two steps, there are countless variants that can occur based on compliance, automation, and industry. The Accounts payable template enables SAP users to extract data from their SAP system and visualize their AP process with minimal to no data manipulation required.
Prerequisites
Connecting and defining the Accounts payable template will require IT and admin support.
The Accounts payable template requires connection to SAP through:
For the template ingestion to work, the required tables must be found in the database (copy or original) with the original table name:
| Table | Description |
|---|---|
| BKPF | Accounting document header |
| BSEG | Accounting document |
| CDHDR | Change document header |
| CDPOS | Change document items |
Create and run the Accounts payable template
To see the available templates, select Process mining on the left.
Under the Start with a popular template heading, select the Finance & Operations tab, and then select Accounts payable.
Select a connection type from the three connection types available (SQL database, Oracle database, and OData service).
If you're selecting SQL database, enter the Process name, Server Name, Database Name, and Schema Name.
To learn more, go to SQL Server.
(Optional) To improve the analyze time of the report, refine data by defining Start Date, End Date, Client, and Company Code.
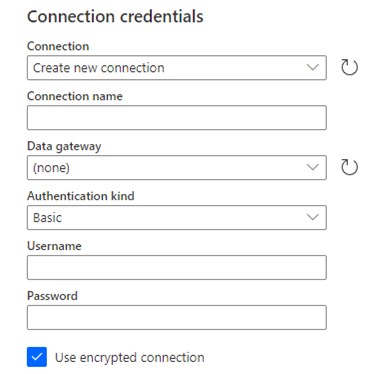
Once you're on the connection page, fill out credential information and select Next
To learn more about the fields, go to Connect to SQL Server database from Power Query Online.
Once the connection is complete, your process will be analyzed. You can change screens at any time during the analysis.
Once the analysis is done, you can view your process report.
Procure to pay (P2P) template
The procure to pay (P2P) process begins at purchase requisition. Then, it flows to the creation of a purchase order before closing out an invoice payment. It's a complex process that organizations use to ensure compliant spend and fiscal responsibility. The Procure to pay template enables SAP users to extract data from their SAP system and visualize their P2P process with minimal to no data manipulation required. This template allows you to find areas for potential efficiencies and automation.
Prerequisites
Connecting and defining the P2P template will require IT and admin support.
The P2P Template requires connection to SAP through:
For the template ingestion to work, the required tables must be found in the database (copy or original) with the original table name:
| Table | Description |
|---|---|
| BKPF | Accounting Document Header |
| BSEG | Accounting Document |
| CDHDR | Change Document Header |
| CDPOS | Change Document Items |
| EKKO | Purchasing Document Header |
| EKPO | Purchasing Document Items |
| EKBE | History per Purchasing Document |
| EBAN | Purchase Requisition |
| USR02 | Logon Data |
| RSEG | Document item; Incoming Invoice |
| T008T | Blocking Reason Names |
| NAST | Message Status |
| DD07T | DD: Texts for Domain Fixed Values |
| T001 | Company Codes |
| T024E | Purchasing Organizations |
| T024 | Purchasing Groups |
| TCURR | Exchange Rates data |
| TCURX | Decimal places in currency |
| LFA1 | Vendor Master |
| MAKT | Material Master |
| T023T | Material Group Descriptions |
| EKET | Scheduling Agreement Schedule Lines |
Create and run the Procure to pay (P2P) template
To see the available templates, select Process mining on the left.
Under the Start with a popular template heading, select the Finance & Operations tab, and then select Procure to pay (P2P).
To complete creating and running the P2P template, perform the steps in Create and run the Accounts payable template in this article starting with step 2.
Read your custom report
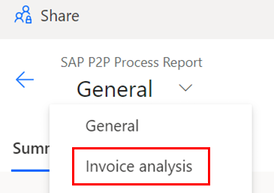
Once the analysis is done, there will be a custom report to visualize your P2P process. The first page will have an end-to-end view of the PP2P process. By selecting the caret, you can navigate to the Invoice analysis report for a deeper understanding of your invoice process.
Visualizations and KPIs
P2P templates have additional KPIs and visualizations built on top of the standard report. To learn more about the process map and filters, go to Visualize and gain insights from processes.
PO items: The PO line item is the Case ID for this report. Every unique PO line item is represented as a case.
PO value: Aggregate value of PO line items.
Net order value normalized: PO value normalized to USD currency based on the latest conversion rate obtained from the currency table from the SAP system.
Spend by company code: PO line item spend aggregated by company code.
Top vendors: PO line item spend aggregated by the vendor.
Purchase order items and value by month: X axis represents months. Y1 axis represents whole number of PO items (bar graph). Y2 axis represents value of PO items (line graph).
Invoice value: Aggregate value of unique invoices.
Invoices: Count of unique invoices in your process.
Average payment term: Based on invoice payment term, the average days given by vendors to complete payment.
Average cycle time: Based on process, the average time it takes organization to pay out or complete invoices.
Discount realization rate: Total discount taken based on invoice payment date divided by total discount available to organization.
Discount availability: Total available discount to the organization.
Paid on time rate: Invoices paid on or before due date divided by total number of invoices.
Paid on time: X axis represents months. Y1 axis represents whole number of invoices (bar graph). Y2 axis represents paid on time rate (line graph).
Invoice Value: X axis represents months. Y1 axis represents whole number of invoices (bar graph). Y2 axis represents paid on time rate (line graph).
Customization and issue handling
Templates are composed of a data flow and a report. Like a process created from Start from Blank, both the data flow and the report can be customized and changed. To learn more, go to the following topics:
Feedback
Coming soon: Throughout 2024 we will be phasing out GitHub Issues as the feedback mechanism for content and replacing it with a new feedback system. For more information see: https://aka.ms/ContentUserFeedback.
Submit and view feedback for