Change how a chart is sorted in a Power BI report
APPLIES TO: ![]() Power BI service for business users
Power BI service for business users ![]() Power BI service for designers & developers
Power BI service for designers & developers ![]() Power BI Desktop
Power BI Desktop ![]() Requires Pro or Premium license
Requires Pro or Premium license
Important
This article is for Power BI service users who don't have edit permissions for a report or semantic model. If you're a report designer, administrator, or owner, see Sort one column by another column in Power BI for information that is more relevant to you.
In the Power BI service, you can highlight important information in a visual by sorting data fields. Some fields contain numeric data (such as sales figures) and some contain text data (such as state names). After you sort a visual, you can save a personalized version of your changes. The Power BI service provides flexibility and quick menus that allow you to efficiently sort your visuals.
In a Power BI report, you can sort most visuals by one, and sometimes two fields. But some visuals can't be sorted, like treemaps, filled maps, scatter charts, gauge charts, waterfall charts, cards, and visuals on a dashboard.
Get started
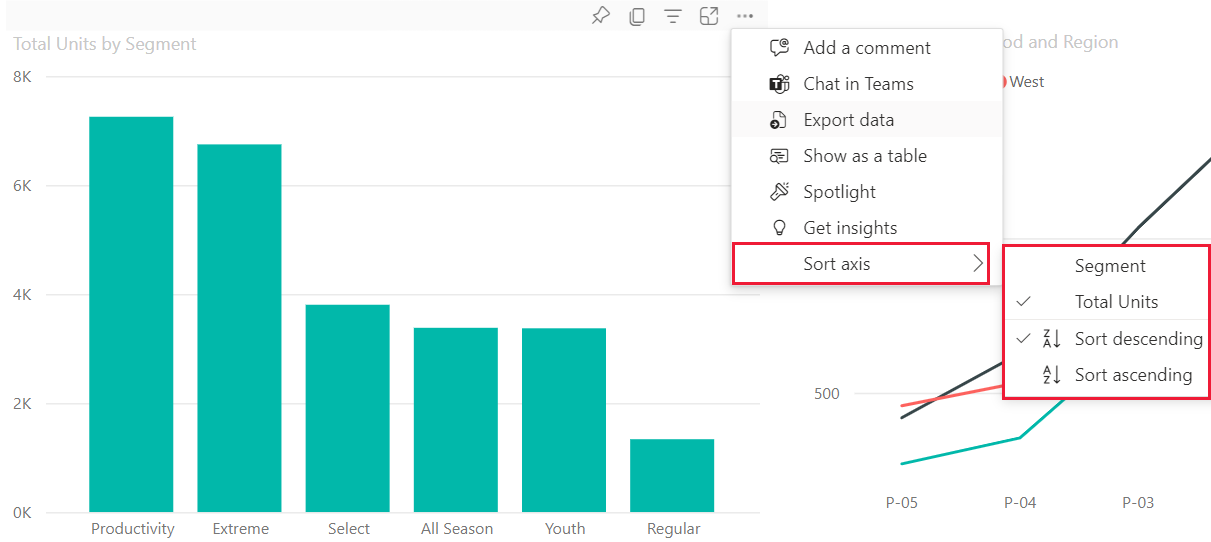
To choose a sorting option, open any report that you created or that is shared with you. Select a visual that can be sorted, and choose More options (...). Depending on the type of visual, the sorting options are Sort descending, Sort ascending, Sort by, and Sort axis.
Sort alphabetically or numerically
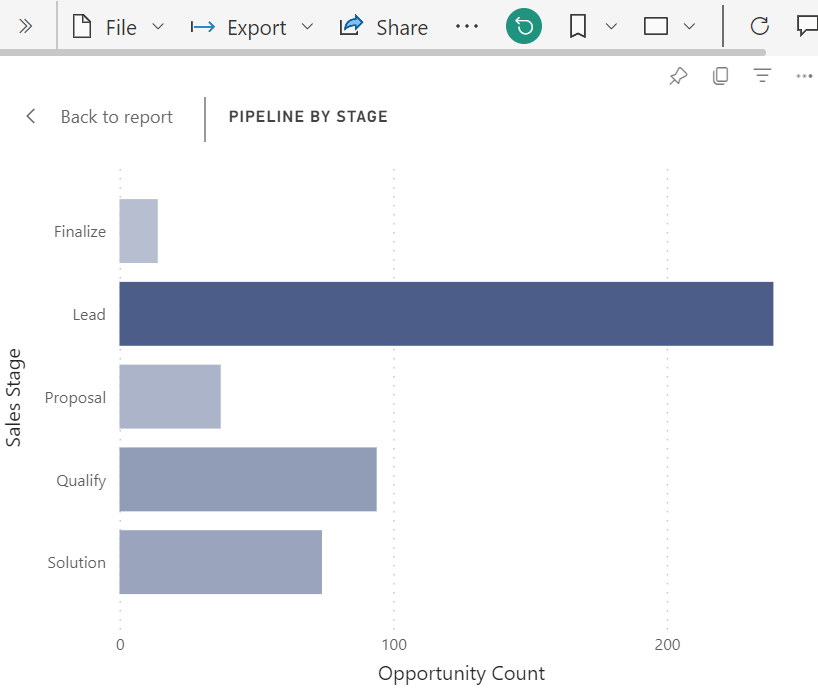
Visuals can be sorted alphabetically or numerically. If the content is text, sort alphabetically from Z to A. If the content is numbers, sort low to high. For example, in this chart's Y-axis, the Sales Stage text and is sorted alphabetically A to Z.
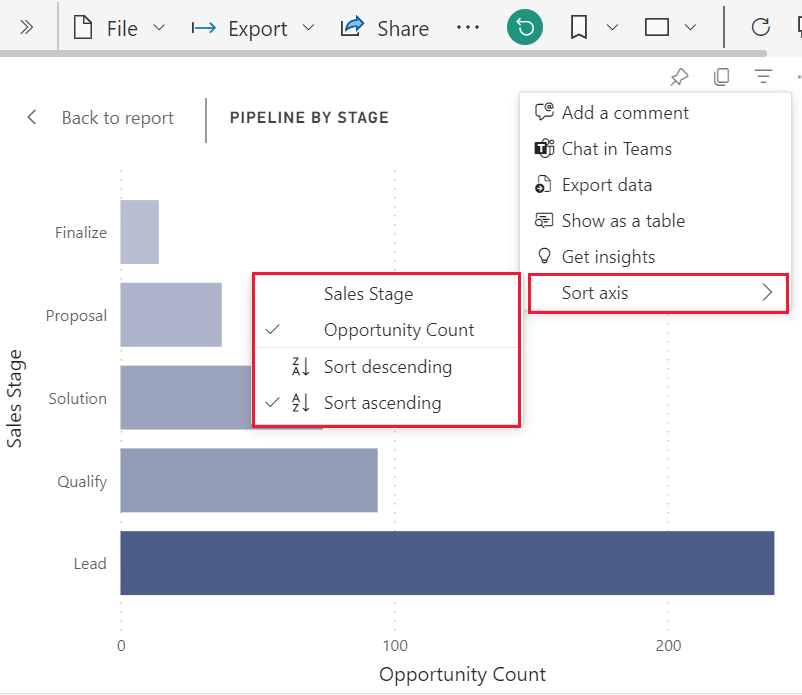
To change the sort order, select either Sort ascending or Sort descending. The following example shows the visual sorted by Opportunity Count in ascending order. The field and order that are sorted are indicated with a checkmark.
Sort by multiple columns
Certain types of visualizations can be sorted by more than one column. The order you select the columns determines sort priority.
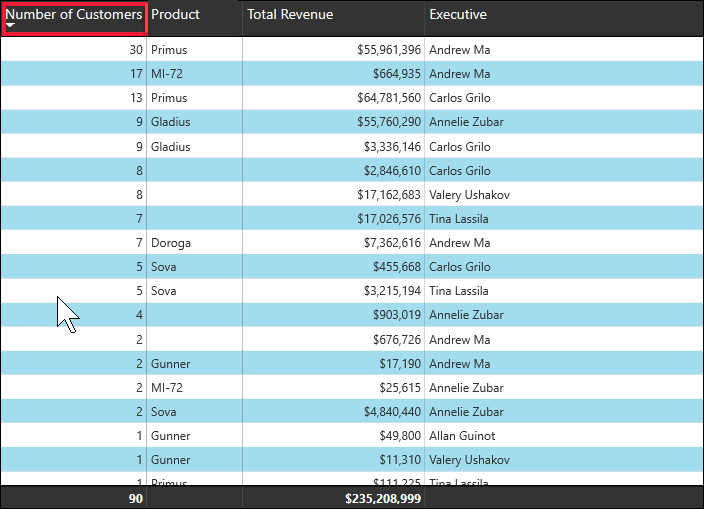
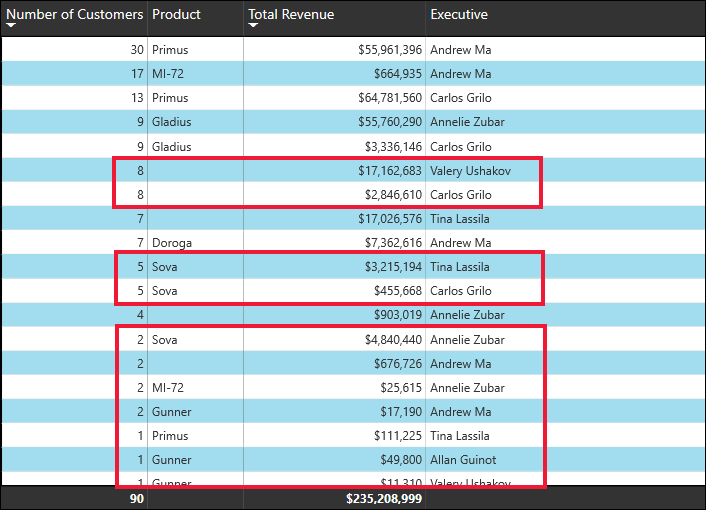
The data in this table is sorted by Number of customers. The small arrow in the column header indicates that the column is sorted. The arrow points down because the column is sorted in descending order.
You can sort multiple columns to create a sorting sequence. To add more columns to the sort order, select the Shift key while also selecting the column header you would like to add next in the sort order. For example, if you select Number of customers and then select Shift and Total revenue, then the table is sorted first by customers, then by revenue. The red outlines show areas where the sort order changed.
If you select Shift and then select the same column a second time, the sort direction (ascending or descending) is changed. If you select Shift and select a column you previously added to the sort order, that column moves to the back of the sort order.
Save your sort order changes
Power BI reports retain the filters, slicers, sorting, and other data view changes that you make, even if you're working in Reading view. So, if you navigate away from a report, and return later, your sorting changes are saved. To revert your changes back to the report designer's settings, select Reset to default from the top menu on the report page.

The report designer can prevent changes from being saved. If they do, the Reset to default button is greyed out.
You can also save your changes with bookmarks, if the report designer enables the Personalize visual feature for the report. You can change the sort order of a visual and save it as a bookmark. If you see the personalize visual icon ![]() in the visual's header, this feature is enabled. You don't need edit permissions to use this feature.
in the visual's header, this feature is enabled. You don't need edit permissions to use this feature.
For more information, see Personalize visuals in a report.
Sort by other criteria
Sometimes you want to sort your data by using a field that isn't included in the visual. For example, you might want to sort by month in sequential order (and not in alphabetical order) or you might want to sort by entire numbers instead of by digit (example, 0, 1, 9, 20 and not 0, 1, 20, 9).
To learn how to sort by a different field in the semantic model, see Sort one column by another column in Power BI. To use this feature, you must have edit permissions for the report.
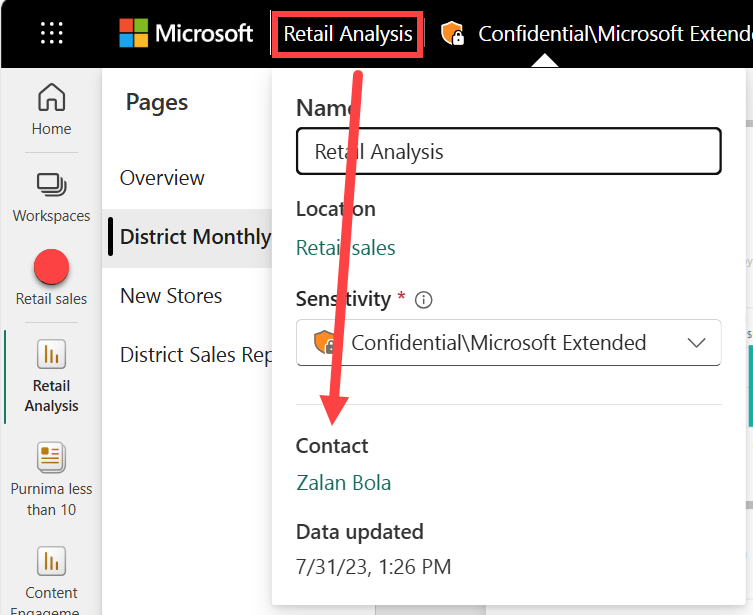
Ask the report designer to create new columns in the semantic model to address sorting issues. The designer's contact information is listed in the report title's menu.
Related content
Feedback
Coming soon: Throughout 2024 we will be phasing out GitHub Issues as the feedback mechanism for content and replacing it with a new feedback system. For more information see: https://aka.ms/ContentUserFeedback.
Submit and view feedback for