Change settings for Power BI reports
APPLIES TO:
Power BI Desktop
Power BI service
With the report settings in Power BI Desktop and the Power BI service, you can control how report readers interact with your report. For example, you can allow them to save filters for the report, personalize the visuals in the report, or display the report pages as tabs across the bottom of the report instead of along the side.

It might be helpful to first read:
- Create a report from an Excel file in the Power BI service, to understand the report creation experience.
- Reports in Power BI, to understand your report readers' experience.
Prerequisites
- For creating reports using Power BI Desktop, see Work with Report view in Power BI Desktop.
- You must Sign up for the Power BI service.
- You need to have edit permission for the report in the Power BI service. See Roles in workspaces in Power BI for details on permission.
- If you don't already have a report in the Power BI service, you can install a sample containing a dashboard, report, and semantic model.
Open the Settings pane
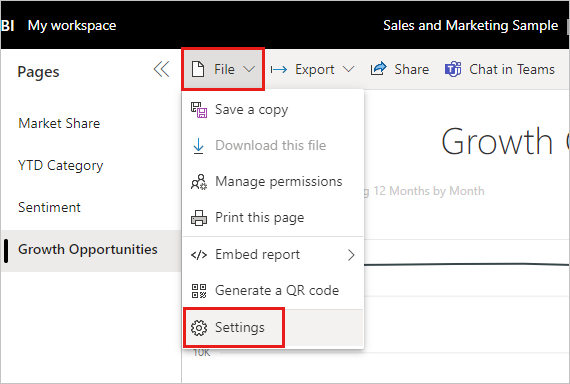
- Select File > Options and settings > Options.
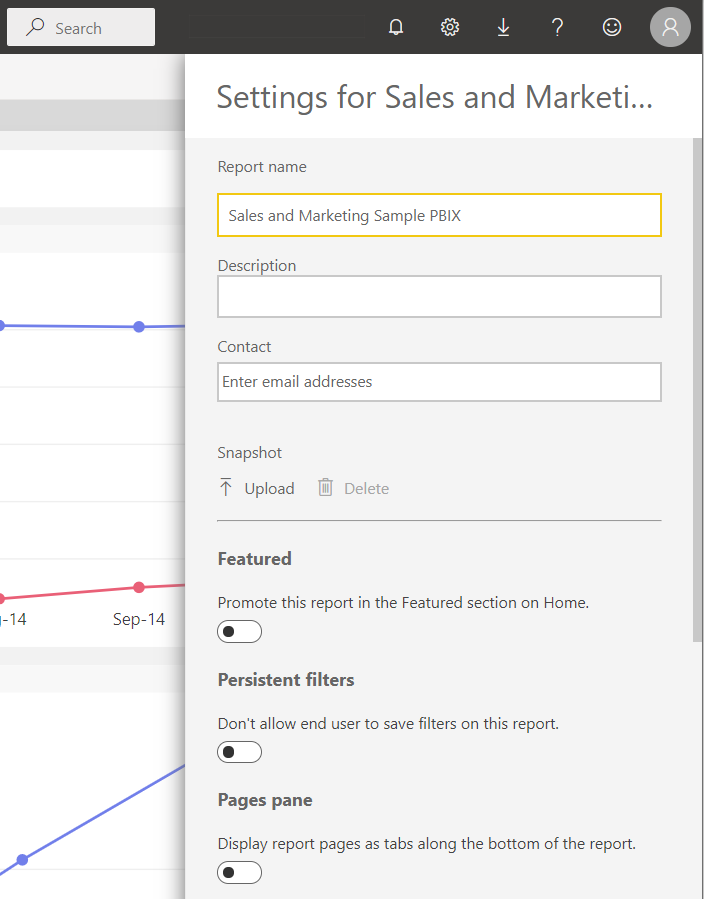
Under Current file, select Report settings. In the Settings pane, you see many toggles you can set for this report.
The rest of this article calls out some of the specific report settings.
Set featured content
You can feature dashboards, reports, and apps so they appear in the Featured section of your colleagues' Power BI Home page. For more information, see Feature recommended content on colleagues' Power BI Home page.
Set the Pages pane
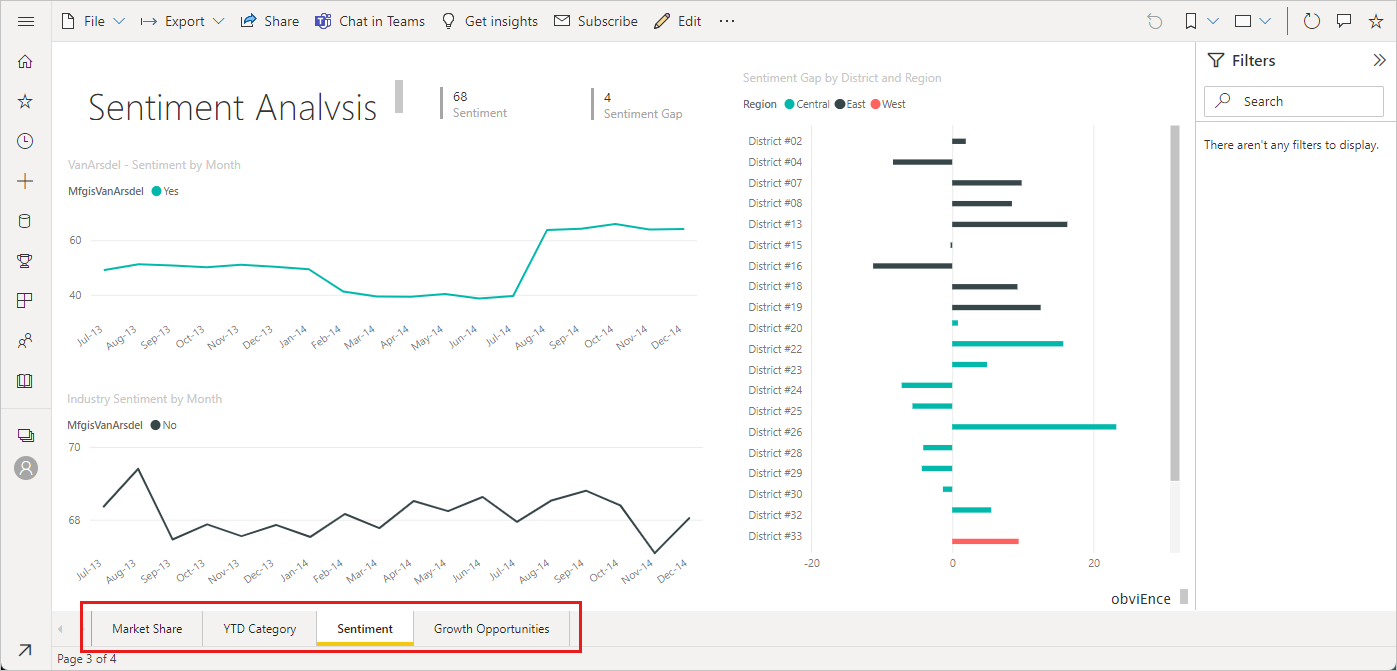
Currently, you can only change the Pages pane setting in the Power BI service. When you toggle Pages pane on, report readers see the report page tabs along the bottom of the report in Reading view instead of along the side. In Edit view, the report page tabs are already along the bottom of the report.
Control filters
The report Settings pane has three settings for controlling reader interactions with the filters on your report. The following links go to the Format filters in Power BI reports article for details on each setting.
Persistent filters allow readers to save filters on the report.
Filtering experience has two more settings:
Allow report readers to change filter types.
Enable search in the filter pane.
Export data
By default, report readers can export summarized or underlying data from visuals in your report. With Export data, you can allow them to export only summarized data or to export no data at all from your report.
Personalize visuals
Allow your readers to change and personalize the visuals in your report. For more information, see Let users personalize visuals in a report.
Related content
- Feature recommended content on colleagues' Power BI Home page
- Let users personalize visuals in a report
More questions? Ask the Power BI Community.


