Create a (new) Card visual in Power BI
APPLIES TO: ![]() Power BI Desktop
Power BI Desktop ![]() Power BI service
Power BI service
The (new) Card visual in Power BI is a versatile tool for presenting key metrics in a visually appealing format. Each card can display a specific metric, such as total sales or profit growth, and can be customized to reflect your objectives and key results (OKRs). This flexibility allows users to group multiple cards within a single container, providing full control over every component of each card, and a comprehensive overview of important data points at a glance.
The (new) Card visual is useful in business and finance for showcasing critical performance indicators, as well as in marketing for highlighting metrics like customer engagement and conversion rates. With its sleek design and enhanced functionality, the (new) Card visual enables users to interact with their data more effectively and make informed decisions based on real-time insights.
Important
The (new) Card visual is currently in preview and only available for Power BI Desktop. This information relates to a prerelease product that may be substantially modified before it's released. Microsoft makes no warranties, expressed or implied, with respect to the information provided here.
Prerequisites
- Always make sure you have the latest version of Power BI Desktop installed before proceeding.
For the purposes of this article, in Power BI Desktop Global options, under the Preview features section, the New card visual feature is enabled. The New card visual is turned on by default to encourage users to try it out and provide feedback.
You can ensure it's checked to enable the feature by completing the following steps:
- Open Power BI Desktop.
- On the File menu, select Options.
- In the Global options window, go to the Preview features section.
- Look for the New card visual option to ensure it’s selected or enabled.
- For the purposes of this guide, in Power BI Desktop's Global options, under the Preview features section, the On-object interaction feature is not enabled.
In the following guide, we're using the Retail Analysis Sample PBIX file. After downloading the file, let's get started:
Launch Power BI Desktop.
On the left-side navigation pane, select Open, otherwise on the top-left of the window, select File > Open.
Locate and select your copy of the Retail Analysis Sample PBIX file. The file will open in report view, ready for you to begin.
Select the + icon at the bottom of the window to add a new page to the report.

Note
Sharing your report with a Power BI colleague requires that you both have an individual Power BI Pro license or that you have saved the report in Premium capacity. Keep in mind that the (new) card visual applies only to Power BI Desktop and isn’t available in Power BI service.
Let's create (new) Card visual
There are three similar ways to create a (new) Card visual:
- Start from the Insert ribbon, and select New visual, then select the (new) Card visual icon from the Visualizations pane, or
- Start from the Visualizations pane, and select the (new) Card visual icon, or lastly,
- Expand the Data pane, and select the necessary data fields, and then select the (new) Card visual icon from the Visualizations pane.
For this quick three-step guide, let's use the first option:
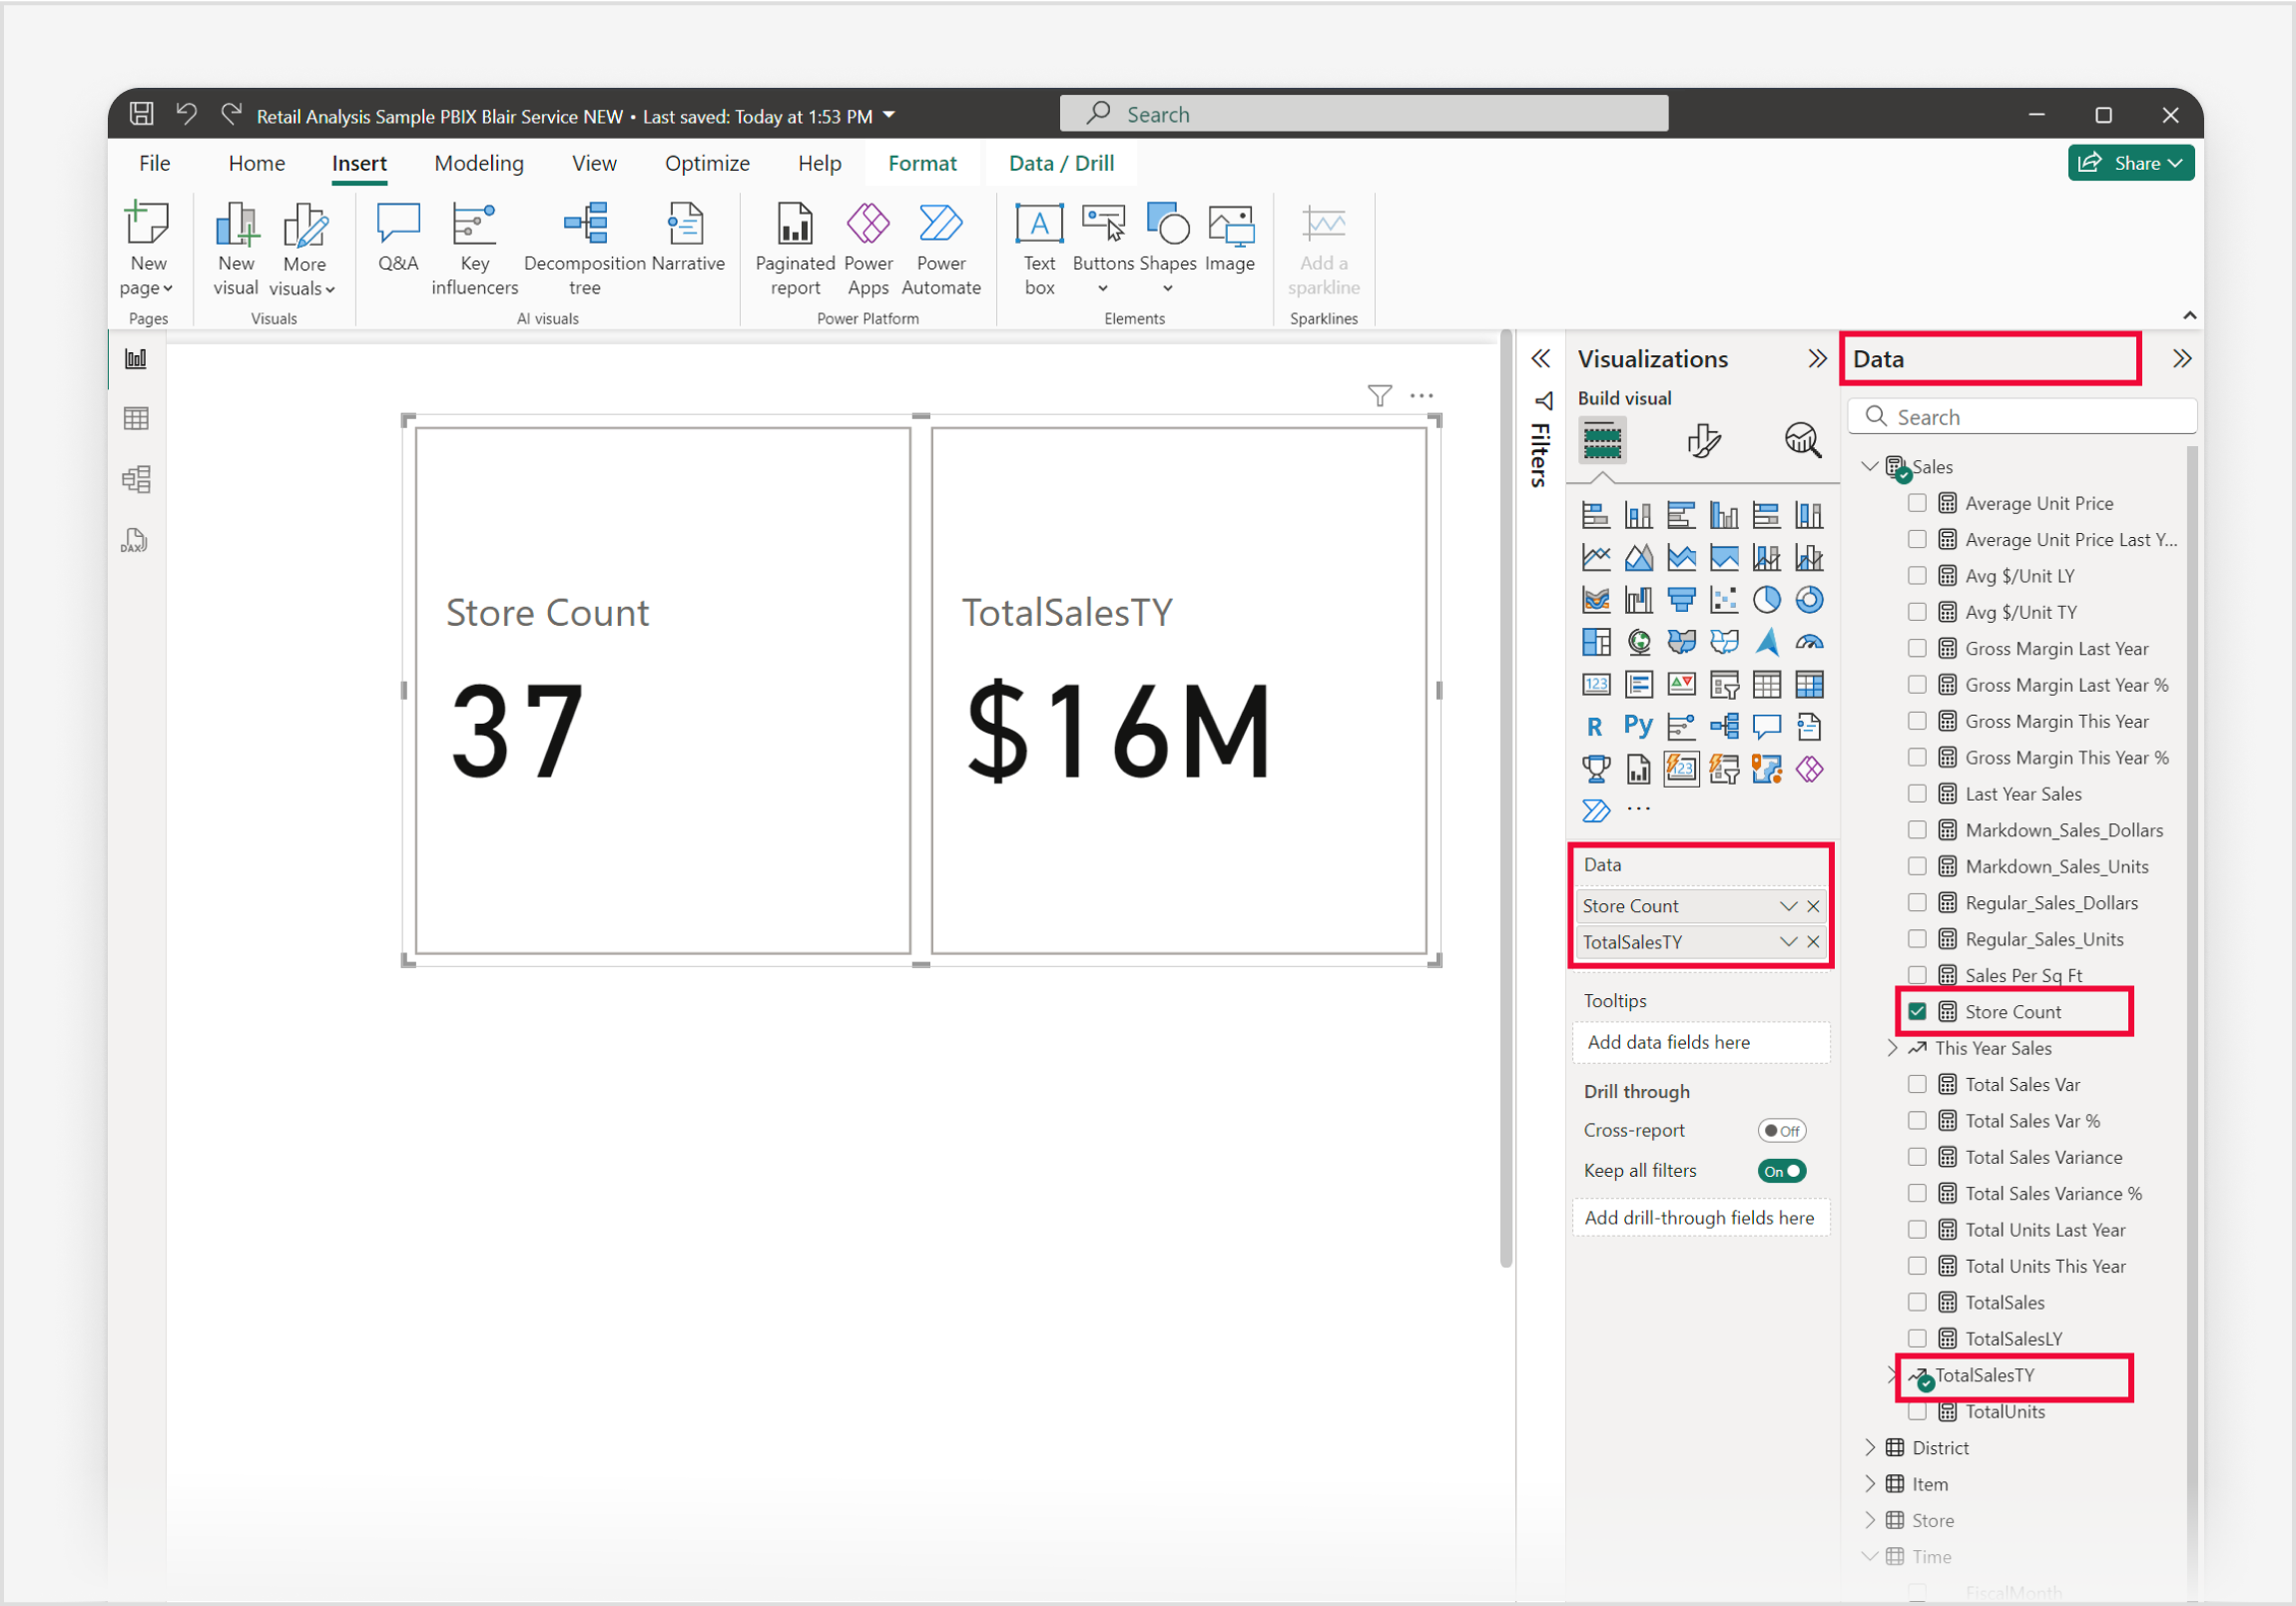
In the Insert ribbon, select New visual. When the visual placeholder appears on the report canvas, expand the Visualizations pane and select the (new) Card visual icon in the Build visual menu.

To add data to the visual, let’s use the Data pane in this example. Adding data can be done by selecting each field in the Data pane, or dragging the fields to the field wells on the Visualizations pane, or dragging the fields directly to the visual placeholder in the report canvas. Expand the Sales group, to add StoreCount, then expand the TotalSalesTY subgroup, and add Value. You'll notice that each data field you add is displayed as its own card.
To customize your column chart, select the Format visual icon in the Visualizations pane, granting you access to all available settings. This allows you to tailor the chart's appearance and functionality to your specific requirements as shown in the example.
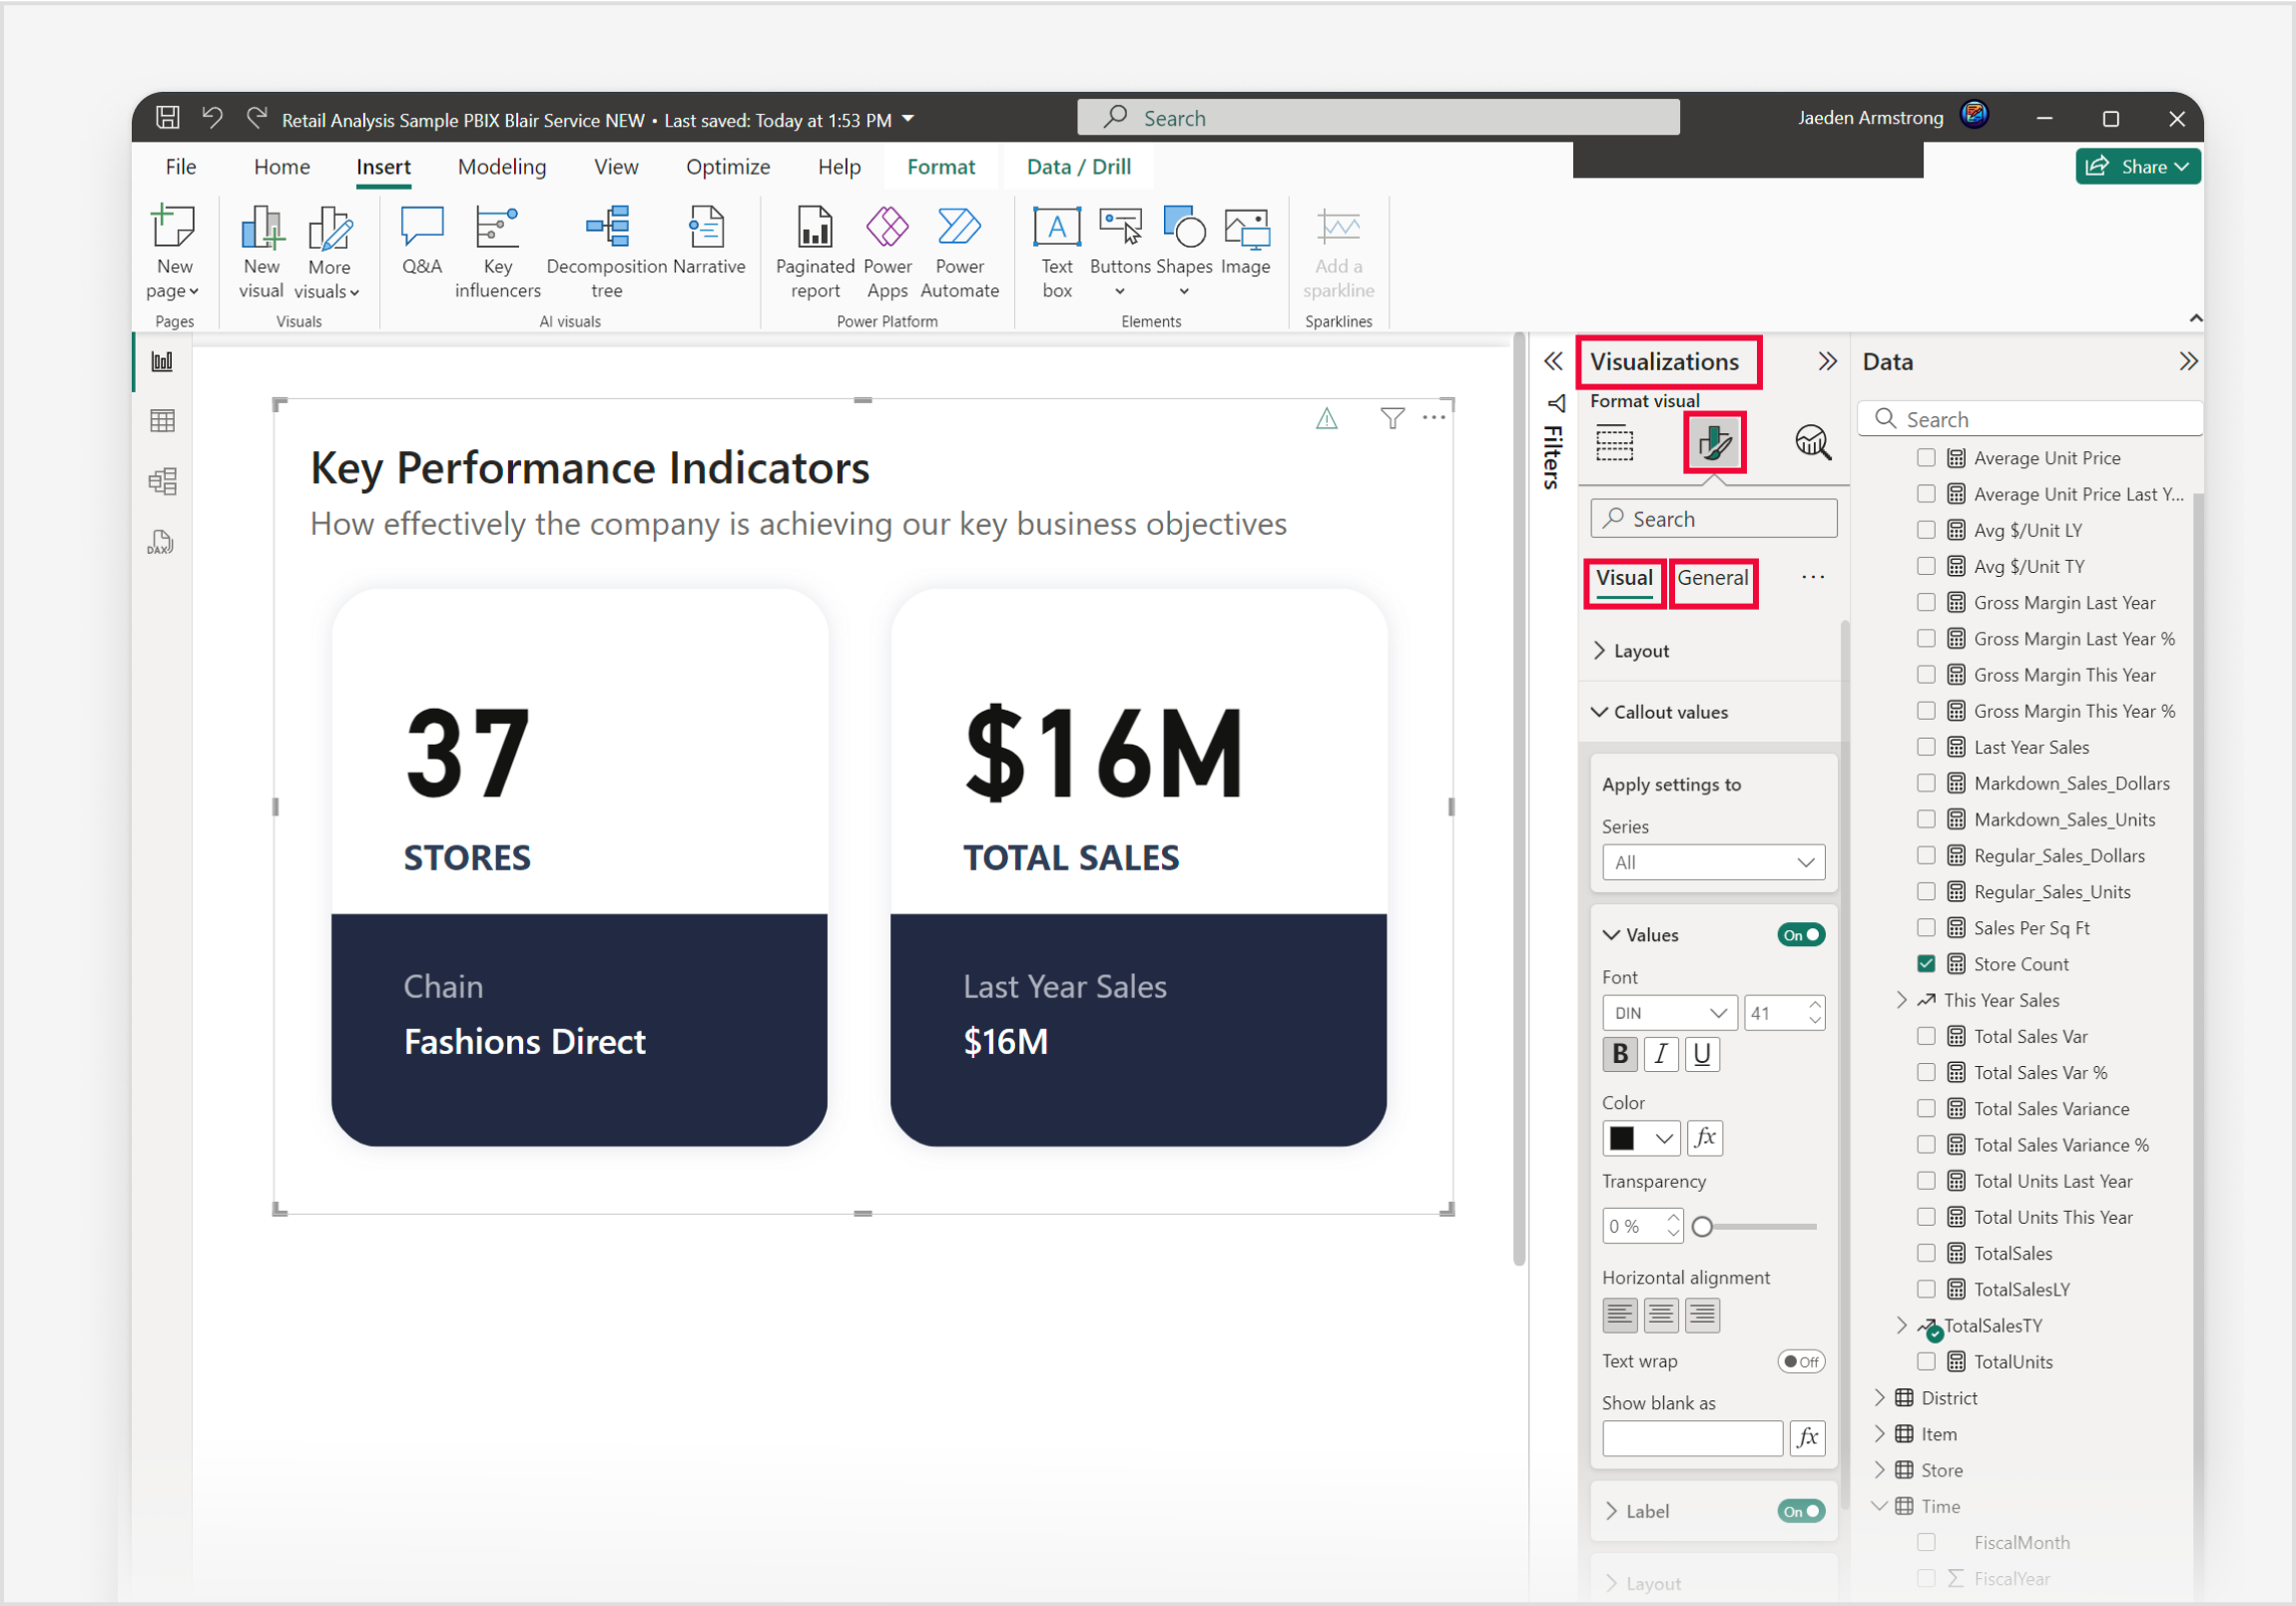


Congratulations! You've successfully created a (new) card visual with Power BI Desktop.
(power-bi-visualization-card-visual-new-format-settings.md) and controls for you to use as reference. Also, take time to familiarize yourself with the Considerations and limitations for (new) card visuals.