Grouping or summarizing rows
In Power Query, you can group values in various rows into a single value by grouping the rows according to the values in one or more columns. You can choose from two types of grouping operations:
Column groupings.
Row groupings.
For this tutorial, you're using the following sample table.
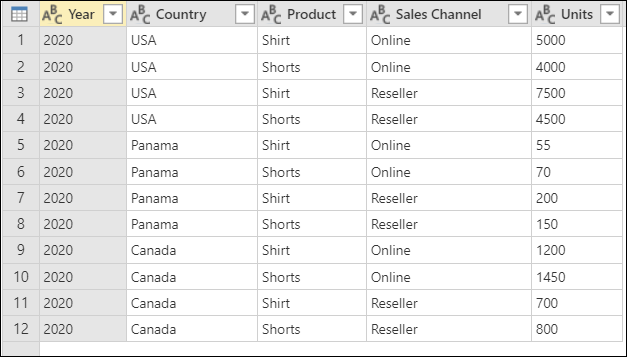
Screenshot of a table with columns showing Year (2020), Country (USA, Panama, or Canada), Product (Shirt or Shorts), Sales channel (Online or Reseller), and Units (various values from 55 to 7500)
Where to find the Group by button
You can find the Group by button in three places:
On the Home tab, in the Transform group.
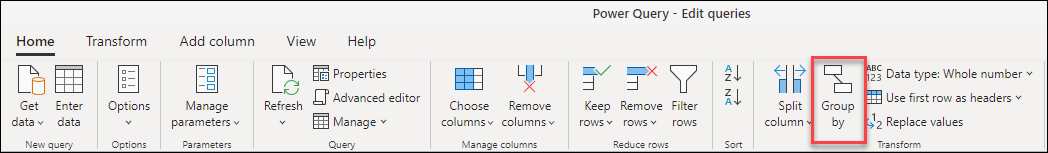
On the Transform tab, in the Table group.
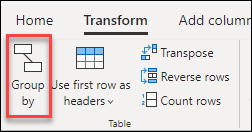
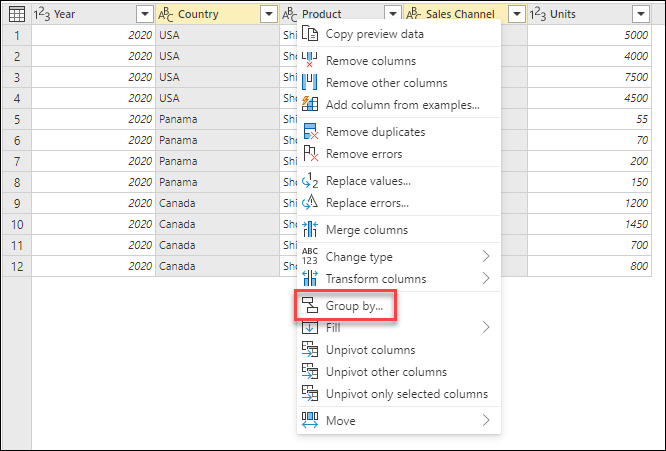
On the shortcut menu, when you right-click to select columns.
Use an aggregate function to group by one or more columns
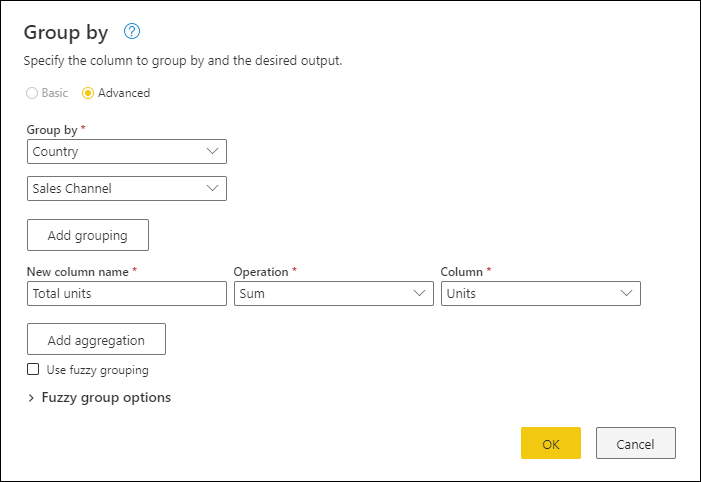
In this example, your goal is to summarize the total units sold at the country and sales channel level. You use the Country and Sales Channel columns to perform the group by operation.
- Select Group by on the Home tab.
- Select the Advanced option, so you can select multiple columns to group by.
- Select the Country column.
- Select Add grouping.
- Select the Sales Channel column.
- In New column name, enter Total units, in Operation, select Sum, and in Column, select Units.
- Select OK
This operation gives you the following table.

Operations available
With the Group by feature, the available operations can be categorized in two ways:
- Row level operation
- Column level operation
The following table describes each of these operations.
| Operation Name | Category | Description |
|---|---|---|
| Sum | Column operation | Sums up all values from a column |
| Average | Column operation | Calculates the average value from a column |
| Median | Column operation | Calculates the median from a column |
| Min | Column operation | Calculates the minimum value from a column |
| Max | Column operation | Calculates the maximum value from a column |
| Percentile | Column operation | Calculates the percentile, using an input value from 0 to 100, from a column |
| Count distinct values | Column operation | Calculates the number of distinct values from a column |
| Count rows | Row operation | Calculates the total number of rows from a given group |
| Count distinct rows | Row operation | Calculates the number of distinct rows from a given group |
| All rows | Row operation | Outputs all grouped rows in a table value with no aggregations |
Note
The Count distinct values and Percentile operations are only available in Power Query Online.
Perform an operation to group by one or more columns
Starting from the original sample, in this example you create a column containing the total units and two other columns that give you the name and units sold for the top-performing product, summarized at the country and sales channel level.
Use the following columns as Group by columns:
- Country
- Sales Channel
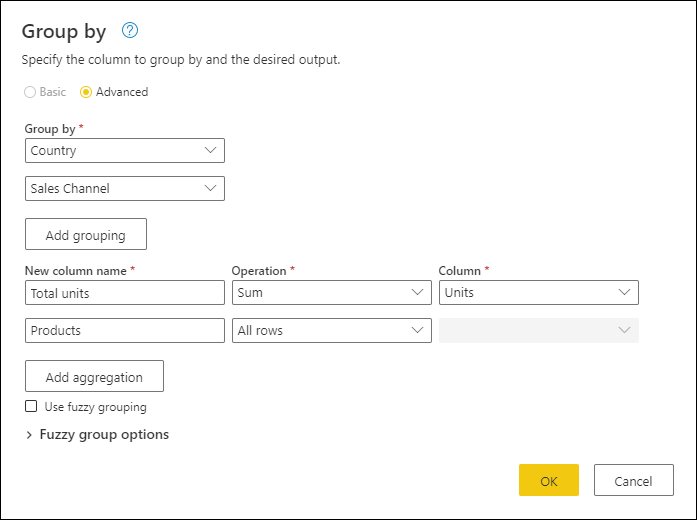
Create two new columns by following these steps:
- Aggregate the Units column by using the Sum operation. Name this column Total units.
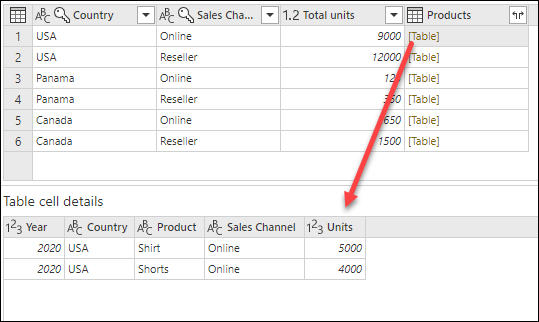
- Add a new Products column by using the All rows operation.
After that operation is complete, notice how the Products column has [Table] values inside each cell. Each [Table] value contains all the rows that were grouped by the Country and Sales Channel columns from your original table. You can select the white space inside the cell to see a preview of the contents of the table at the bottom of the dialog.
Note
The details preview pane might not show all the rows that were used for the group-by operation. You can select the [Table] value to see all rows pertaining to the corresponding group-by operation.
Next, you need to extract the row that has the highest value in the Units column of the tables inside the new Products column, and call that new column Top performer product.
Extract the top performer product information
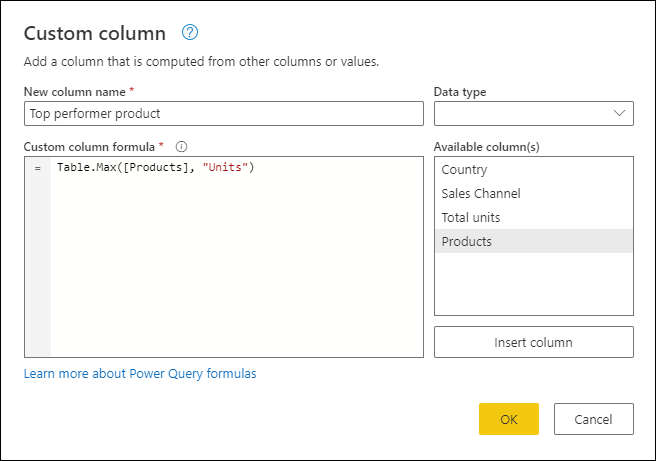
With the new Products column with [Table] values, you create a new custom column by going to the Add Column tab on the ribbon and selecting Custom column from the General group.
![]()
Name your new column Top performer product. Enter the formula Table.Max([Products], "Units" ) under Custom column formula.
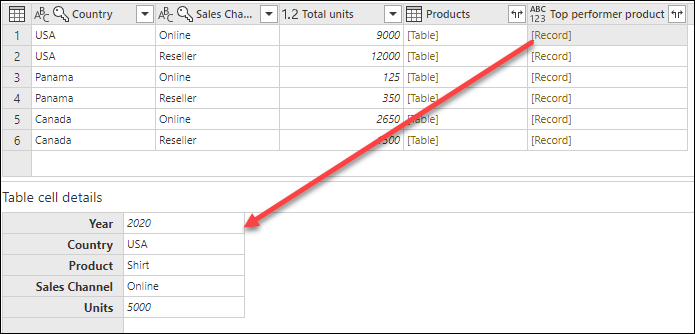
The result of that formula creates a new column with [Record] values. These record values are essentially a table with just one row. These records contain the row with the maximum value for the Units column of each [Table] value in the Products column.
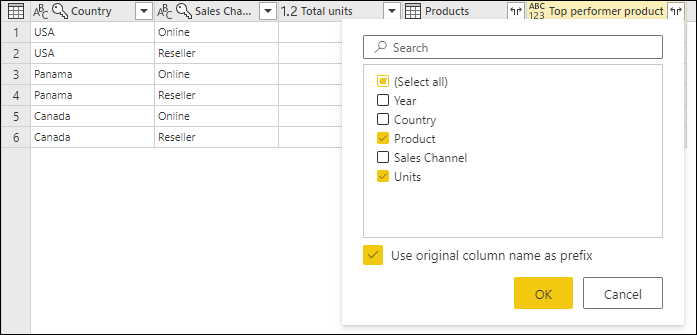
With this new Top performer product column that contains [Record] values, you can select the ![]() expand icon, select the Product and Units fields, and then select OK.
expand icon, select the Product and Units fields, and then select OK.
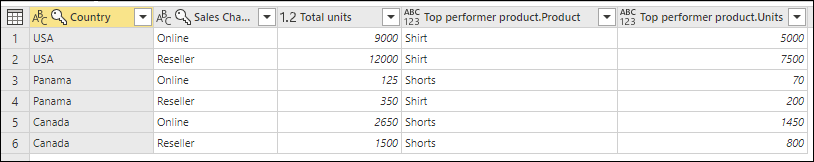
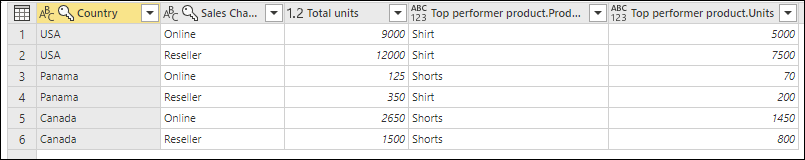
After you remove your Products column and setting the data type for both newly expanded columns, your result will resemble the following image.
Fuzzy grouping
Note
The following feature is only available in Power Query Online.
To demonstrate how to do "fuzzy grouping," consider the sample table shown in the following image.
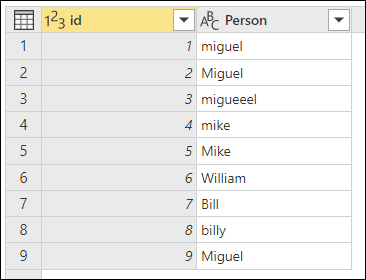
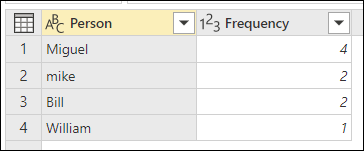
The goal of fuzzy grouping is to do a group-by operation that uses an approximate match algorithm for text strings. Power Query uses the Jaccard similarity algorithm to measure the similarity between pairs of instances. Then it applies agglomerative hierarchical clustering to group instances together. The following image shows the output that you expect, where the table is grouped by the Person column.

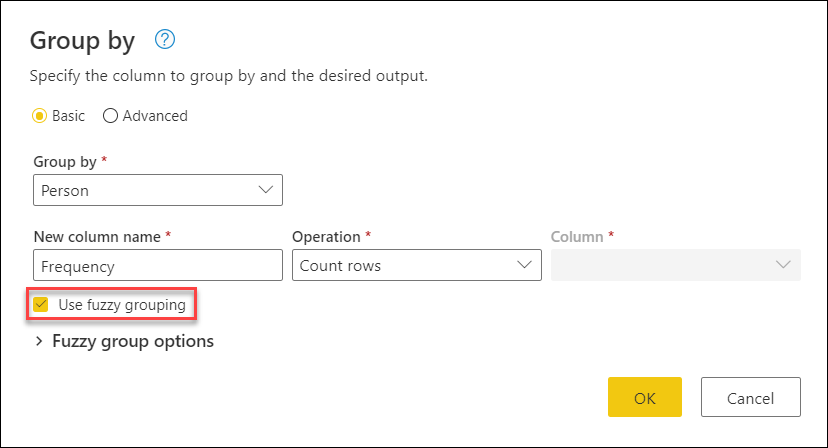
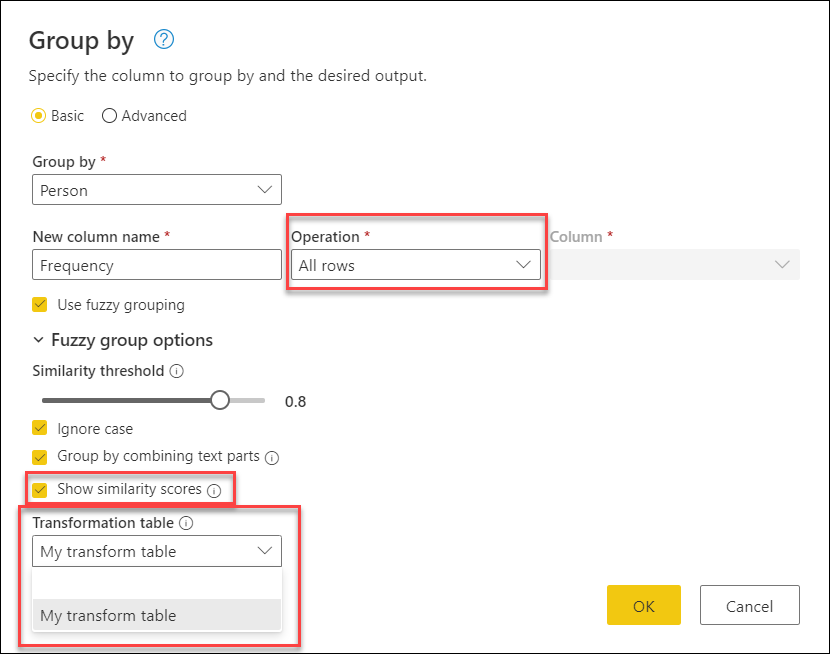
To do the fuzzy grouping, you perform the same steps previously described in this article. The only difference is that this time, in the Group by dialog box, you select the Use fuzzy grouping check box.
For each group of rows, Power Query picks the most frequent instance as the "canonical" instance. If multiple instances occur with the same frequency, Power Query picks the first one. After you select OK in the Group by dialog box, you'll get the result that you were expecting.
However, you have more control over the fuzzy grouping operation by expanding Fuzzy group options.
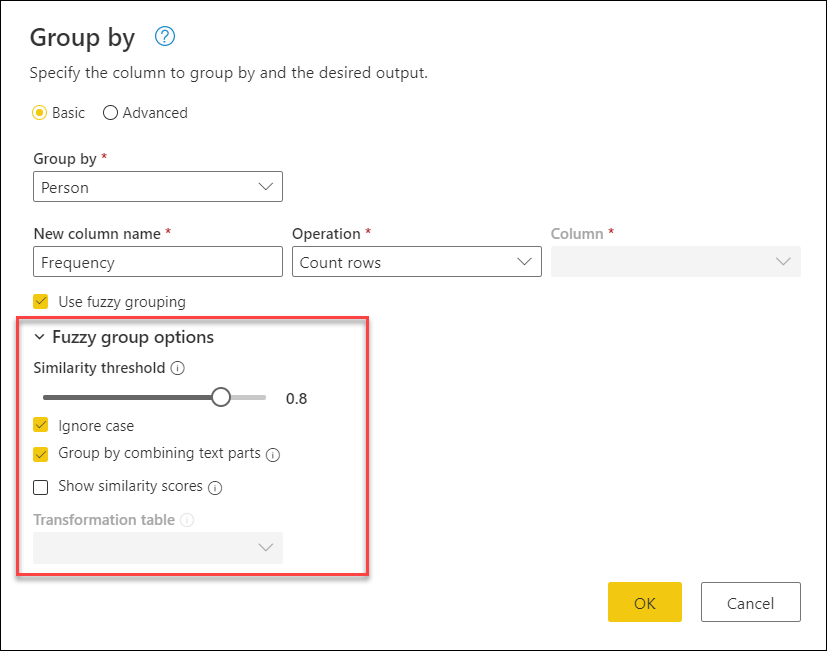
The following options are available for fuzzy grouping:
- Similarity threshold (optional): This option indicates how similar two values must be to be grouped together. The minimum setting of zero (0) causes all values to be grouped together. The maximum setting of 1 only allows values that match exactly to be grouped together. The default is 0.8.
- Ignore case: When text strings are compared, case is ignored. This option is enabled by default.
- Group by combining text parts: The algorithm tries to combine text parts (such as combining Micro and soft into Microsoft) to group values.
- Show similarity scores: Show similarity scores between the input values and the computed representative values after fuzzy grouping. Requires the addition of an operation such as All rows to showcase this information on a row-by-row level.
- Transformation table (optional): You can select a transformation table that maps values (such as mapping MSFT to Microsoft) to group them together.
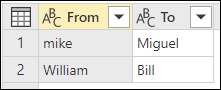
For this example, a transformation table is used to demonstrate how values can be mapped. The transformation table has two columns:
- From: The text string to look for in your table.
- To: The text string to use to replace the text string in the From column.
The following image shows the transformation table used in this example.
Important
It's important that the transformation table has the same columns and column names as shown in the previous image (they have to be labeled "From" and "To"). Otherwise Power Query doesn't recognize the table as a transformation table.
Return to the Group by dialog box, expand Fuzzy group options, change the operation from Count rows to All rows, enable the Show similarity scores option, and then select the Transformation table drop-down menu.
After you select the transformation table, select OK. The result of that operation gives you the following information:
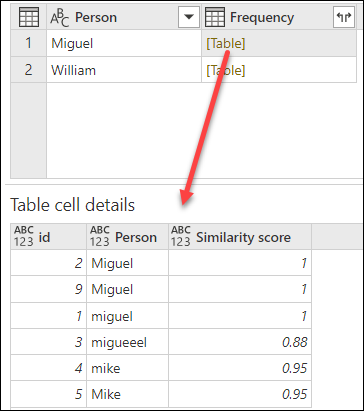
In this example, the Ignore case option was enabled, so the values in the From column of the Transformation table are used to look for the text string without considering the case of the string. This transformation operation occurs first, and then the fuzzy grouping operation is performed.
The similarity score is also shown in the table value next to the person column, which reflects exactly how the values were grouped and their respective similarity scores. You can expand this column if needed or use the values from the new Frequency columns for other sorts of transformations.
Note
When grouping by multiple columns, the transformation table performs the replace operation in all columns if replacing the value increases the similarity score.
For more information about how transformation tables work, go to Transformation table precepts.
See also
Feedback
Coming soon: Throughout 2024 we will be phasing out GitHub Issues as the feedback mechanism for content and replacing it with a new feedback system. For more information see: https://aka.ms/ContentUserFeedback.
Submit and view feedback for