Use the Vertex Execution View in Data Lake Tools for Visual Studio
Learn how to use the Vertex Execution View to exam Data Lake Analytics jobs.
Important
Azure Data Lake Analytics retired on 29 February 2024. Learn more with this announcement.
For data analytics, your organization can use Azure Synapse Analytics or Microsoft Fabric.
Open the Vertex Execution View
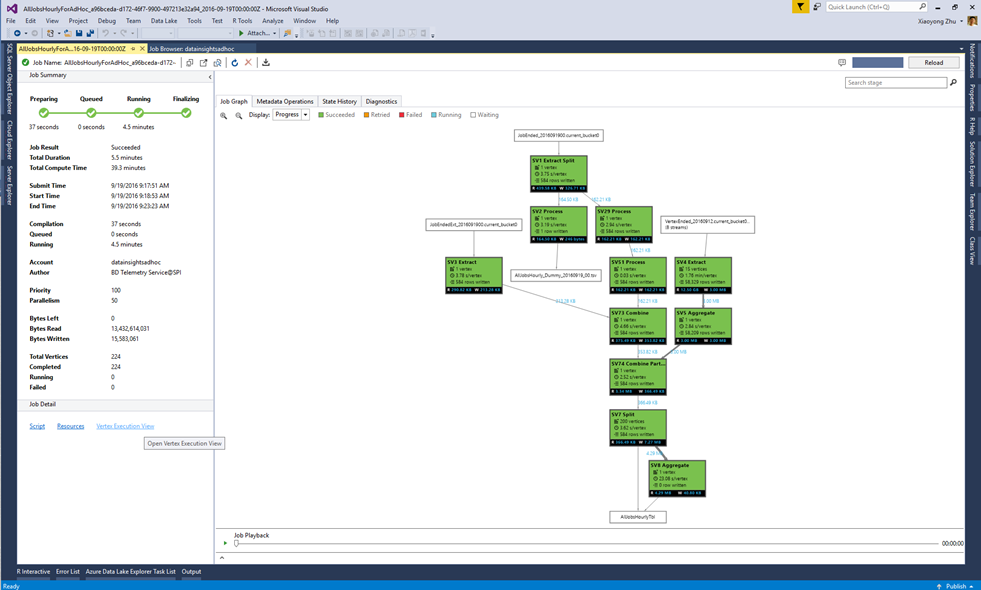
Open a U-SQL job in Data Lake Tools for Visual Studio. Select Vertex Execution View in the bottom left corner. You may be prompted to load profiles first and it can take some time depending on your network connectivity.

Understand Vertex Execution View
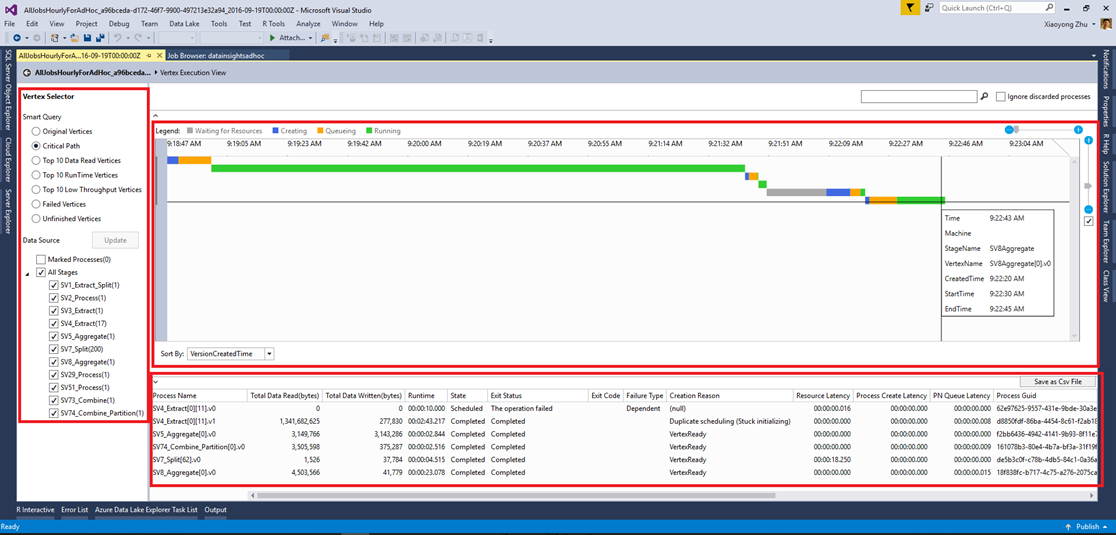
The Vertex Execution View has three parts:

The Vertex selector on the left lets you select vertices by features (such as top 10 data read, or choose by stage). One of the most commonly used filters is to see the vertices on critical path. The Critical path is the longest chain of vertices of a U-SQL job. Understanding the critical path is useful for optimizing your jobs by checking which vertex takes the longest time.

The top center pane shows the running status of all the vertices.

The bottom center pane shows information about each vertex:
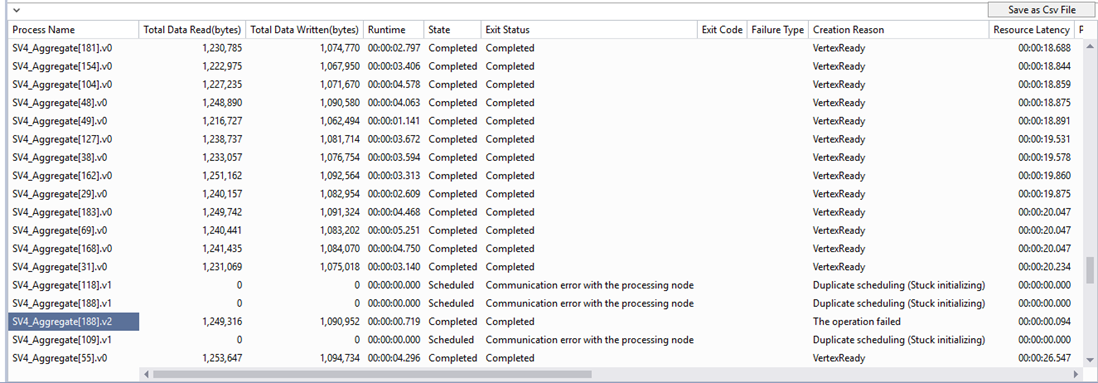
- Process Name: The name of the vertex instance. It's composed of different parts in StageName|VertexName|VertexRunInstance. For example, the SV7_Split[62].v1 vertex stands for the second running instance (.v1, index starting from 0) of Vertex number 62 in Stage SV7_Split.
- Total Data Read/Written: The data was read/written by this vertex.
- State/Exit Status: The final status when the vertex is ended.
- Exit Code/Failure Type: The error when the vertex failed.
- Creation Reason: Why the vertex was created.
- Resource Latency/Process Latency/PN Queue Latency: the time taken for the vertex to wait for resources, to process data, and to stay in the queue.
- Process/Creator GUID: GUID for the current running vertex or its creator.
- Version: the N-th instance of the running vertex (the system might schedule new instances of a vertex for many reasons, for example failover, compute redundancy, etc.)
- Version Created Time.
- Process Create Start Time/Process Queued Time/Process Start Time/Process Complete Time: when the vertex process starts creation; when the vertex process starts to queue; when the certain vertex process starts; when the certain vertex is completed.
Next steps
- To log diagnostics information, see Accessing diagnostics logs for Azure Data Lake Analytics
- To see a more complex query, see Analyze Website logs using Azure Data Lake Analytics.
- To view job details, see Use Job Browser and Job View for Azure Data lake Analytics jobs