Behavior patterns for Glint
Important
This article is for the legacy Workplace Analytics app and does not reflect functionality available on the updated Viva Insights platform. Access current documentation for Viva Insights advanced insights here: advanced insights documentation.
Note
This dashboard currently only supports Glint reports that are in English. For example, if you are a customer with data in Japanese, export the Glint report in English before you upload it to PBI. If you encounter errors even with the report exported in English, delete and then manually type in the column headers in English.
The Behavior patterns for Glint dashboard uses a template to combine sentiment data from Glint with behavioral data from Viva Insights. Leaders get insights into underlying factors that might be contributing to both how their employees feel and how they work. The analysis helps identify opportunities to influence behavior and improve business outcomes.
This analysis uses survey scores and working patterns to identify outlying teams who might need attention. Even for leaders who are already aware of team issues, the dashboard creates high-level visibility enabling them to use research-based and data-driven actions to change or improve workplace behaviors.
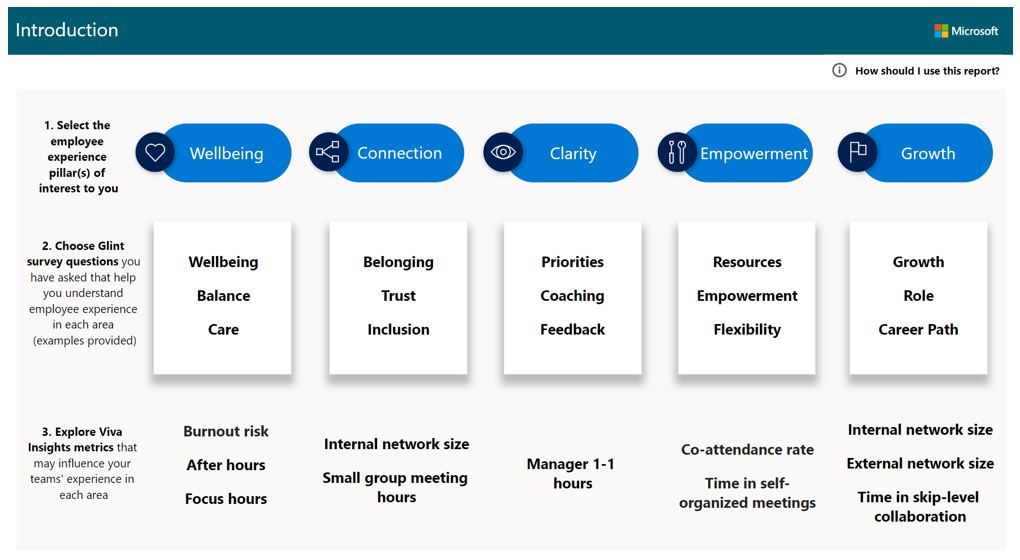
The dashboard combines the following data.
| Theme | Representative Glint survey question | Viva Insights metrics |
|---|---|---|
| Wellbeing | My company takes a genuine interest in their employees' wellbeing. |
|
| Connection | I feel a sense of belonging at my company. |
|
| Clarity | My manager keeps our team focused on clear priorities. | Manager one-on-one hours |
| Empowerment | I feel empowered to make decisions regarding my work. |
|
| Growth | I have good opportunities to learn and grow at my company. |
|
The dashboard includes the following reports.
- Wellbeing – Compares wellbeing scores for the selected HR attributes, such as organization or level designation, and shows how after-hours work, focus hours, and burnout risk might be affecting wellbeing for specific teams. You'll also see research-based, actionable strategies to help change behaviors that might be contributing to low wellbeing scores.
- Connection – Compares employee connection scores for the selected HR attribute to show how small group meeting hours and internal network size might be affecting employees’ feeling of connection. Helps leaders identify and support teams who might have underlying conditions that are affecting both their connection scores and collaboration patterns.
- Clarity – Compares prioritization scores for the selected HR attribute to show how manager one-on-one time might be affecting employees’ ability to focus on and prioritize their work. Gives teams easy-to-implement plans that create opportunities for employees to more regularly meet with their managers one-on-one and prioritize their work.
- Empowerment – Compares empowerment scores for the selected HR attribute to show how manager co-attendance and time in self-organized meetings might affect employee empowerment. Helps leaders understand how meeting behaviors impact autonomy and effectiveness.
- Growth – Compares growth scores for the selected HR attribute to show how network sizes and time in skip-level collaboration might affect team growth scores. It reveals the impact of network size and leadership interactions on development.
- How can I take action to improve employee experience? – Summarizes opportunities to improve employee experience by addressing related behaviors for individual, collective, and environmental interventions. After any interventions are started, leaders can use Viva Insights data to measure real-time change in collaboration behaviors and track improvement with subsequent Glint survey scores.
Demonstration
This uses sample data that is only representative of the dashboard and might not be exactly what you see in a live dashboard specific to your organization's unique data.
Setup video
The following video describes how to set up the dashboard, which might not be exactly what you experience with data that's unique to your organization.
High-level steps
The high-level steps required to populate the dashboard in Power BI:
- Get Glint data – In Glint, select the corresponding survey questions and the population to analyze in Power BI, including the HR attributes you want to analyze, such as team and position. Then export a Heat Map report file with this data.
- Get the Viva Insights data – Set up the predefined Behavior patterns for Glint template in the advanced insights app. After the results successfully run, download the template for the Glint query on the Results page. This template is required to create the dashboard in Power BI.
- Load both into Power BI – Connect to and load both the query data from the advanced insights app and the Heat map from Glint into Power BI.
Prerequisites
The following is required before you can run the query in the advanced insights app and populate the dashboard in Power BI.
Your company uses Glint with the same measured population that the advanced insights app has data for:
- The population reflected in the Glint Heat Map report is the same as the filtered population in the Behavior patterns for Glint template.
- You have Glint survey content for the last three to six months that includes questions on one or more of the following themes of employee wellbeing, connection, clarity, empowerment, and growth.
Be assigned the role of Analyst in the advanced insights app.
Have the latest version of Power BI Desktop installed. If you have an earlier version of Power BI installed, uninstall it before installing the new version. Then go to Get Power BI Desktop to download and install the latest version.
Have at least one of the following organizational attributes already uploaded and processed in the advanced insights app.
- Level designation - Each employee's level in the organization.
- Organization or team - Each employee’s team assignment, which reflects the organization or business division they're in.
Get the Glint data
In Glint, select Reports > Heat Map, and then select the reports that have questions on wellbeing, prioritization, and connectivity. If the questions spread across different pulse dates, select the Multiple Pulses option.
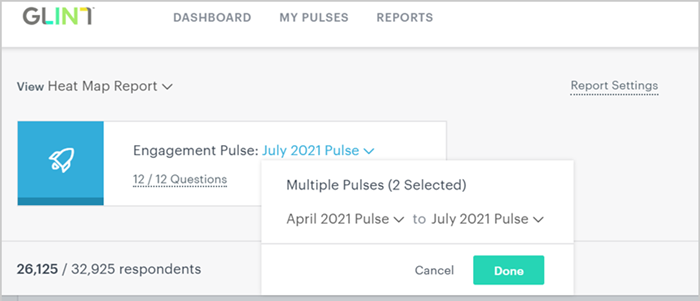
In Filter By, select the applicable departments for the population you want to analyze in Power BI, and then select Done.

Select the grouping attributes that are also used in the advanced insights app for the report.
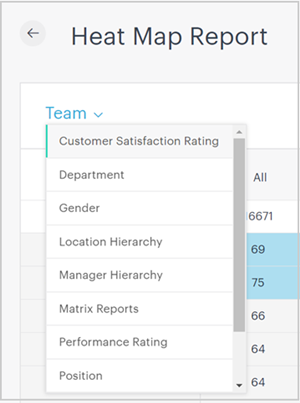
In Add section, select (up to five) other grouping attributes to analyze by, which must also be present in the advanced insights app.
Select Export to spreadsheet to download the report.
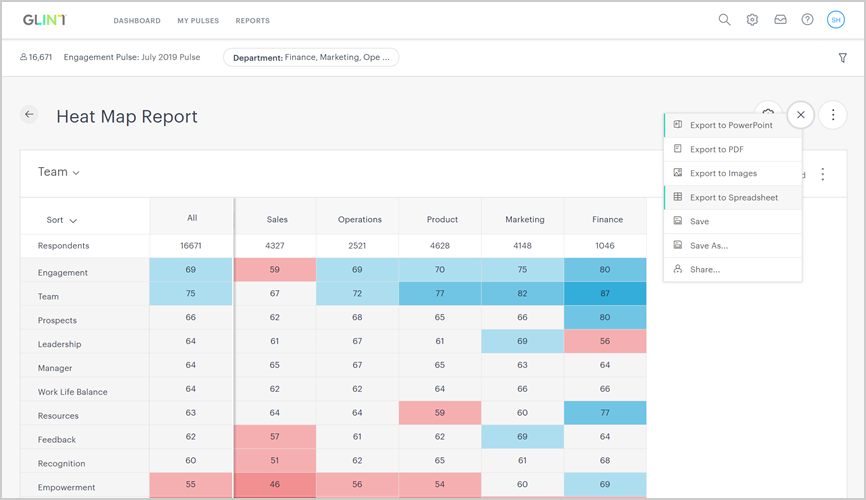
Save the spreadsheet in an accessible location.
Get the Viva Insights data
Note
This dashboard is currently only available in English and will only work with data generated from the English version of the app. Before running the required queries, confirm the browser language in the app's URL includes en-us, or change it to include en-us: ...office.com/en-us/...
In the app(if that link doesn't work, try this link instead), select Analyze > Query designer.
In Create > Other templates, select Behavior patterns for Glint to see the required setup steps, and then in step 2, select Set up.
When prompted, select or confirm the following settings:
- Name – Customize or keep the default name
- Group by – Week
- Time period – Select the time period that corresponds to the time period that the Glint survey questions ask about
- Auto-refresh – Keep this setting disabled
- Meeting and attendee exclusions – Select the preferred rules for your tenant
Important
If you try to delete a predefined metric, you'll see a warning that the deletion might disable portions of the Power BI dashboard and reduce query results. In turn, this can limit your ability to visualize collaboration patterns. Depending on the metric you delete, you might disable a single Power BI chart, several charts, or all the charts. Select Cancel to retain the metric.
In Select filters, select Active only for "Which measured employees do you want to include?" and then, optionally, you can further filter for the population of interest for the dashboard. For more details about filter and metric options, see Create a Person Query.
In Organizational data, keep the preselected Organization and LevelDesignation attributes that the dashboard requires and up to three more that match up with the attributes included in your Glint data.
Important
If you remove the required, preselected Organizational data attributes, you might disable one or more Power BI charts.
Select Run to run the query, which can take a few minutes up to a few hours to complete.
When prompted, select to go to Results. After the results successfully run, select the Download icon for the Behavior patterns for Glint query results, select PBI template, and then select OK to download the template.
Load the data in Power BI
Open the downloaded Behavior patterns for Glint template.
If prompted to select a program, select Power BI.
When prompted by Power BI, enter the following, and then select Load to import the query results into Power BI.
- In Query designer > Results, select the Link icon, and then select to copy the generated OData URL link.
- In Power BI, paste the copied OData link for the query data.
- In the Glint Heat Map report, copy and paste the Heat Map file path.
- In Minimum group size, enter a number for data aggregation within this report's visualizations that complies with your company's policy for viewing advanced insights data.
If you're already signed in to Power BI with your the organizational account for the advanced insights app, the dashboard visualizations will populate with your data. You are done and can skip the following steps. If not, proceed to the next step.
If you're not signed in to Power BI, or if an error occurs when updating the data, sign in to your organizational account again. In the OData feed dialog box, select Organizational account, and then select Sign in. See Troubleshooting for more details.
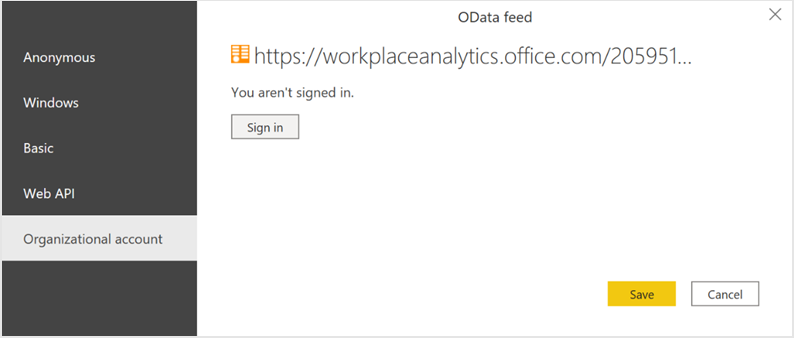
Select and enter credentials for the organizational account that you use to sign in to the advanced insights app, and then select Save.
Important
You must sign in to Power BI with the same account that you use to access Viva Insights.
Select Connect to prepare and load the data, which can take a few minutes to complete.
Dashboard settings
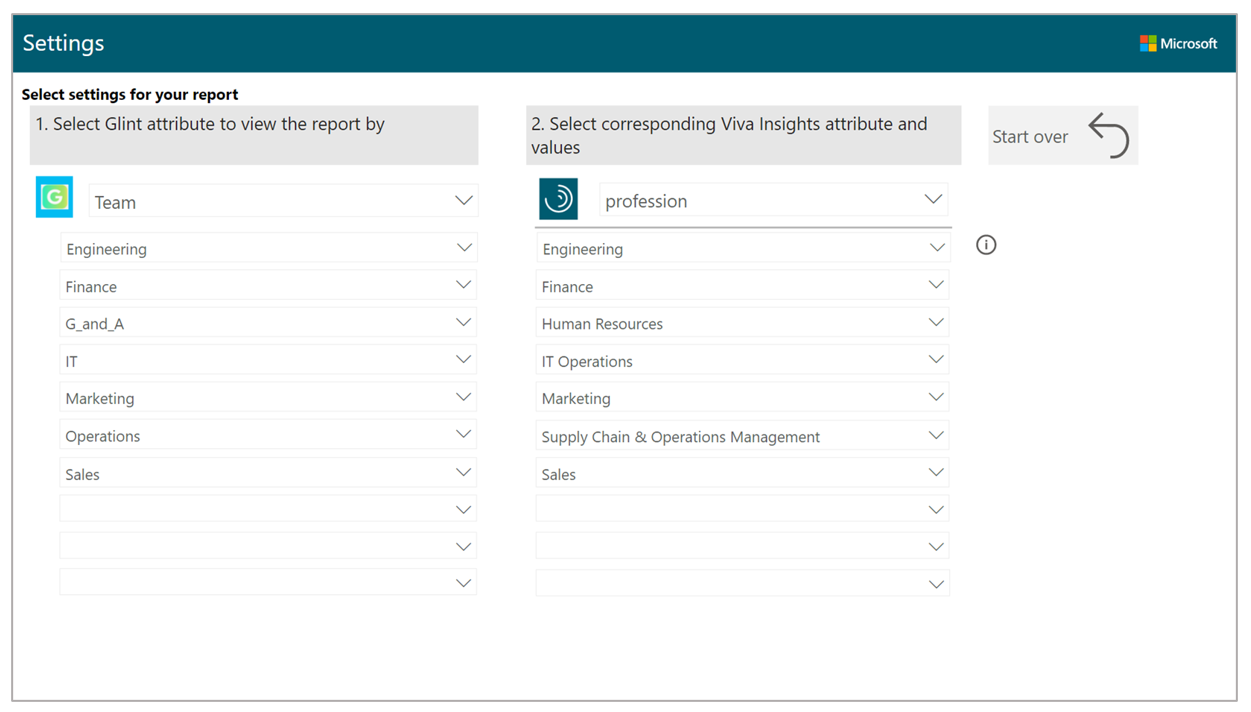
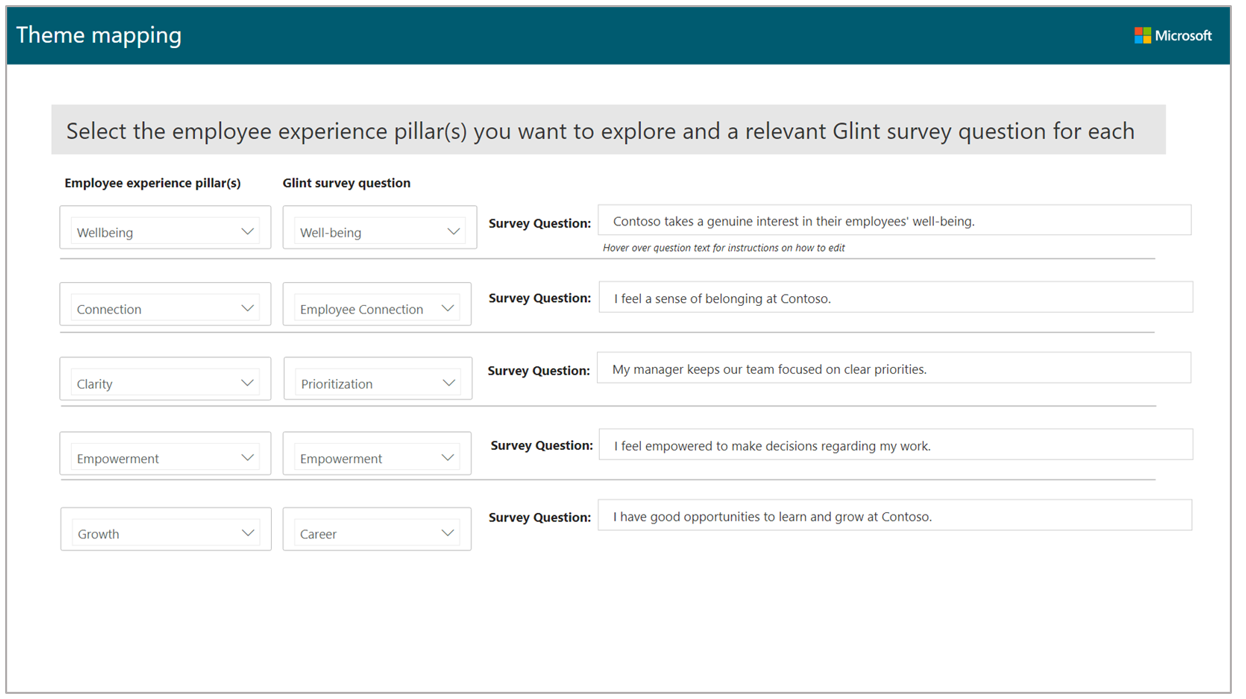
After the Behavior patterns dashboard is set up and populated with both the Glint and Viva Insights data in Power BI and before viewing data in the dashboard, set the following parameters on the Settings and Theme mapping pages.
Select the Glint attribute to view the report by – In Settings, select the primary “group-by” attribute that represents the teams in Glint. To clear an existing mapping, select the Reset arrow.
Select corresponding attributes or values for the Viva Insights data – For each Glint value, select the matching field value (ideally one to one) that is used in Viva Insights data.
Select the employee experience pillars to explore – Map the employee themes to their corresponding Glint survey question themes, and then enter the actual question asked in Glint.
Power BI tips, troubleshooting, and FAQs
For details about how to share the dashboard and other Power BI tips, troubleshoot any issues, or review the FAQ, see Power BI tips, FAQ, and troubleshooting.