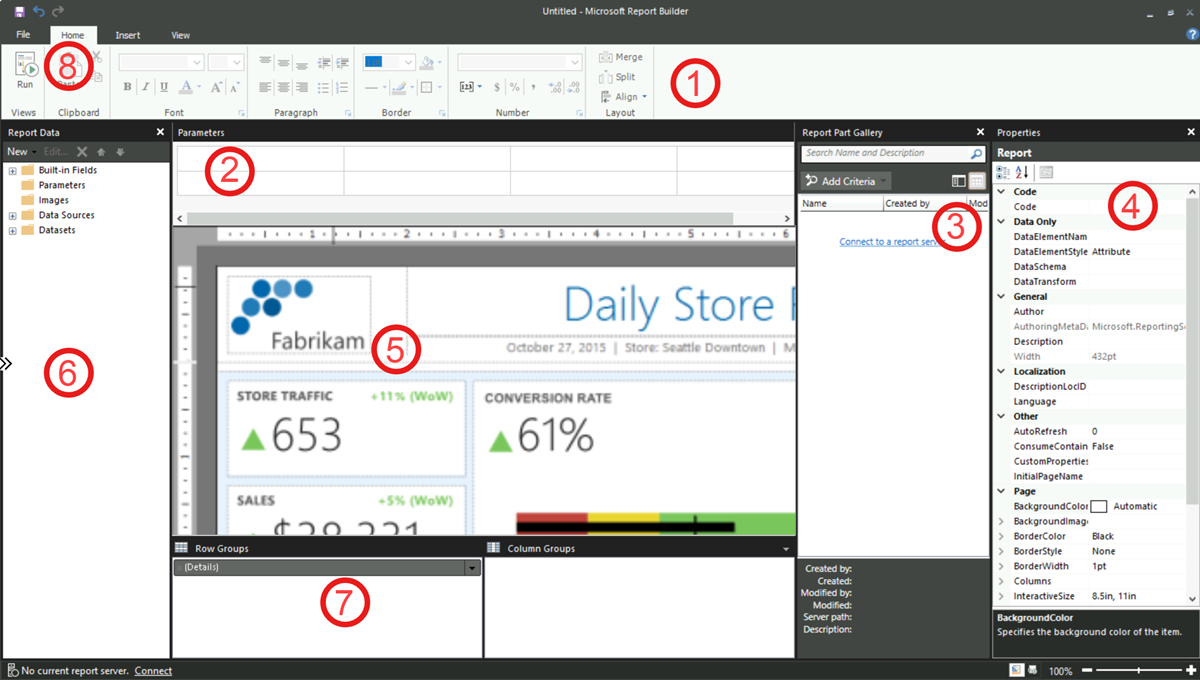
Report design view in Report Builder
In this article, learn how the Report Builder window is designed to help you easily organize report resources and quickly build paginated reports. The design surface is at the center of the window, with the ribbon and the panes around it. The following sections explain the panes that you use to add, select, and organize your report resources, and change report item properties.
Ribbon
The ribbon in Report Builder provides quick access to the most commonly used tools and commands you use to design reports. Each tab and group of options is organized logically to help you find the tools you need without disrupting your workflow.
Parameters
With report parameters, you can control report data, connect related reports together, and vary a report's presentation. The Parameters pane provides a flexible layout for the report parameters.
For more information, see Paginated report parameters in Report Builder.
Report design surface
The Report Builder report design surface is the main work area for designing reports. To place report items such as data regions, subreports, text boxes, images, rectangles, and lines in your report, add them from the ribbon or the Report Part Gallery pane to the design surface. On the report design surface, you can add groups, expressions, parameters, filters, actions, visibility, and formatting to your report items.
Note
Report parts are deprecated for all releases of SQL Server Reporting Services starting with SQL Server Reporting Services 2019 and all releases of Power BI Report Server starting with Power BI Report Server September 2022.
You can also change the following details:
Report body properties: Right-click the white area of the design surface, outside any report items, and select Body Properties to change properties such as border and fill color.
Header and footer properties: Right-click the white area of the design surface in the header or footer area, outside any report items, and select Header Properties or Footer Properties to change properties such as border and fill color.
Report properties: Right-click the gray area around the design surface and select Report Properties to modify settings such as page setup.
Report item properties: Right-click any report item and select Properties to change its specific properties.
For information about how to use the keyboard to modify items on the design surface, see Keyboard shortcuts for accessibility in paginated reports in Report Builder.
Design surface size and print area
The design surface size might be different from the page size print area that you specify to print the report. Changing the size of the design surface doesn't change the print area of your report. No matter what size you set for the print area of your report, the full design area size doesn't change. For more information, see Rendering behaviors in a paginated report (Report Builder).
Tip
To display the ruler, on the View tab, select the Ruler box.
Report Data
From the Report Data pane, you define the report data and report resources that you need for a report before you design your report layout. For example, you can add data sources, datasets, calculated fields, report parameters, and images to the Report Data pane.
After you add items to the Report Data pane, drag fields to a data region on the design surface to control where data appears in the report.
Tip
If you drag a field from the Report Data pane directly to the report design surface instead of placing it in a data region such as a table or chart, when you run the report, you see only the first value from the data in that field.
You can also drag built-in fields from the Report Data pane to the report design surface. When rendered, these fields provide information about the report. The information includes the report name, the total number of pages in the report, and the current page number.
Some items are automatically added to the Report Data pane when you add them to the report design surface. For example, if you add a report part from the Report Part Gallery pane, and the report part is a data region, the dataset is automatically added to the Report Data pane. Also, if you embed an image in your report, the image is added to the Images folder in the Report Data pane. For more information, see Report parts and datasets in Report Builder.
Note
Use the New button to add a new item to the Report Data pane. You can add multiple datasets from the same data source or from other data sources to the report. You can also add shared datasets from the report server. To add a new dataset from the same data source, right-click a data source, and then select Add Dataset.
For more about items in the Report Data pane, see the following articles:
- Built-in Globals and User references in a paginated report (Report Builder)
- Images in paginated reports (Report Builder)
- Create data connection strings in Report Builder
- Report Embedded Datasets and Shared Datasets (Report Builder and SSRS)
- Dataset Fields Collection (Report Builder and SSRS)
Report Part Gallery
The easiest way to create a report is to connect to an existing report part on the report server or a report server integrated into a SharePoint site.
Select Report Parts on the Insert tab to open the Report Part Gallery pane. There, you can search for report parts to add to your report. You can filter the report parts by all or part of the name of the report part. You can also filter by creator, modifier, last modified date, storage location, and type. For example, you could search for all charts created last week by one of your coworkers.
Note
To view items in the Report Part Gallery pane, you must be connected to a server.
Report parts are deprecated for all releases of SQL Server Reporting Services after SQL Server Reporting Services 2019, and discontinued starting in SQL Server Reporting Services 2022 and Power BI Report Server.
You can view the search results either as thumbnails or as a list, and sort the search results by name, created and modified dates, and creator. For more information, see Report Parts (Report Builder and SSRS).
Properties
To see the Properties pane, on the View tab, in the Show/Hide group, select Properties.
Every item in a report, including data regions, images, text boxes, and the report body itself, has properties associated with it. For example, the BorderColor property for a text box shows the color value of the text box's border, and the PageSize property for the report shows the page size of the report.
These properties display in the Properties pane. The properties in the pane change depending on the report item that you select.
Change property values
In Report Builder, you can change the properties for report items by:
- Selecting buttons and lists on the ribbon.
- Changing settings within the appropriate dialog.
- Modifying property values within the Properties pane.
The most commonly used properties are available in dialogs and on the ribbon. Depending on the property, you can set a property value from a list, enter the value, or select <Expression> to create an expression.
Change the Properties pane view
By default, properties in the Properties pane are organized into broad categories, such as Action, Border, Fill, Font, and General. Each category has a set of properties associated with it. For example, the following properties are listed in the Font category:
- Color
- FontFamily
- FontSize
- FontStyle
- FontWeight
- LineHeight
- TextDecoration
Choose the Categorize or Alphabetize icon at the top of the Properties pane to switch between the Properties pane views, depending on how you want to view the properties. Select the Property Pages icon to open the Report Body Properties dialog for a selected report item.
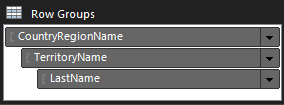
Grouping
Use groups to organize your report data into a visual hierarchy and to calculate totals. You can view the row and column groups within a data region on the design surface and also in the Grouping pane. The Grouping pane has two panes: Row Groups and Column Groups. When you select a data region, the Grouping pane displays all the groups within that data region as a hierarchical list. Child groups appear indented under their parent groups.
You can create groups by dragging fields from the Report Data pane and dropping them on the design surface or in the Grouping pane. In the Grouping pane, you can add parent, adjacent, and child groups, change group properties, and delete groups.
The Grouping pane is displayed by default, but you can close it by clearing the Grouping pane on the View tab. The Grouping pane isn't available for the Chart or Gauge data regions.
For more information, see Grouping pane in a paginated report (Report Builder) and Groups in a Report Builder paginated report.
Run
In report design view, you aren't working with the actual data, but a representation of the data indicated by the field name or expression. When you want to see the actual data in the context of your report layout, select Run in the ribbon on the Home tab to preview the report. Switching between designing and previewing your report allows you to adjust its design and see the results immediately.
When you select Run, Report Builder connects to the report data sources, caches the data on your computer, combines the data and the layout, and renders the report in the HTML Viewer. You can run your report as often as you like while you design it. When you finish with your report, save the report to the report server where other individuals with the appropriate permissions can view your report.
For more information, see Preview a report in Report Builder.
Run a report with parameters
When you run your report, the report processes automatically. If the report contains parameters, all the parameters must have default values before the report can run automatically. If a parameter doesn't have a default value when you run the report, you must choose a value for the parameter, and then select Refresh in the ribbon on the Run tab. For more information, see Report parameters (Report Builder and Report Designer).
Print Preview
When you preview a report, it looks similar to an HTML report. To see how the report would appear in print, switch to Print Layout mode by selecting Print Layout in the ribbon on the Run tab. This view simulates a printed page, resembling the output of Image and PDF rendering extensions, though it's not an actual image or PDF file.