Add a filter to a Report Builder paginated report
Applies to: ![]() Microsoft Report Builder (SSRS)
Microsoft Report Builder (SSRS) ![]() Power BI Report Builder
Power BI Report Builder ![]() Report Designer in SQL Server Data Tools
Report Designer in SQL Server Data Tools
Add a filter to a dataset, data region, or group to a paginated report when you want to include or exclude specific values for calculations or display. Filters are applied at run time first on the dataset. Then, the filters are applied on the data region, and then on the group, in top-down order for group hierarchies. In a table, matrix, or list, filters for row groups, column groups, and adjacent groups are applied independently. In a chart, filters for category groups and series groups are applied independently.
To add a filter, specify one or more filter equations. A filter equation consists of an expression that identifies the data that you want to filter, an operator, and the value to compare to. The data types of the filtered data and the value must match. Filtering on aggregate values for a dataset or data region isn't supported.
To filter data points in a chart, you can set a filter on a category group or a series group. By default, the chart uses the built-in function Sum to aggregate values that belong to the same group into an individual data point in the series. If you change the aggregate function of a series, you must change the aggregate function in the filter expression.
For more information about filtering embedded and shared datasets, see Add a filter to a dataset (Report Builder and SSRS).
Note
You can create and modify paginated report definition (.rdl) files in Microsoft Report Builder, Power BI Report Builder, and in Report Designer in SQL Server Data Tools.
Set a filter on a data region
Open a report in Design view.
Select the data region on the design surface, and then right-click
<data region>Properties. For a gauge, select Gauge Panel Properties. The<data region>Properties dialog opens.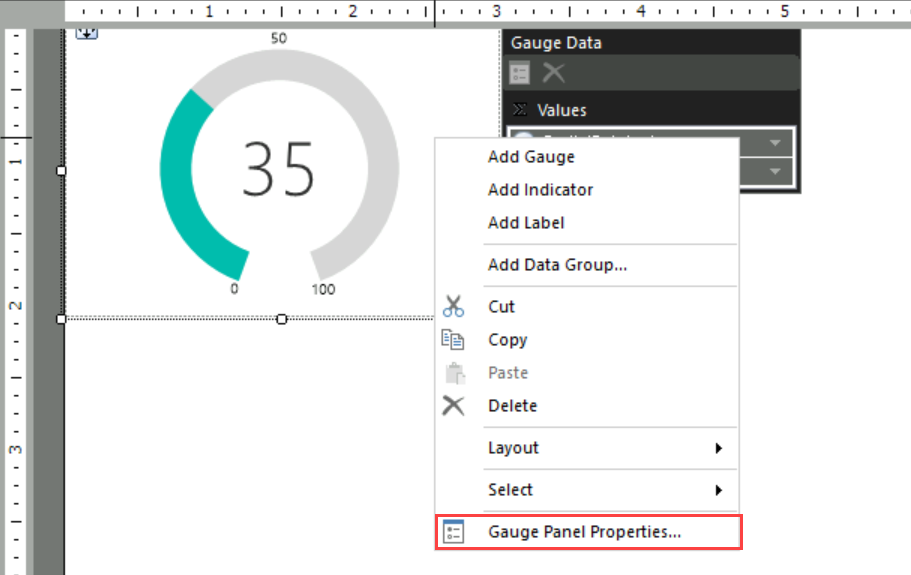
Note
On a Tablix data region, right-click the corner cell or a row or column handle, and then select Tablix Properties.
Select Filters. This action displays the current list of filter equations. By default, the list is empty.
Select Add. A new blank filter equation appears.
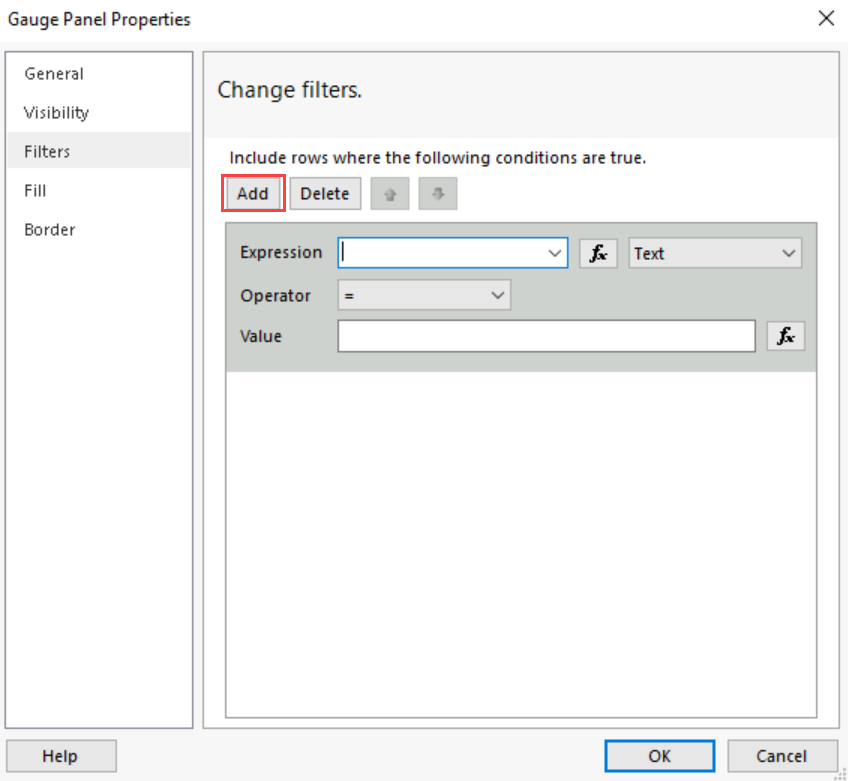
In Expression, enter or select the expression for the field to filter. To edit the expression, select the expression fx button.
From the list, select the data type that matches the type of data in the expression you created in step 5.
In the Operator box, select the operator that you want the filter to use to compare the values in the Expression box and the Value box. The operator you choose determines the number of values that are used from the next step.
In the Value box, enter the expression or value against which you want the filter to evaluate the value in Expression.
For examples of filter equations, see Filter equation examples in a paginated report (Report Builder).
Select OK.
Set a filter on a Tablix row or column group
Open a report in Design view.
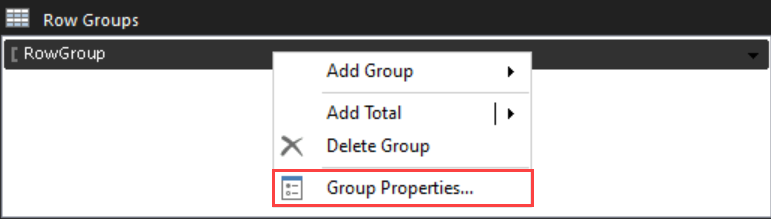
Select table, matrix, or list data region on the design surface. The Grouping pane displays the groups for the selected item.
In the Grouping pane, right-click the group, and then select Group Properties to add filter to the group.
Select Filters. This action displays the current list of filter equations. By default, the list is empty.
Select Add. A new blank filter equation appears.
In Expression, enter or select the expression for the field to filter. To edit the expression, select the expression fx button.
From the list, select the data type that matches the type of data in the expression you created in step 5.
In the Operator box, select the operator that you want the filter to use to compare the values in the Expression box and the Value box. The operator you choose determines the number of values that are used from the next step.
In the Value box, enter the expression or value against which you want the filter to evaluate the value in Expression.
For examples of filter equations, see Filter equation examples in a paginated report (Report Builder).
Select OK.
Set a filter on a Chart category group
Open a report in Design view.
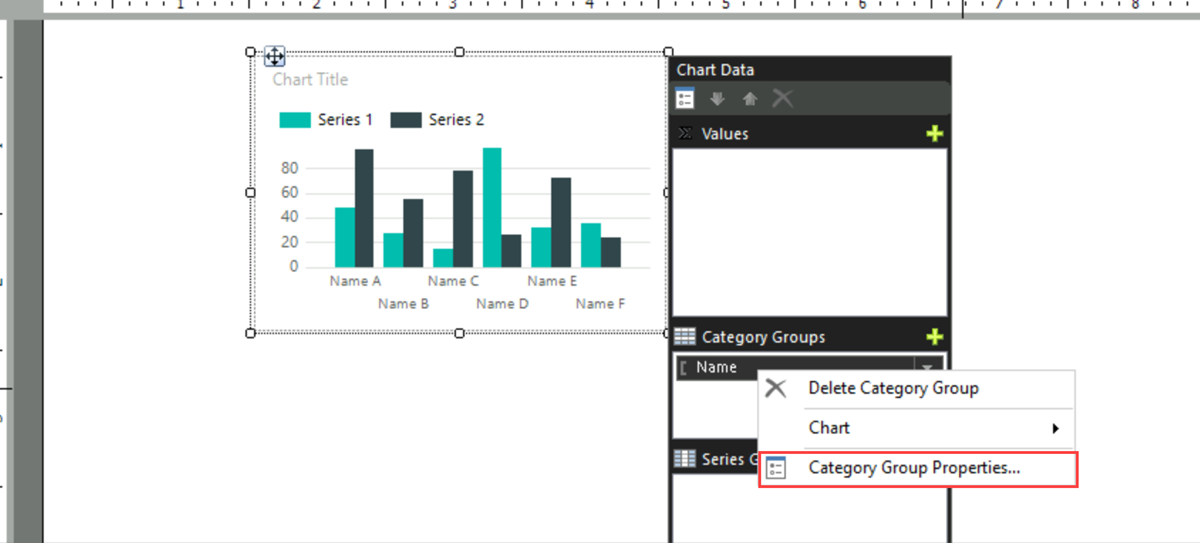
On the design surface, select the chart to bring up data, series, and Category Groups drop zones.
Right-click on a field contained in the Category Group drop zone and select Category Group Properties.
Select Filters. This action displays the current list of filter equations. By default, the list is empty.
Select Add. A new blank filter equation appears.
In Expression, enter or select the expression for the field to filter. To edit the expression, select the expression fx button.
From the list, select the data type that matches the type of data in the expression you created in step 5.
In the Operator box, select the operator that you want the filter to use to compare the values in the Expression box and the Value box. The operator you choose determines the number of values that are used from the next step.
In the Value box, type the expression or value against which you want the filter to evaluate the value in Expression.
For examples of filter equations, see Filter equation examples in a paginated report (Report Builder).
Select OK.
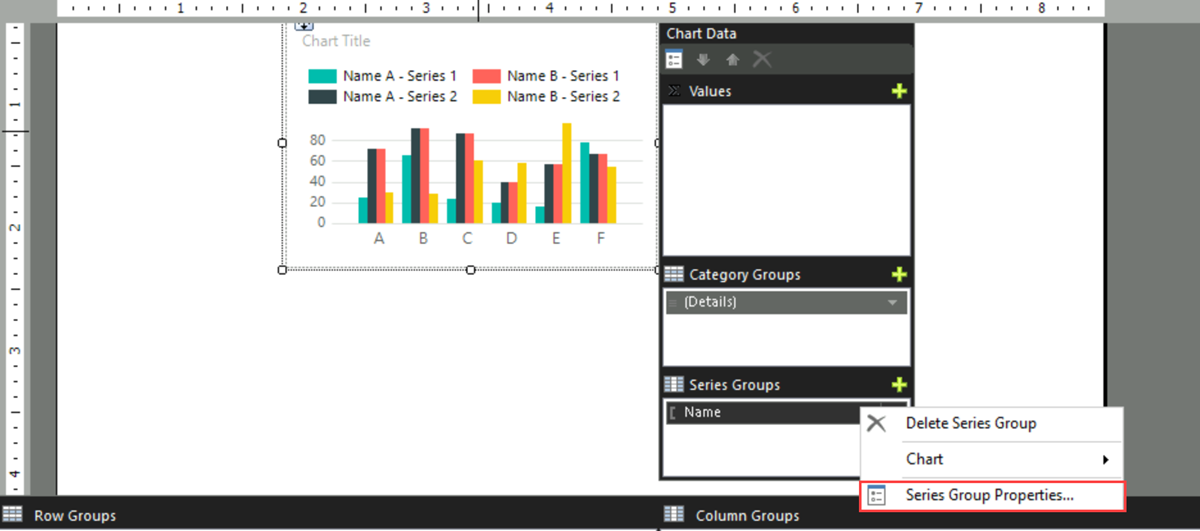
Set a filter on a Chart series group
Open a report in Design view.
On the design surface, double-click the chart to bring up data, series, and category field drop zones.
Right-click on a field contained in the series field drop zone and select Series Group Properties.
Select Filters. This action displays the current list of filter equations. By default, the list is empty.
Select Add. A new blank filter equation appears.
In Expression, enter or select the expression for the field to filter. To edit the expression, select the expression fx button.
From the list, select the data type that matches the type of data in the expression you created in step 5.
In the Operator box, select the operator that you want the filter to use to compare the values in the Expression box and the Value box. The operator you choose determines the number of values that are used from the next step.
In the Value box, type the expression or value against which you want the filter to evaluate the value in Expression.
For examples of filter equations, see Filter equation examples in a paginated report (Report Builder).
Select OK.