Design for Azure Monitor data sources
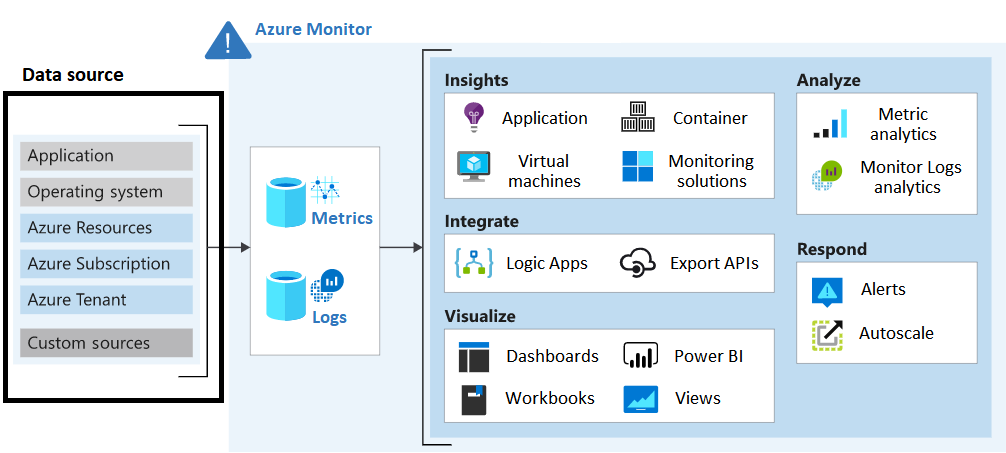
Azure Monitor is based on a common monitoring data platform that enables you to view, analyze, and work with data gathered from your resources. The platform offers many features that support two primary components: Logs and Metrics.
Azure Monitor Logs lets you collect and organize data from resources that you monitor. You configure what data is gathered and how it's organized in the platform. Other features in Azure Monitor automatically store their data in Logs. You can use the stored data with your collected data to help monitor the performance of your environment.
Azure Monitor Metrics captures numerical data from your monitored resources and stores the results in a time-organized database. Metrics are collected at intervals you specify. You can use metrics to check how your system is performing at a particular time or under certain circumstances.
Other sources of monitoring data are collected by Azure Monitor in addition to the data created by Azure resources.

As the CTO for Tailwind Traders, think about your environment. What sources of monitoring data do you want to collect? What analysis or other actions might you want to take on your collected data?
Things to know about Azure Monitor
As you develop your monitoring plan, consider these characteristics of Azure Monitor.
Data from multiple resources can be collected into Azure Monitor and analyzed together by using a common set of tools.
Logs enable complex analysis by using log queries.
Metrics support near-real-time scenarios like priority alerts and responding to critical issues.
Monitoring data can be sent to other locations to support certain scenarios, such as tracking and reporting.
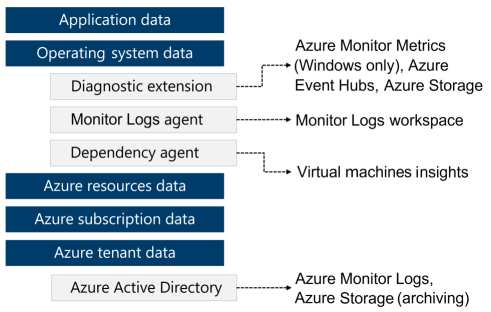
Sources of monitoring data from Azure applications can be organized into tiers, and each tier can be accessed in different ways.
- The highest tiers are for your application itself.
- The lower tiers are components of the Azure platform.
For more information about data locations and data access, see Monitoring data locations in Azure.
Things to consider when using Azure Monitor
You reviewed how Azure Monitor uses Logs and Metrics. Now consider how to implement these features in your monitoring solution for Tailwind Traders.
Consider data sources and data access. Identify what Tailwind Traders resources to monitor. Consider how data from these resources is accessed by other resources or applications. Azure Monitor collects data automatically from a range of components, and the data is accessed in various ways:

- Application data relates to your custom app code.
- Operating system data is from the Windows or Linux virtual machines that host your app.
- Azure resource data is from the operations of an Azure resource, such as a web app or a load balancer.
- Azure subscription data is about your subscription, including information about Azure health and availability.
- Azure tenant data describes your Azure organization-level services, such as Microsoft Entra ID.
Consider queries on Logs data. Write log queries to analyze your collected data for Tailwind Traders. For more information about log queries, see Log queries in Azure Monitor.
Consider alerts based on Logs and Metrics data. Set up alert rules based on Logs data to be proactively notified about system issues. Use Metrics data to identify when critical Tailwind Traders issues occur, such as values that exceed defined limits.
Consider Metrics Explorer to analyze metrics interactively. Define metrics to monitor about your Tailwind Traders resources, such as peak usage rates, access information, workloads, or incident scenarios. Use the Metrics Explorer to investigate the collected data. For more information about log queries, see Advanced features of Metrics Explorer.