Save key findings with bookmarks
To hunt for threats to Contoso's environment, you have to review large amounts of log data for evidence of malicious behavior. During this process, you might find events that you want to remember, revisit, and analyze as part of validating potential hypotheses and understanding the full story of a compromise.
Hunt by using bookmarks
Bookmarks in Microsoft Sentinel can help you hunt for threats by preserving the queries you already ran, along with the query results that you deem relevant. You can also record your contextual observations and reference your findings by adding notes and tags. Bookmarked data is visible to you and your teammates for easy collaboration.
You can revisit your bookmarked data at any time on the Bookmarks tab of the Hunting page. You can use filtering and search options to quickly find specific data for your current investigation. Alternatively, you can review your bookmarked data directly in the HuntingBookmark table in your Log Analytics workspace.
Note
Bookmarked events contain standard event information but can be used in different ways throughout the Microsoft Sentinel interface.
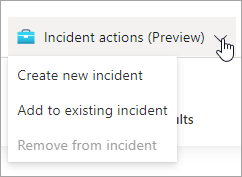
Create or add to incidents by using bookmarks
You can use bookmarks to create a new incident or add bookmarked query results to existing incidents. The Incident actions button on the toolbar enables you to perform either of these tasks when a bookmark is selected.
Incidents that you create from bookmarks can be managed from the Incidents page alongside other incidents created in Microsoft Sentinel.
Use the investigation graph to explore bookmarks
You can investigate bookmarks in the same way that you'd investigate incidents in Microsoft Sentinel. From the Hunting page, select Investigate to open the investigation graph for the incident. The investigation graph is a visual tool that helps to identify entities involved in the attack and the relationships between those entities. If the incident involves multiple alerts over time, you can also review the alert timeline and correlations between alerts.
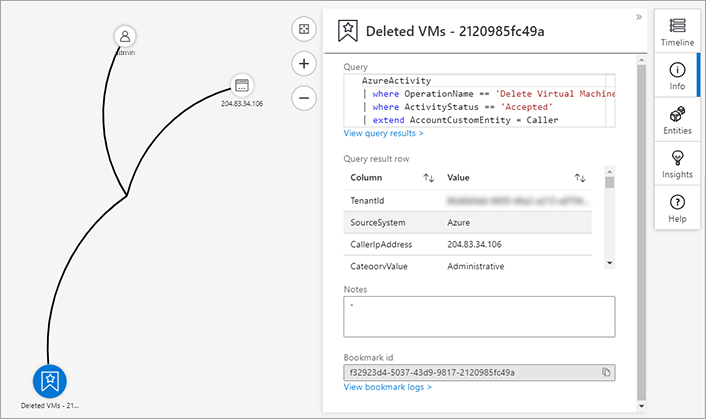
Review entity details
You can select each entity on the graph to observe complete contextual information about it. This information includes relationships to other entities, account usage, and data flow information. For each information area, you can go to the related events in Log Analytics and add the related alert data into the graph.
Review bookmark details
You can select the bookmark item on the graph to observe important bookmark metadata related to the bookmark's security and environment context.
Choose the best response for the following question, then select Check your answers.