Operational awareness
In order for us begin to work on monitoring for reliability, there's a predecessor step we have to take. First, we need to make sure we have a reasonable level of operational awareness.
The simplest way to say this is that in order to work towards the reliability of systems in production, we first have to have a decent understanding of those systems and how they're functioning in production.
Collect information about the present configuration
Though it may sound peculiar, in many environments the first question wee need to answer is "What exactly is running in production?" Our production environments these days and the paths to deploying to them are sufficiently complex that it's not uncommon to first have to do a bit of discovery first. Given a specific application, what are its component parts? What parts talk to other parts? What are the obvious (and not-so-obvious) dependencies for this application?
Collect information about normal and past performance
Once we get that information, we can then attempt to get a baseline around performance and "normal" behavior for the system. There's lots of reasons we might need this information, not the least of which is to help us when we have to triage a problem with the application. The middle of an outage is a bad time to be figuring out whether the database servers running at 80% CPU is a good thing or a bad thing.
As part of obtaining that baseline, we'll want to dive into looking at past performance. While it's true that past performance is no guarantee of future results, it can sometimes help us calibrate our expectations. Similarly, if we have access to information about past outages or hiccups with a service, those might give us at least some sense of potential failure modes that we're going to need to incorporate into our thinking around reliability.
Collect information about the context
And finally, it's useful for us to gain some contextual knowledge around a system. Context can fall into a wide variety of buckets, much of it socio-technical. For example: on the socio- side, we'll want to gather good information about the stakeholders associated with a service or an application.
You might think oh, it's obvious who owns or cares about a particular app/service, but in enterprise situations or other complex organizations, this can be much harder than it sounds.
The sad truth is THAT we're not going to be able to make much headway on a system's reliability without a clear idea of who the stakeholders are (for reasons that will become clear later when we discuss SLIs and SLOs).
On the technical side of the context question, it's really helpful for us to pay attention to technical questions like just how did this application get in production? Was it deployed manually during an "epic" deployment, or was it deployed via an automated CI/CD pipeline with a great set of unit tests?
This information can have many ramifications, including how easy it will be to iterate if and when we have reliability improving updates to make. It's also possibly a useful indicator of work that we could be doing that will make a real difference.
Azure Tools for operational awareness
Gaining operational awareness is often not easy, but we're going to look at a few tools Azure provides that can assist with the process. This will be a very shallow exploration; at the end of this module, we'll include pointers to other Microsoft Learn modules and documentation if you'd like to explore any of these in more depth.
Application Insights
The first tools we'll look at can help us with the "what's actually running?" question. As operations people, it's not unusual to be asked to work with an application that's already running in production. While ideally we'd be part of the entire lifecycle of the software, starting at the design phase, that's not always (or perhaps often) the case. When this happens, especially with more complex multitiered or microservice based applications, just being able to understand what all of the moving parts do can take effort.
One tool that can reduce that effort—plus give us information about the application's behavior in production—is Application Insights. With minimal effort, developers can instrument their application so that it automatically sends telemetry information to collectors running in Azure. With this information, Application Insights can create a visual map of the components of the application and the communication between these components.
Here's an example:
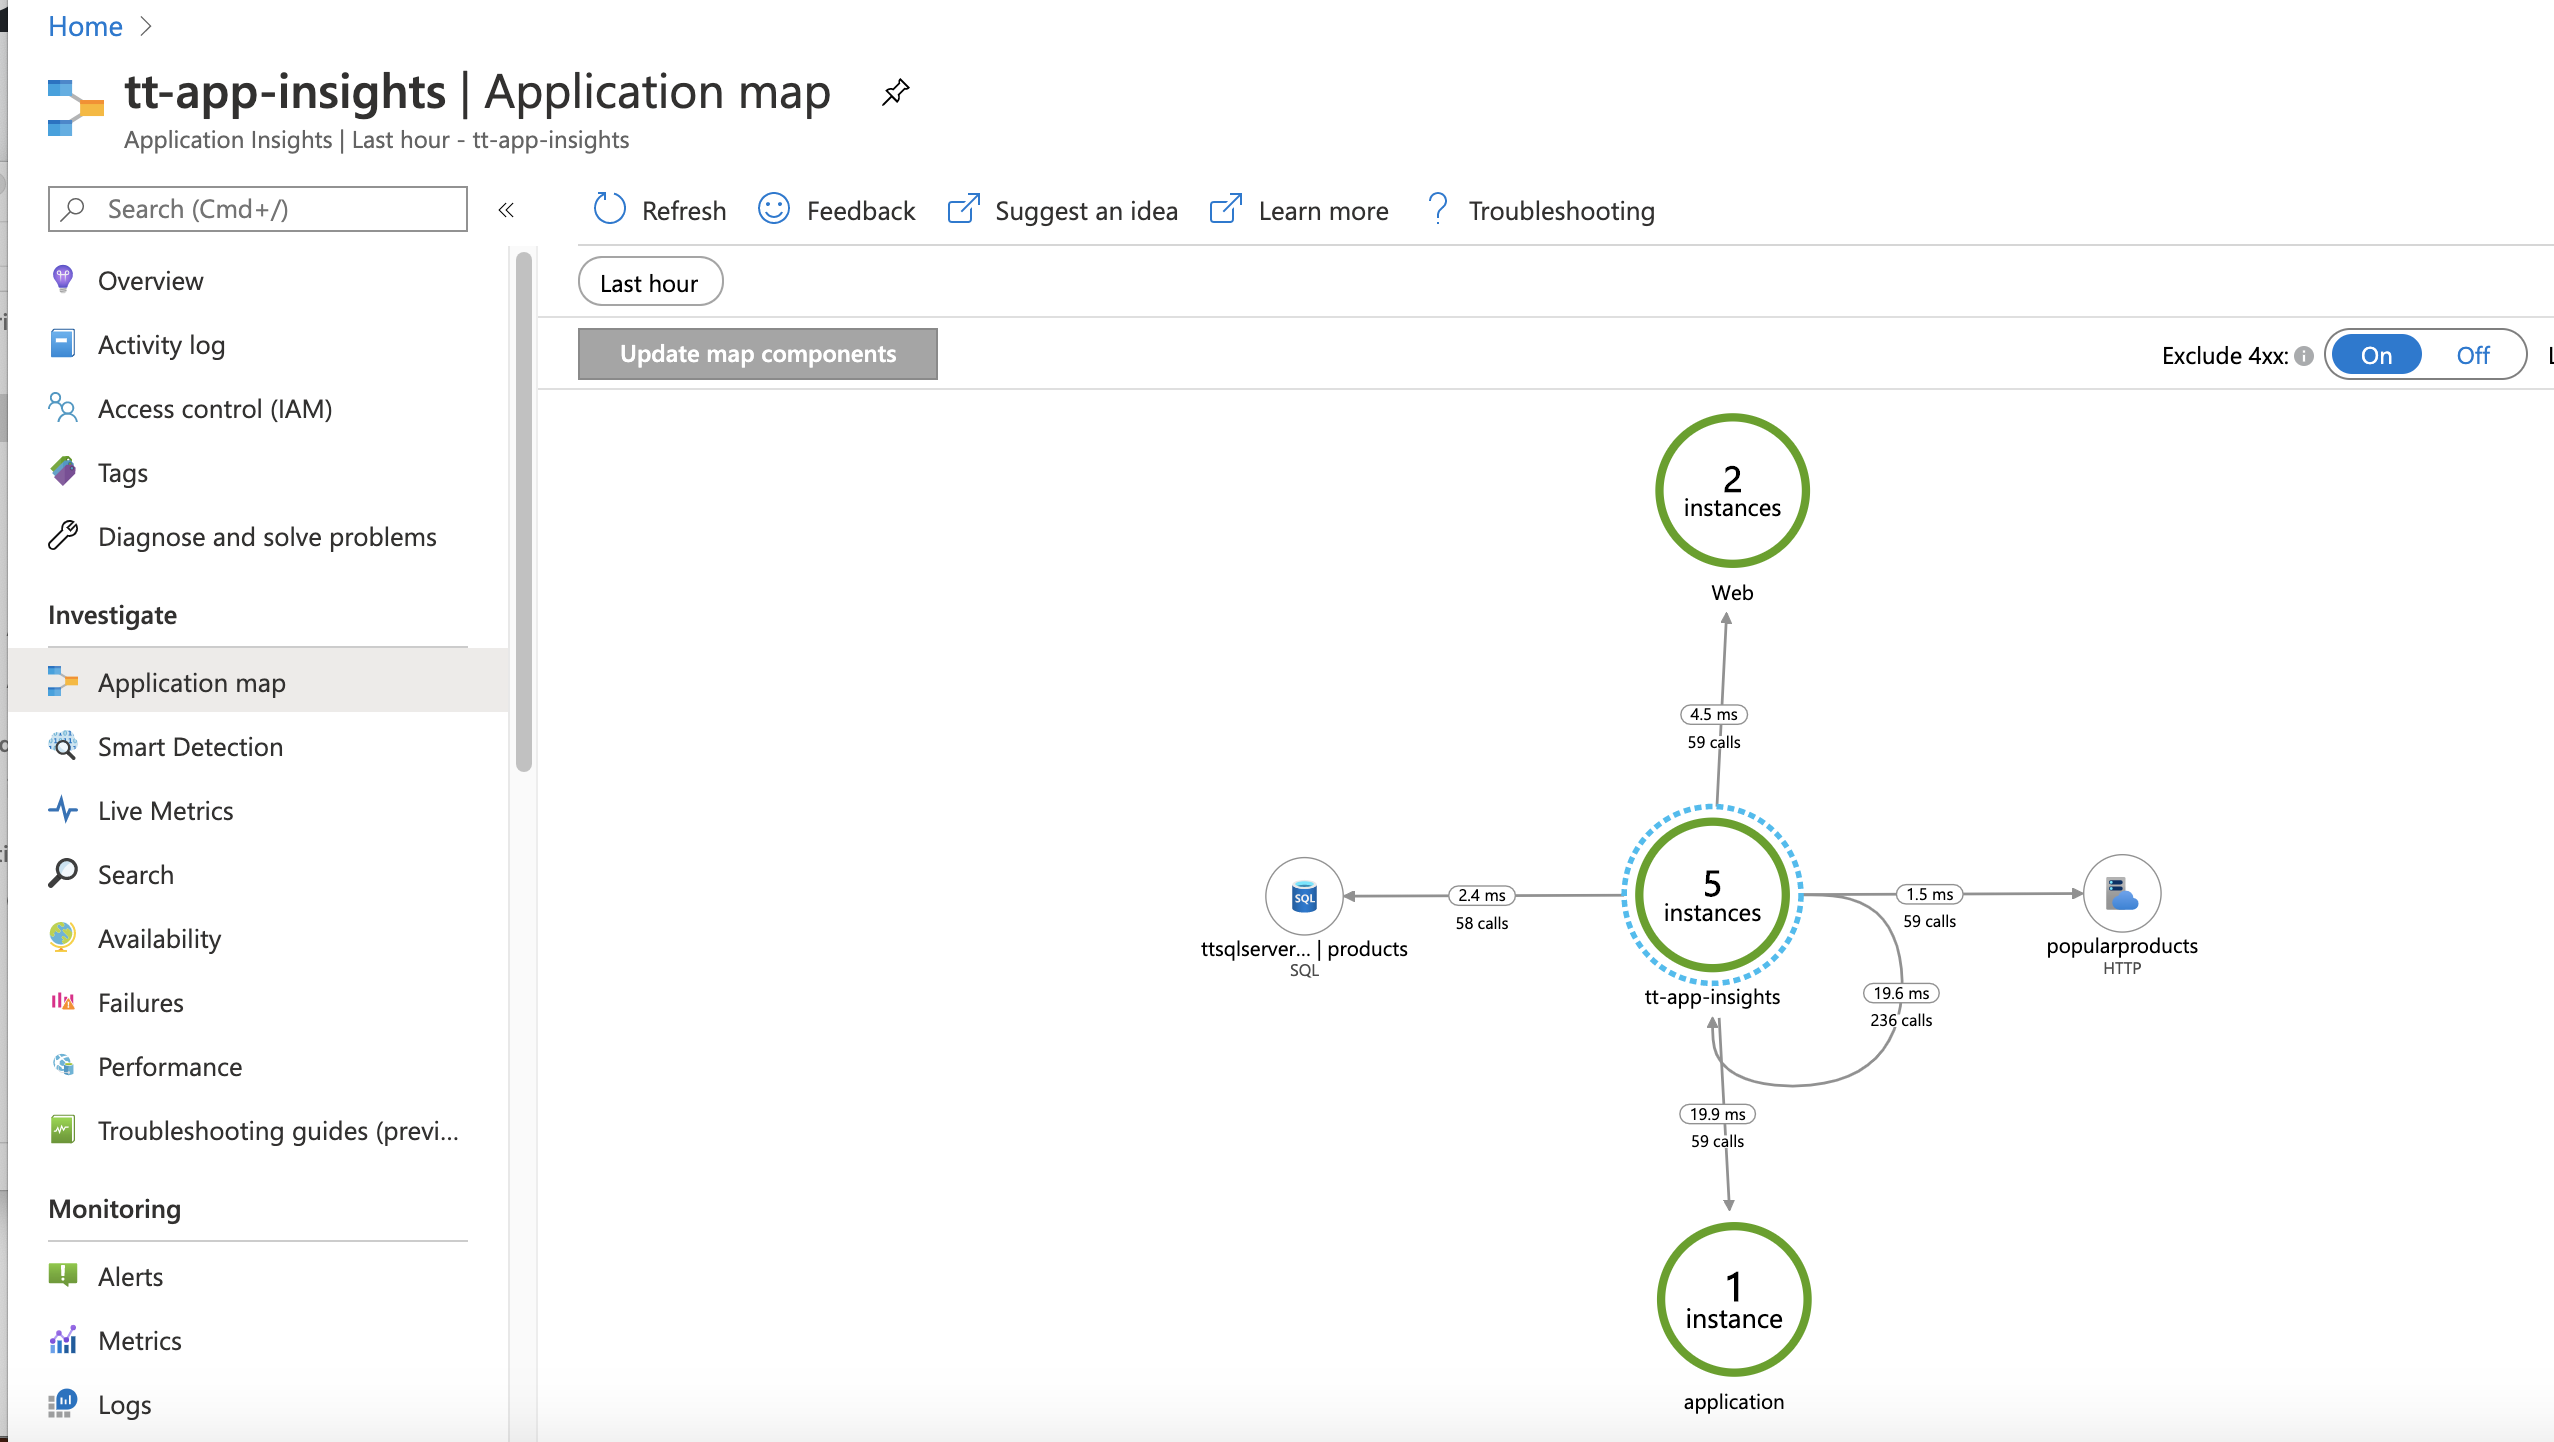
In the preceding picture, you can see not only the components of the application, but also the communication between those components. If you zoom into one of the connections between components, you can see the number of calls made between components and the average latency for those calls. You can also see a representation of the number of successful and the number of failed calls. If you select any of these map elements, Application Insights lets you drill into the information to see detailed statistics on performance and success/failure metrics for those calls. This can be a great way to get a good sense of the larger picture of the application's components and how they function as a baseline. As a reminder, be sure to explore your application map and all that Application Insights can offer before you have an outage.
Azure Resource Graph
Application Insights is a great way to gain some operational awareness for an application, but what if you want to get a view from even higher up and see all of the resources you have in play on Azure in a subscription? In the past, you'd download reports or write PowerShell to gather this information, but now there's a much easier way.
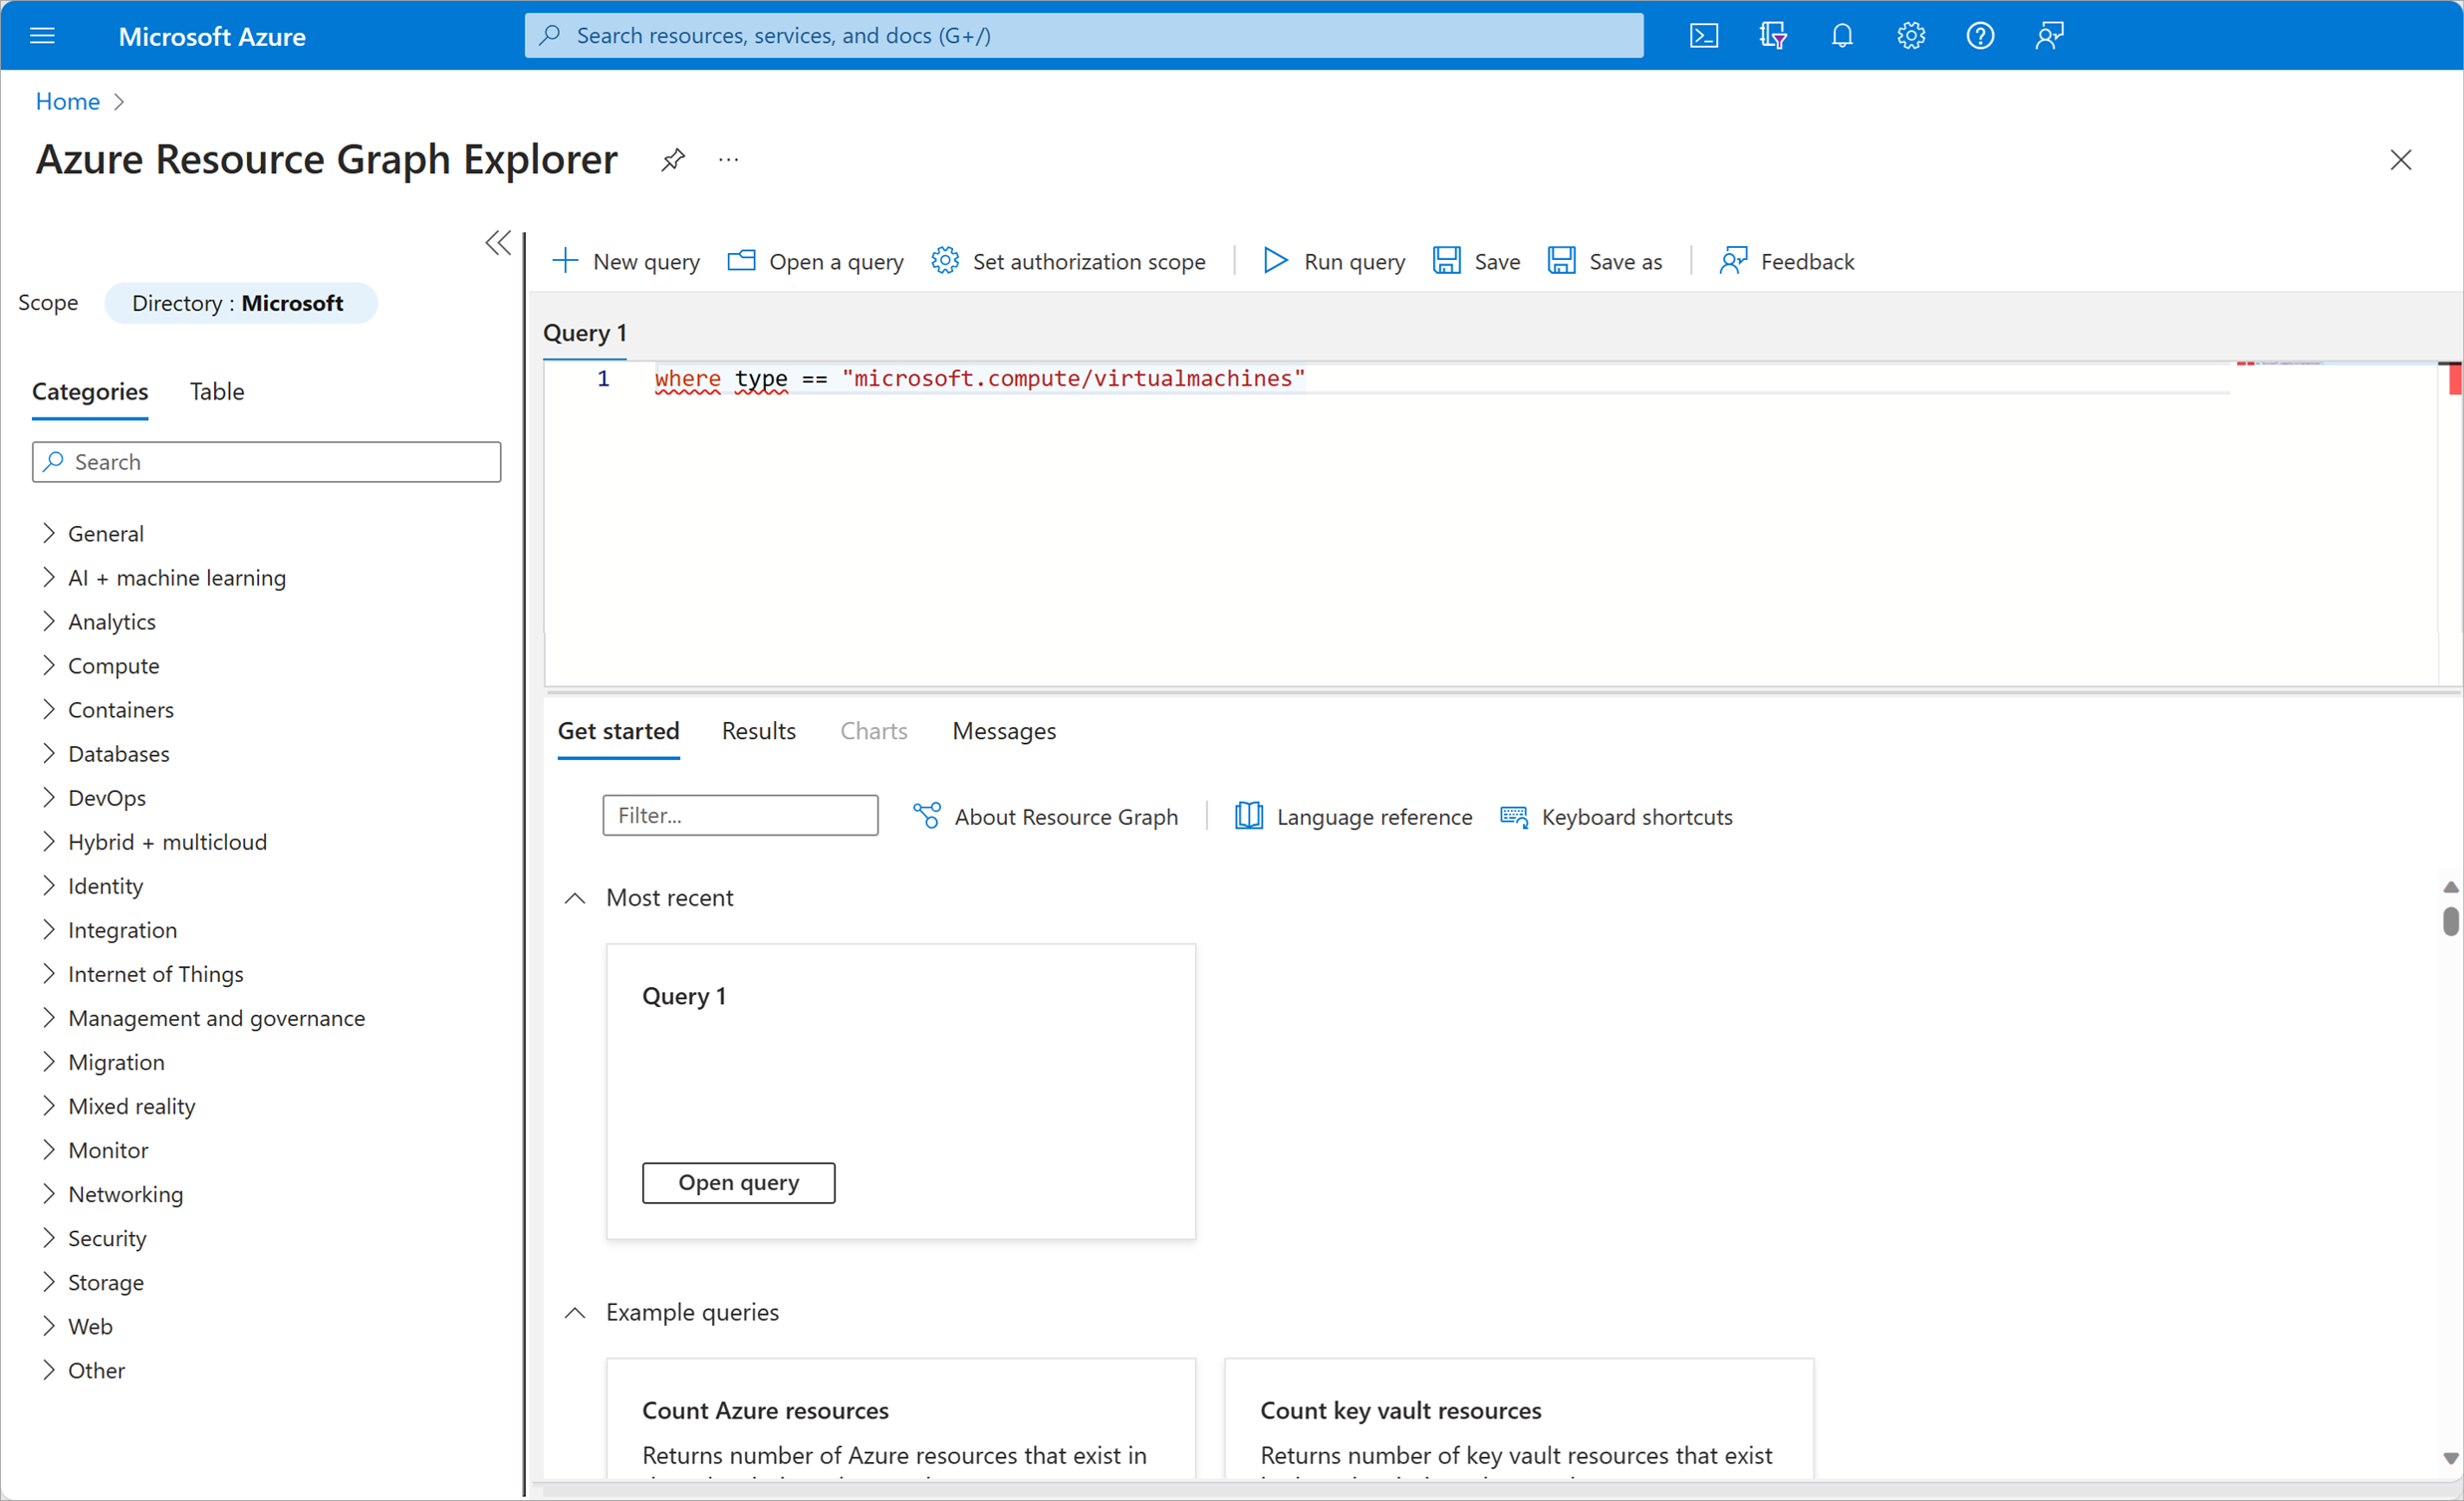
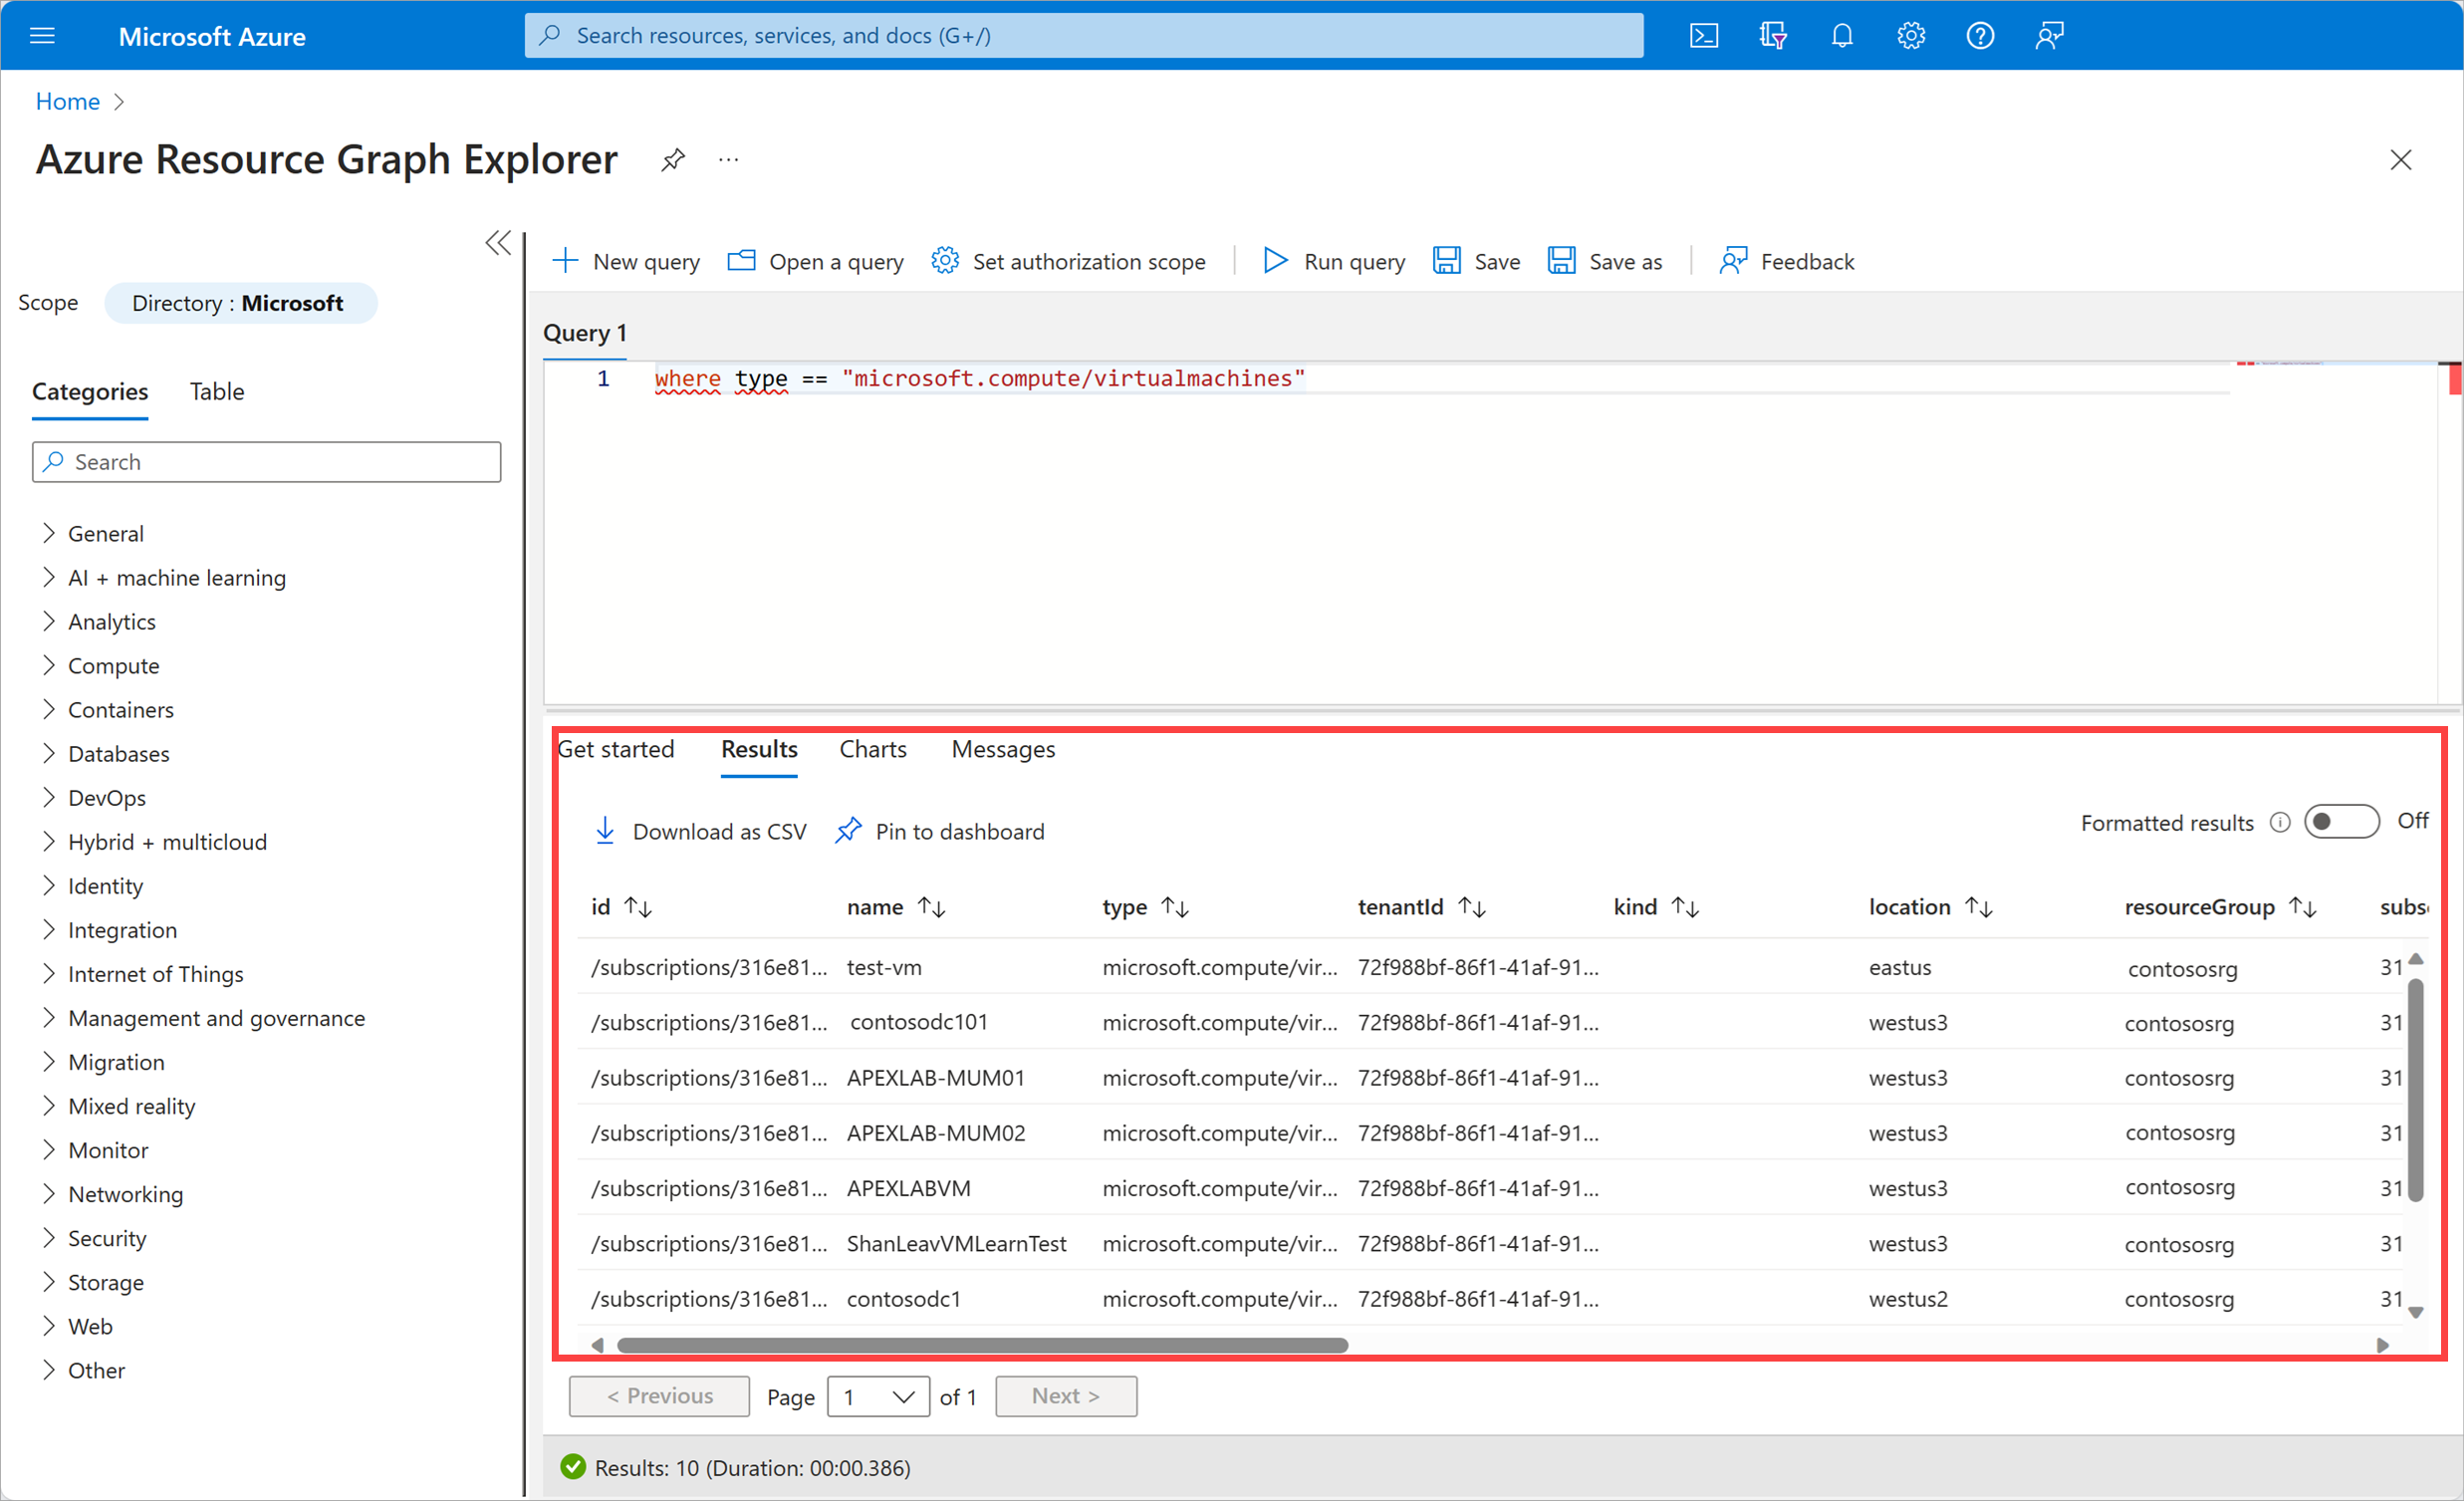
Azure Resource Graph Explorer provides an interactive query environment right from the Azure portal for the data you need. It lets you run arbitrary queries that return real-time answers based on the resources currently in use. For example, if you to see all of the VMs you're currently running, you could run the following query:
and you'd get back a complete detailed list of the VMs being used in our subscription:
The query language used in this environment is Kusto Query Language (KQL). We'll be discussing it in more depth later in this module when we talk about Azure Monitor Log Analytics.
Dashboards
The most traditional operations tool for operational awareness is the venerable dashboard. Often when we think of people doing operations, we imagine them sitting in front of large monitors intensely peering into dashboards full of graphs, charts and counters. In this module, we're not going to explore how you construct, edit and use dashboards. That is largely done by pinning content from other places in the portal and then moving them around as you see fit.
Instead, let's look at two dashboard features less commonly used that could be of real benefit to you. You can find these features at the top of every dashboard.

The two highlighted arrows allow you to upload and export JSON representations of dashboards.
First, let's start with the export functionality. If you select Export, then select Download, a JSON file that represents the current dashboard is downloaded to your computer. If you'd like, try this now by logging into the portal, choosing Dashboard from the product menu, and then selecting Export > Download.
There are at least two things you can do with this file that you might find handy:
You could check this file into your source control system. This allows you to keep track of your different versions of dashboards, and also allow others to access them if they would like to use your dashboard. Some might call this "dashboards as code."
You can use this file as the basis of a new dashboard. Here's a concrete example we'll revisit later in this learning path: let's say you need to show a colleague what a particular dashboard looked like for an hour during an outage that happened last week. You could publish your dashboard and ask them to go select the precise time and time period. But far easier and less error prone, you could download your dashboard set up exactly as you need and share that JSON file. If you want to highlight a second period from the same dashboard, let's say an hour in the future, it's easy to edit the JSON.
That's the export functionality. Now, let's focus on the uses for the upload functionality. Besides being able to load the version-controlled or edited files from the last section, you can use the upload functionality to make use of other people's careful work when constructing dashboards.
Let's look at final example for this section that nicely ties together two of the ideas from this unit. If you download this JSON file:
to your computer and then upload it to a dashboard, you should see something like this:
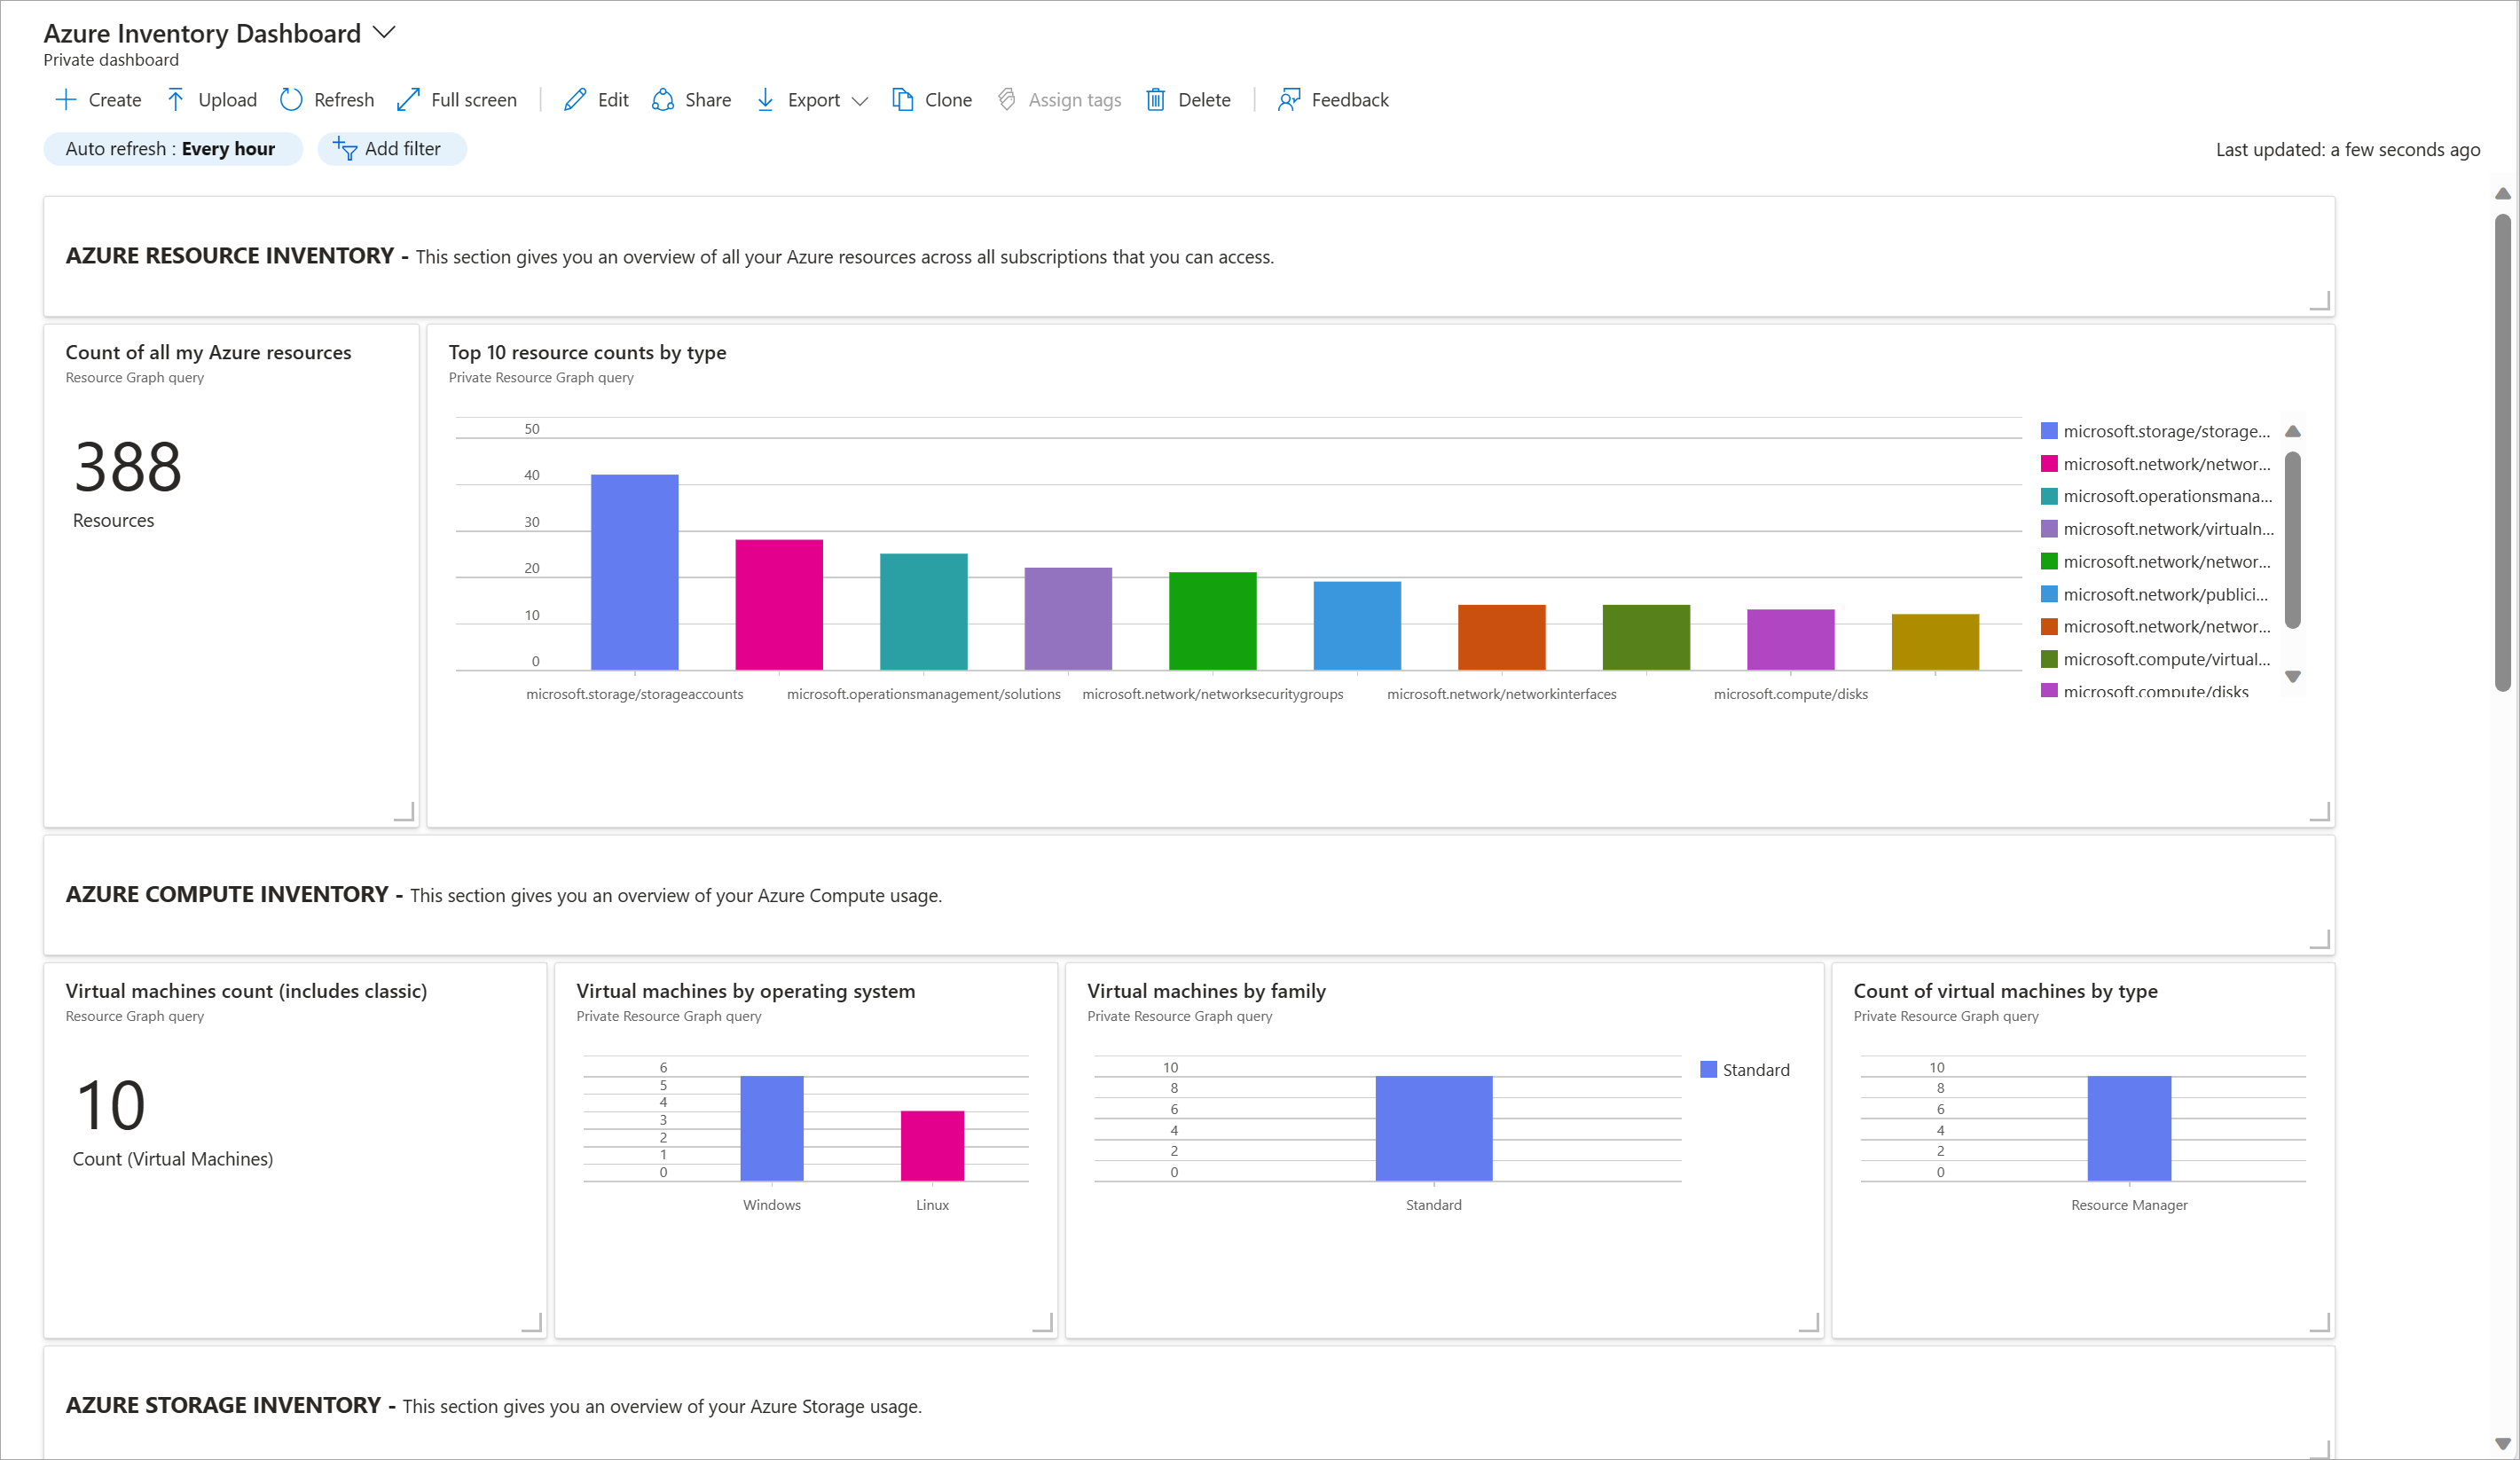
You now have a live dashboard that shows you a fairly comprehensible inventory of your resources in use in a subscription. This dashboard's data is coming from the same source as the Azure Resource Graph Explorer we looked at earlier. In fact, if you select one of tiles, you can see (and edit if desired) the exact query that'ss being run to yield the information show in that square. Excellent, no?
With that help for our operational awareness, let's begin to explore just what we'll want to monitor to assist us with improving our reliability.