Log analytics and KQL queries
As we start to pay attention to our services' reliability, we need a way to track how well (or not well) they're doing. Often, we can find this information in a service's logs, so we're going to need a tool to work with those logs. Log Analytics is the tool we'll be using in Azure for this purpose. It allows us to query this data and display it in ways that are useful to our reliability work.
The log analytics query process involves writing queries in the Kusto Query Language (KQL). If you've ever worked with any other query language (for example, Structured Query Language, which most people know by its acronym, SQL) you'll have no problem picking up KQL. Even if you haven't, once you see how it works, basic KQL queries will likely come pretty easy to you.
How Log Analytics works
So, let's see how this is all going to work. Here's a diagram about how Log mAnalytics works:
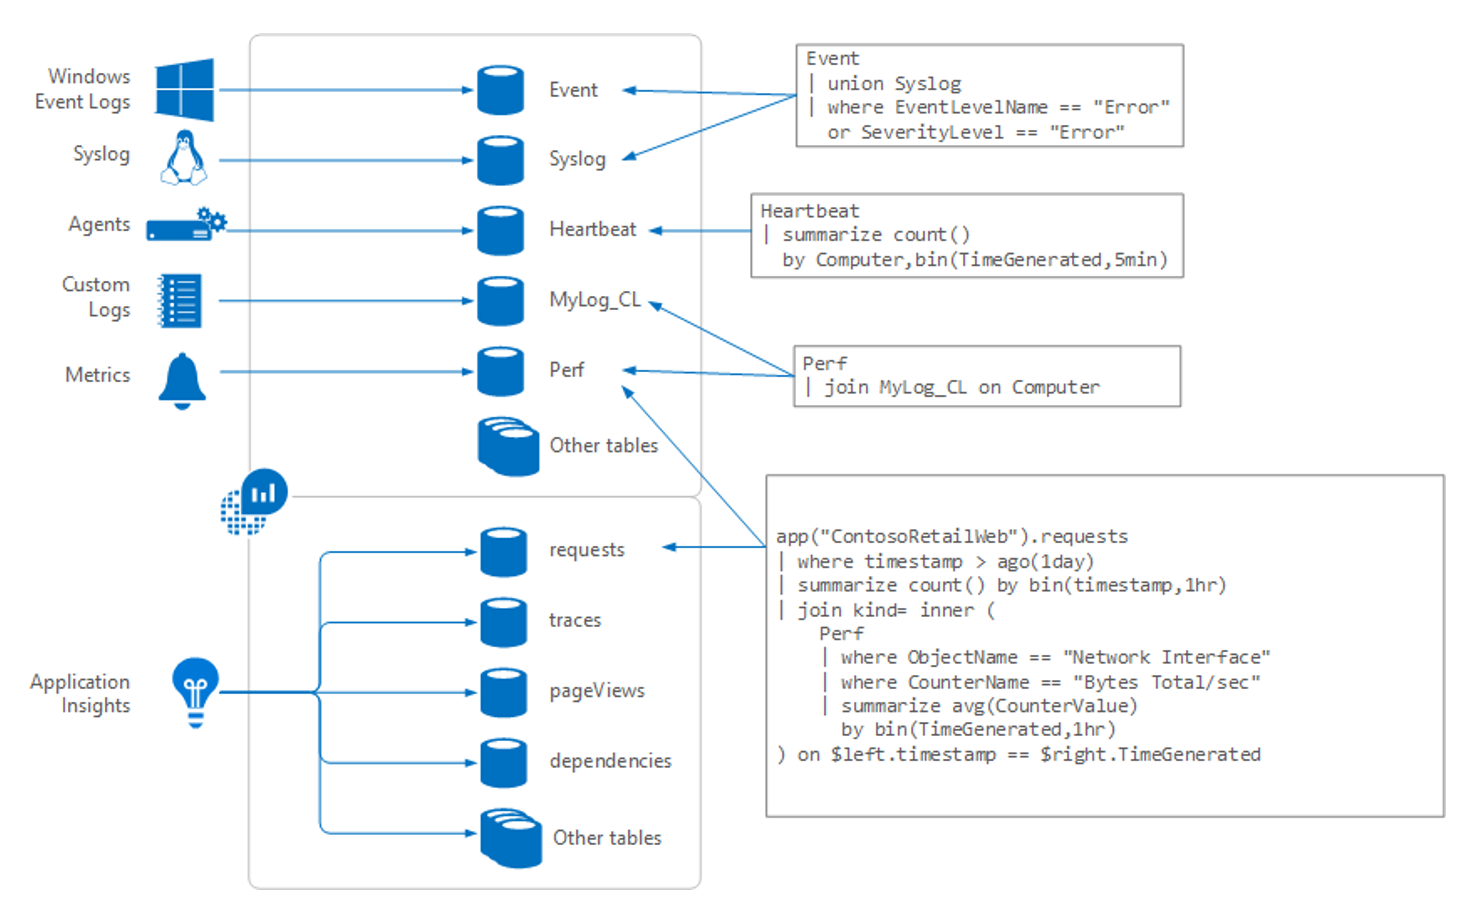
Data for Log Analytics comes in from a number of sources, including:
- Windows event logs
syslogon Linux machines- Agents running on VMs
- Custom logs people choose to send in
- Metrics from Azure resources
- Telemetry info from Application Insights
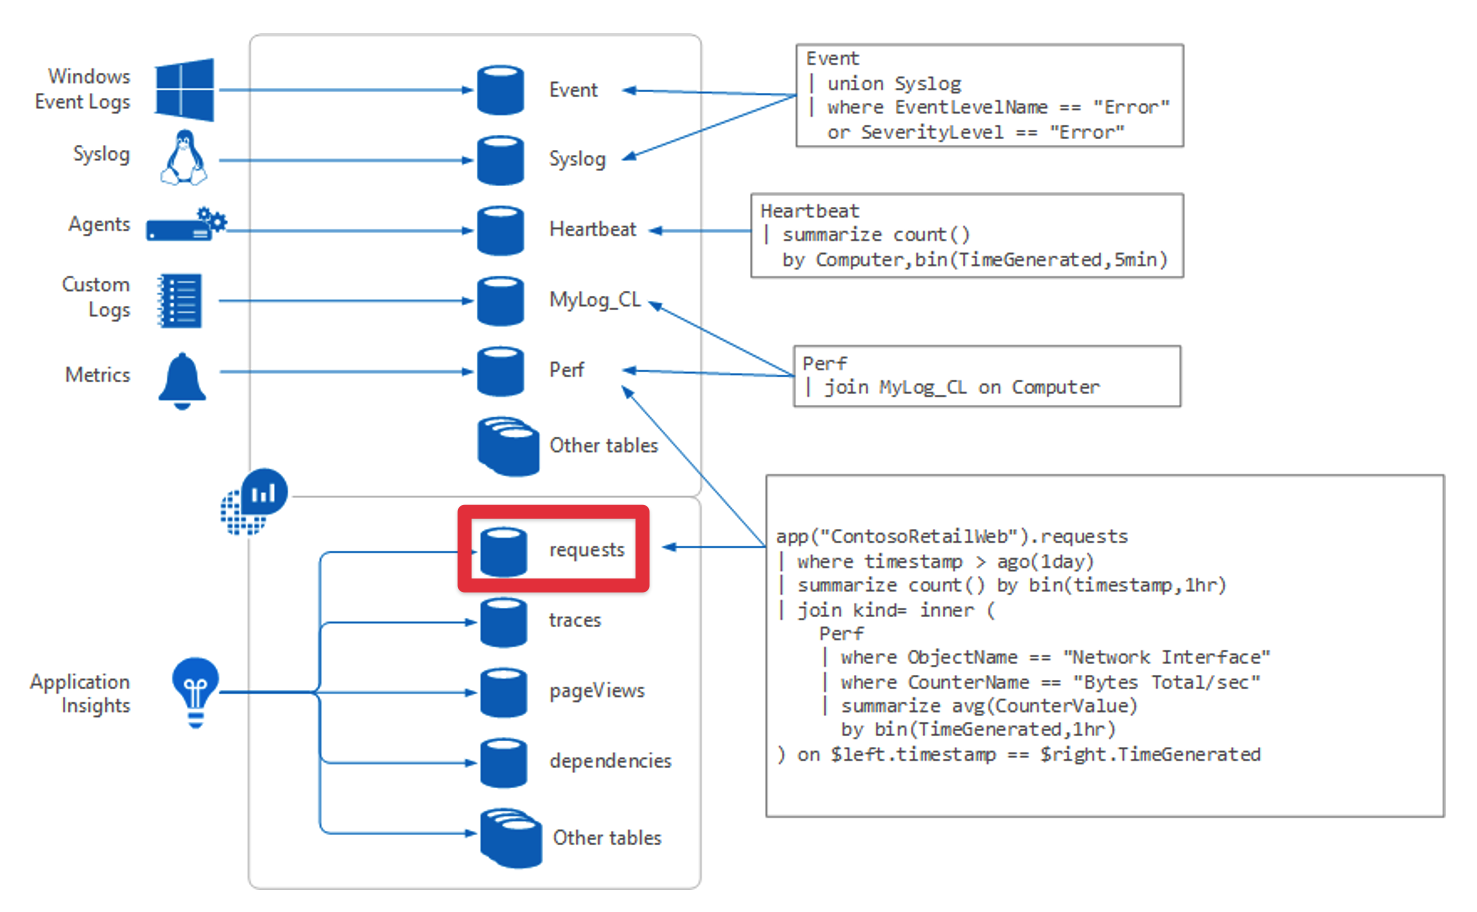
All of this information comes into what Log Analytics calls tables. You can think of each table as a separate database. You'll be writing queries to pull the information from the tables. For the examples we'll show later in this module, we'll be working primarily with a table called "requests."
Log Analytics interface
The following graphic shows the different parts of the Log Analytics interface.
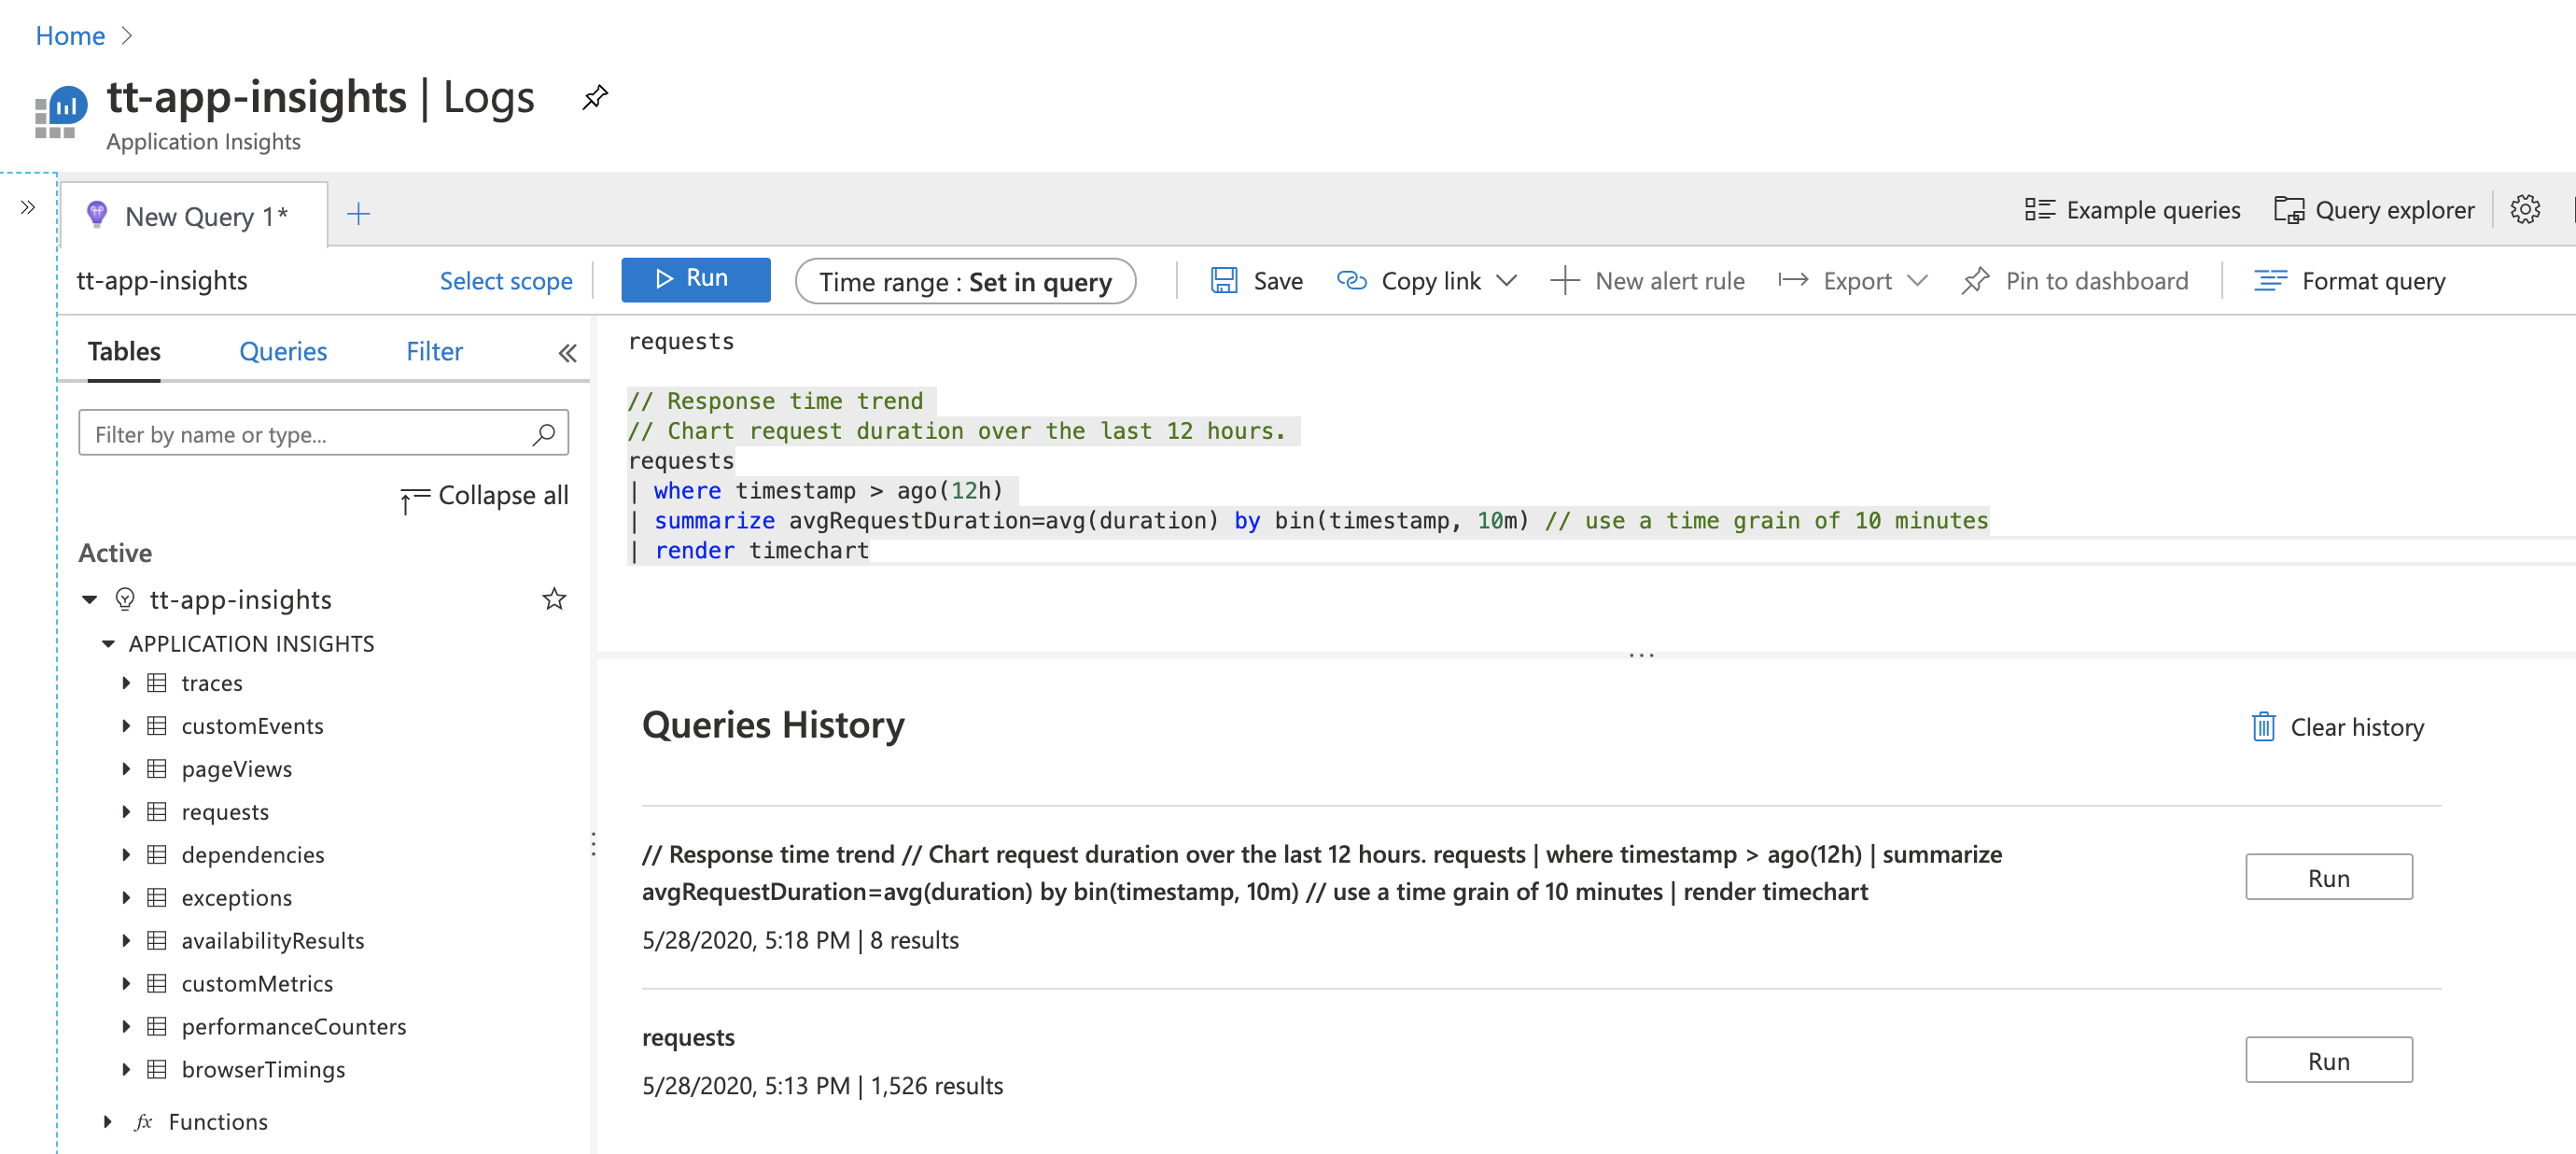
On the left is a section of the screen that makes sure you never get lost when using Log Analytics. It shows the tables with which you're potentially working, and if you expand a section, you’ll see a listing of the fields in that table that are available to query. If you select any of the fields or the table name, it will be copied into the query construction area.
The query construction area is at the top. This is where you specify a query and run it. You can provide a timeframe for the data if it isn’t already specified as part of the query. You can save queries or open additional tabs if you want to work on several queries at a time.
At the bottom of the page is more useful information. Here, Log Analytics shows you previous queries you ran, which can be helpful if you need to return to something you’ve already specified previously; for example, if you were working on a query, tried something, and had to backtrack.
Writing KQL queries
KQL is a powerful query language. We're only going to scratch the surface with some basic queries so you can see how easy it is to use. Later on, if you'd like to dive deeper to use some of the more advanced features (including some machine learning functionality), be sure to check out the Log Analytics tutorial.
Let's start by writing a simple KQL query. Almost all KQL queries begin with the data source; the table you're querying. So, if you were querying data from a "requests" table, you'd start with this in the query area:
Requests
The next part of a KQL query is to connect the table with the operation you want to perform. Use a pipe character (the horizontal bar on the keyboard most commonly found above the slash key) between the table name and the command.
Here's a simple query to sort the table return the top 10 records found:
Requests
|top 10
Here are some examples of other common commands you might use instead of "top 10:"
If you want to see any random 10 records instead of the top 10 (for example, to see the table structure), you can use the following command:
requests
|take 10
To see records that have come in during the last half hour, you can use the following query:
requests
|where timestamp > ago(30m)
Another common task is to specify the order in which the data is to be returned. Here's an example of a query that sorts by a specific field (timestamp) in descending order (for example, most recent data first):
requests
|sort by timestamp desc
As with SQL, you can set multiple conditions to specify which records you want returned. Use additional pipe characters and clauses to add them. The pipe character separates commands so the output of the first one will be the input of the next command. A single query can have any number of commands.
Here's an example of a query that returns all of the 404 response-code records (for example, all of the "page not found" records from a web service) in the last 30 minutes:
requests
|where timestamp > ago(30m)
|where toint(resultCode) == 404
This query is written to maximize efficiency. By first selecting only the records from the last 30 minutes, you drastically reduce the number of records that the second clause has to scan through. If you wrote this query in the opposite order, first it would find all of the 404s from the beginning of time in the data, and then discard the vast majority to give u only the last half an hour's worth. Always consider the order of processing when you write queries with multiple conditions.
One last query example before we return to the power of Log Analytics later in this module to help improve our reliability. Here's a query that shows a calculation based on the data:
requests
|where timestamp > ago(30m)
|summarize count() by name, URL
This query returns a summary of the requests we received in the last half hour. So on a web service, it might tell us that there's been a GET index.html request to the URL http://tailwindtraders.com 2,875 times. We are pausing our look at KQL with this query, because it nicely connects to the KQL queries we'll use in the next unit.