Prepare for growth
You’ve probably heard the saying that preparation is the key to success. This saying is especially true in relation to smooth, successful, reliable growth.
One of the biggest advantages of cloud computing is the ability to scale. This ability has led some to the erroneous assumption that there's no need to prepare or plan for growth in the cloud because it has infinite scale.
It’s true that there are most likely more than enough resources in the cloud to meet your application’s demands. However, there are a couple of reasons why it's still important for you to understand your capacity needs:
Although there are probably plenty of resources in the cloud to meet your needs, not all of the services you consume scale automatically or are inherently scalable. Thus, you need to be aware of service limits, and know when you’re going to need to scale up services and resources.
Cloud resources might be unlimited, but your budget probably isn’t. You have to consider cost, and your friends in the Finance department want to know your forecasted cloud spend.
Plan for organic growth
Organic growth in the business world refers to the process by which organizations expand their own capacity, relying on intrinsic resources and skills to fuel a slower, more natural growth.
The first thing you should do when looking to plan for capacity in the cloud as your business grows organically is to map out the current resource requirements for the larger components in your application.
Scenario: Organic growth
Let’s return to the architecture we reviewed early in this module. Tailwind Traders is about to launch an innovative new product, and is anticipating dramatic growth as a result. Just to remind you, here's what their architecture diagram looks like.
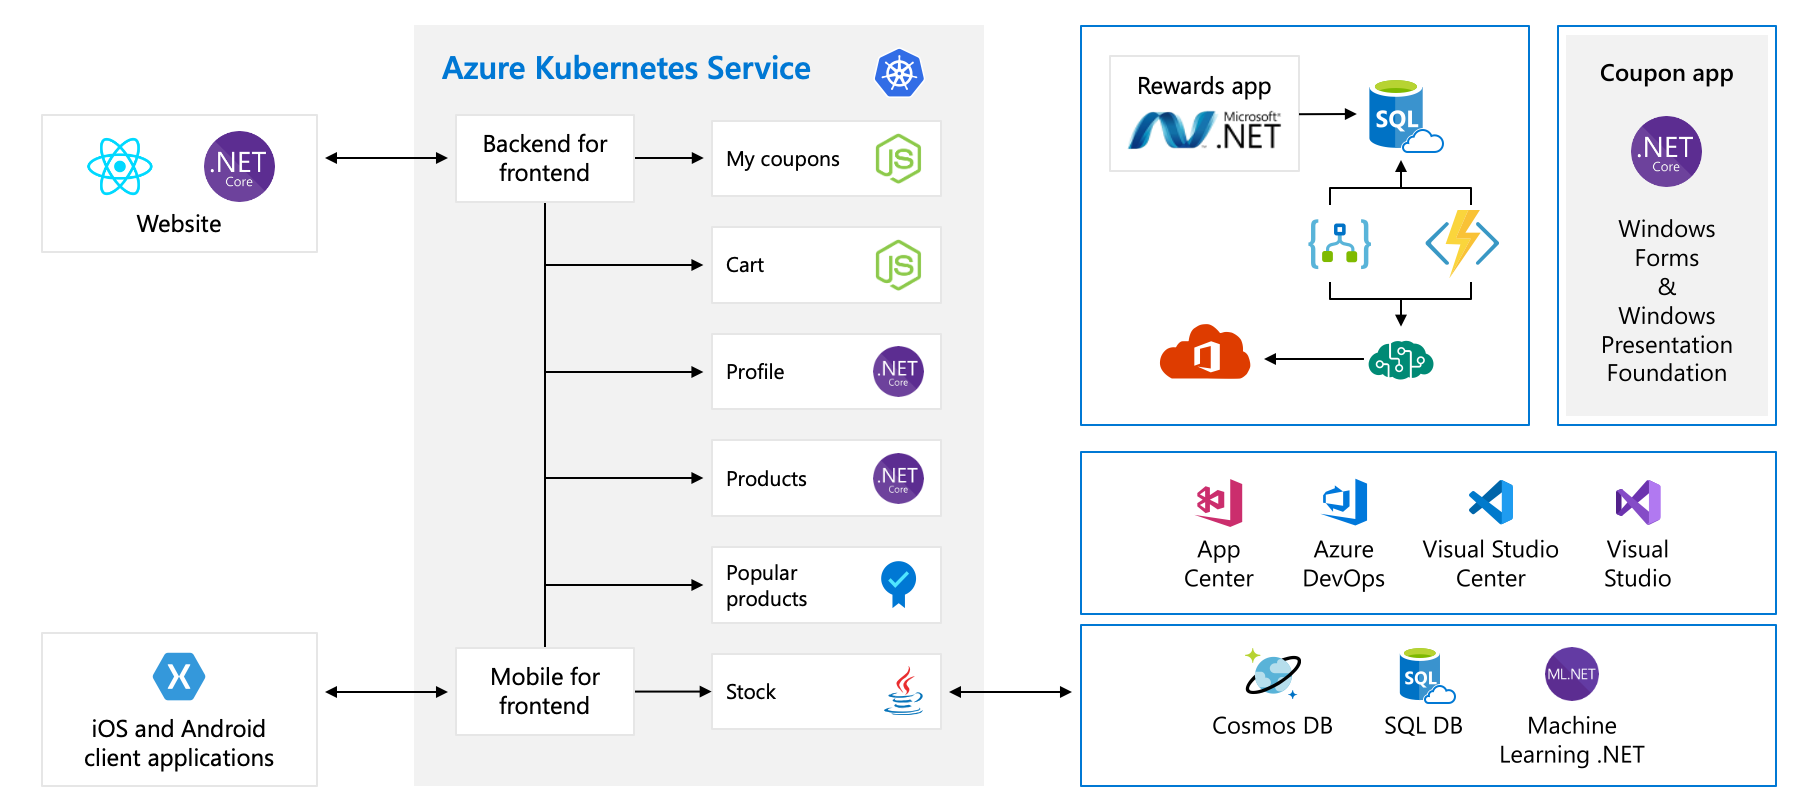
To begin capacity planning, you need to identify the larger components. In this example that includes:
- Azure Kubernetes Service cluster
- Rewards app running in Azure App Service
- Various databases, such as Cosmos DB, Azure SQL and the like.
For each of these large components, you need to understand what the current resource usage is, to help you plan for future usage. Let’s walk through the resource usage for one of these large components.
Measure capacity in Cosmos DB
In Cosmos DB, storage is measured in gigabytes and scales automatically, although you still need to be aware of the measurements for cost reasons.
Throughput is pre-provisioned, and you use a metric called Request Units to measure this throughput. Request Units (RUs) are a mixture of memory, CPU, and IOPS, giving you a single metric by which you can plan capacity. You provision RUs in increments of 100 RUs per second.
Every DB operation is measured in RU/s. Reads are simple: 1-KB read is a single Request unit. Other operations are calculated based on several factors, such as item size, data consistency, query patterns, and so forth.
When you profile your application, every response from Cosmos DB contains the request charge header, informing you exactly how many RUs that request used. You can compare the number of RUs being used to the number that are provisioned to verify that you have more than enough current capacity.
It's good to correlate your resource usage to a business metric such as monthly active users or revenues. This correlation helps you plan for capacity based on how you expect the business to grow. You can retrieve these capacity metrics in Azure Monitor. Understanding the system’s resource usage helps you know when you'll need to scale up and what your costs will be over time.
Let's get concrete, and look at the data from Tailwind Traders use of Cosmos DB. Here's a graph of their usage.
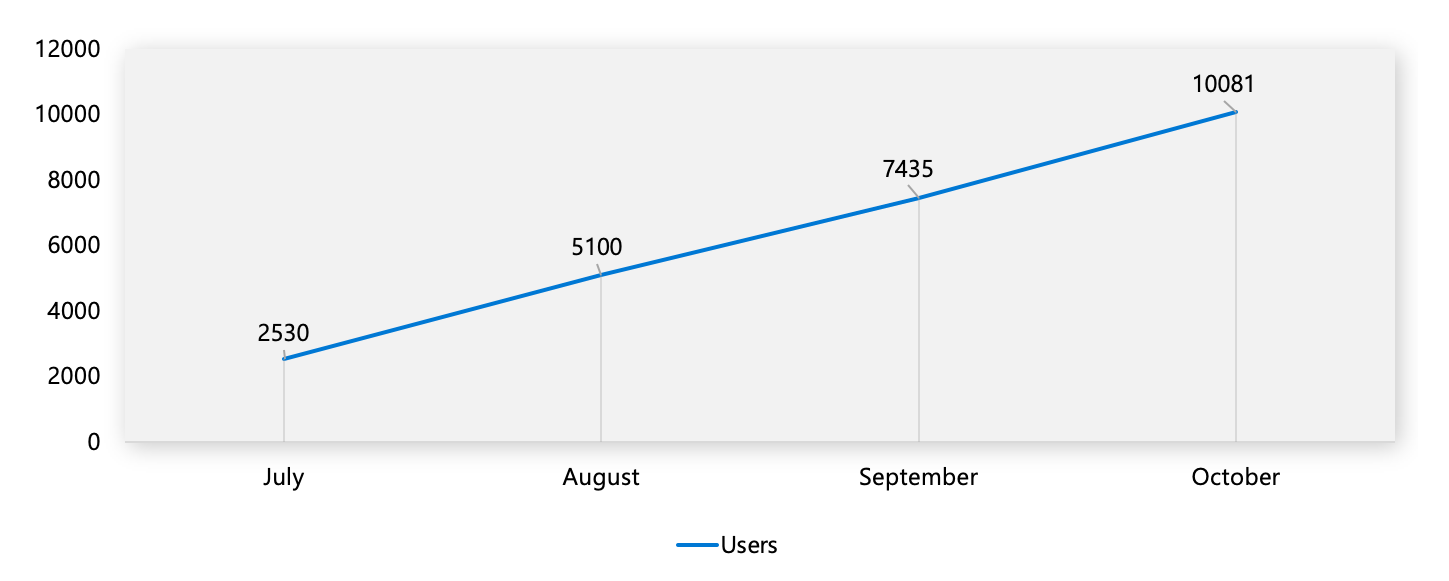
In this example, Tailwind traders are growing at an average of 2,500 monthly active users (MAUs) with a current user base of 10,000.
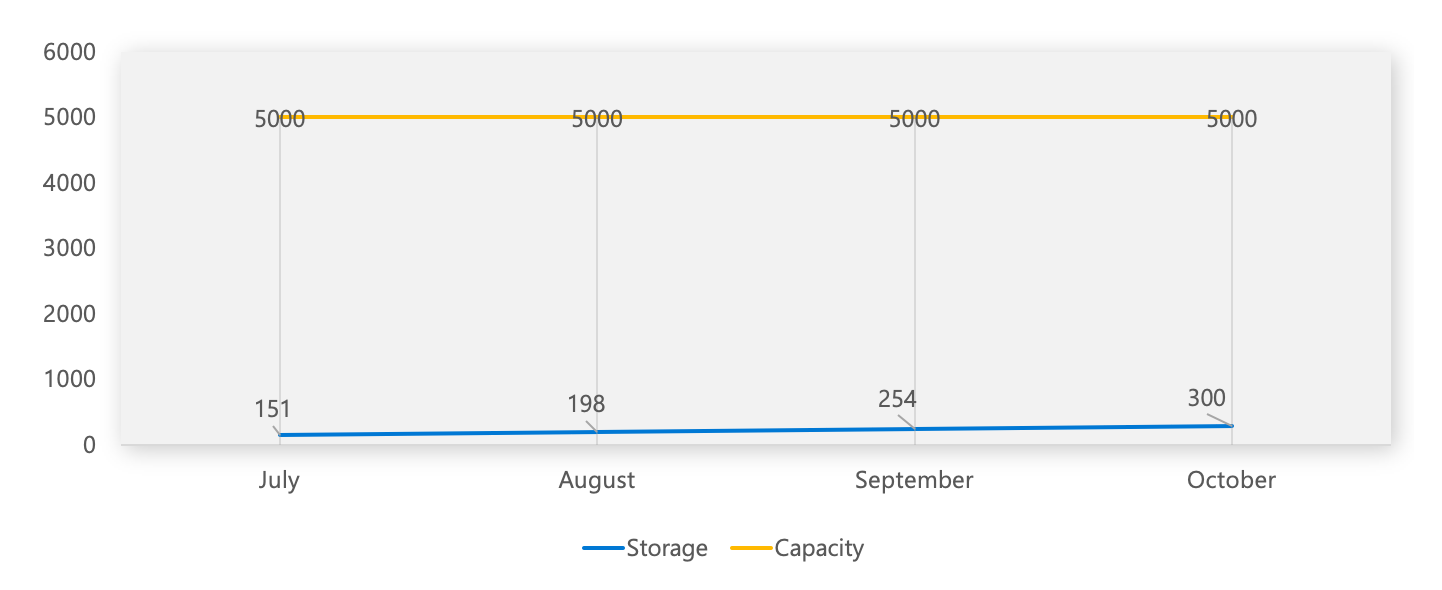
If we look at storage, we can see their database is using 300 GB of the 5 TB available (6%). It's growing at 1% or 50 GB/Month.
From a throughput perspective, it's sitting at 300/1000 and growing at 10%/month:

Now that we Understand our systems resource metrics, we know when we're likely to have to scale our throughput, and also what our costs will be over time.
We can now produce a graph that helps us with capacity planning.
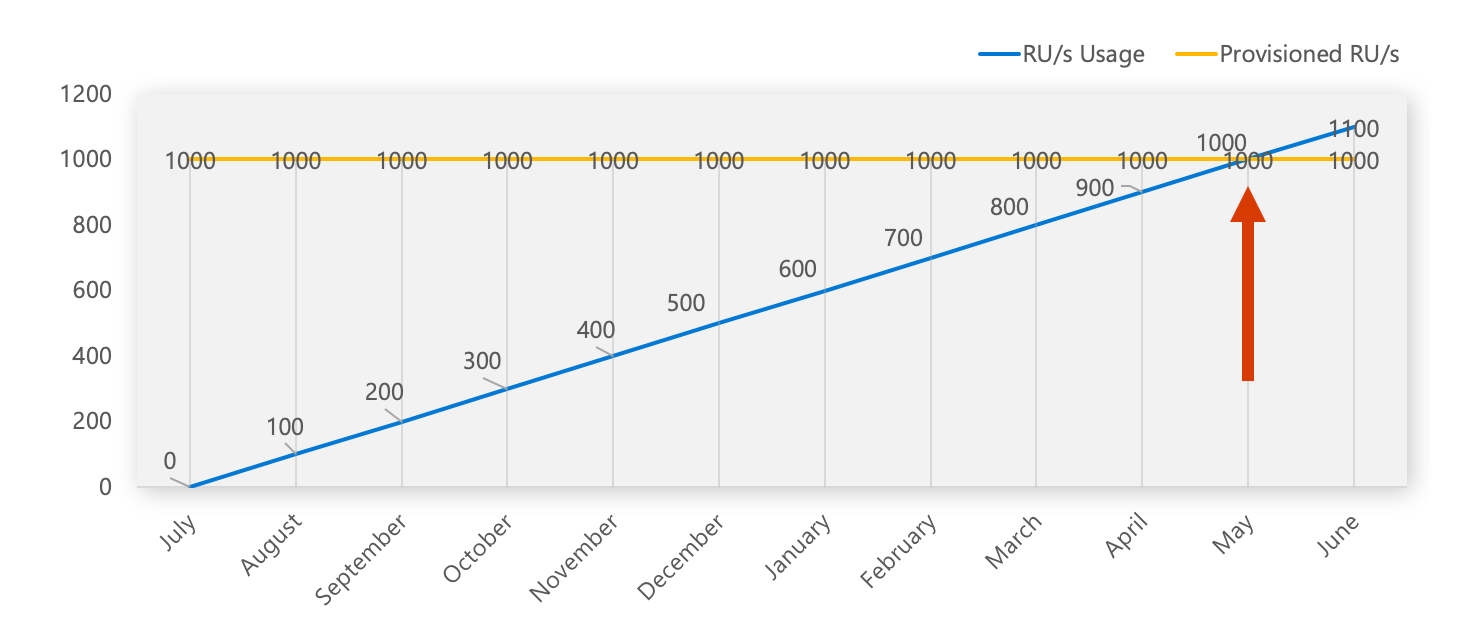
Now we know that in May, we're going to reach the capacity of RUs on our database, so we need to scale before then. One other interesting insight is that they could maybe even scale down their Cosmos DB database right now as they aren’t using anywhere near the pre-provisioned capacity.
Plan for inorganic growth
In the previous example, you were planning for organic growth. Inorganic growth arises from external factors rather than an increase in the company’s own business activities. Instead of being a natural progression, it tends to involve a more sudden and larger increase in usage.
Sometimes, you really don’t know ahead of time about an increase in traffic, users, and so on. In anticipation of such cases, you need to build your system to be as scalable as possible automatically, and to fail gracefully when that isn’t possible. We address that later in this module.
For other times, as with an upcoming product launch, you may experience inorganic growth for which you can plan and prepare. If your teams work together across engineering, product, marketing and finance, and you know how to obtain your resource usage and growth patterns. You can make a reasonable effort to predict the impact of these events on your resource requirements and implement change accordingly.
Getting this right is specific to your organization and the particular event. You may not always get it right, but being as prepared as you can be gives you a head start.
Scenario: Inorganic growth
Let’s look at another hypothetical situation as an example of planning for inorganic growth. There's an upcoming marketing event for the launch of a high-profile innovative new product at Tailwind Traders. They're expecting that to drive 5000 more users to their sales site.
By using data from the previous example of organic growth, and correlating it, hopefully with causation, to a business metric you have obtained from your product/marketing teams (for example, number of users). You can start to plan for inorganic growth.
You know from the previous scenario that for 2500 users you need approximately 50 GB of storage and 100 RUs. You can now use that data and determine whether you’re ready for this event. If we can expect 5000 users, that's going to require 100 GB of storage and 200 RU/s.
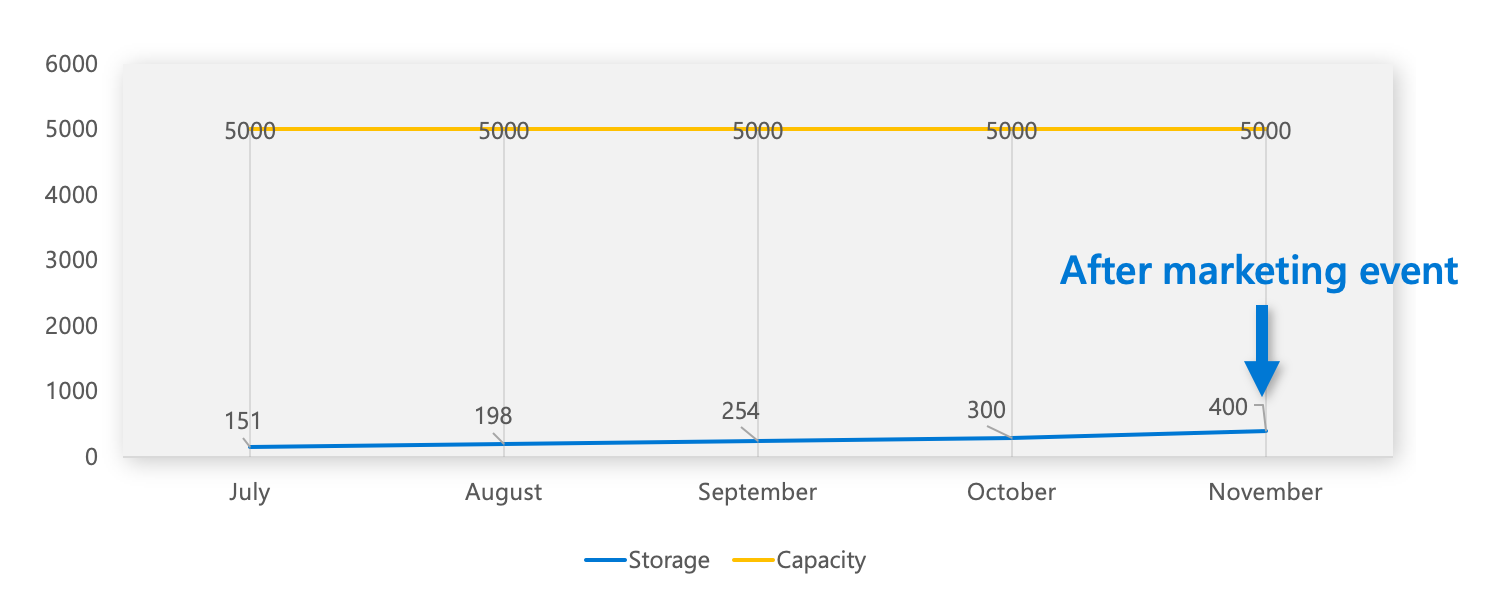
We can see that the storage capacities are more than sufficient for the growth expected from the event. These capacities scale automatically for you, so there's no worry here except for understanding the new costs, which are addressed later.
You can also predict that their RUs only reach 50% capacity following the event. So, they have no worries in terms of Cosmos DB capacity for this event.
There will, however, be an impact on cost.
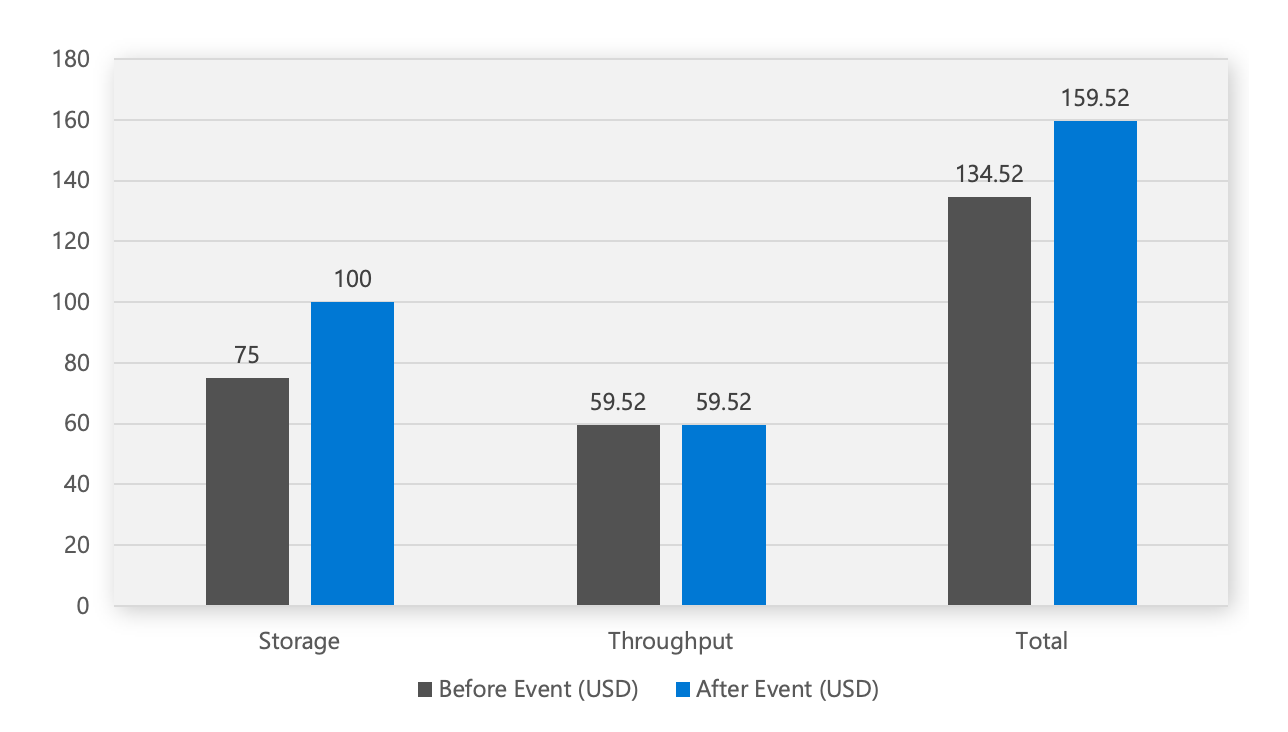
You can see that the 100 GB of extra storage is going to cost an extra $25/month. The throughput price stays the same as customers pay for provisioned RUs, and they already have more than enough. The bottom line is that this marketing event is likely to increase their CosmosDB bill by $25 USD.