Optimize your Azure reservation use to save money
If your organization has purchased Azure reservations, then the Microsoft Cost Management Power BI app can help you manage them, view cost-saving recommendations, and maximize your reservation use. The VM RI Coverage reports provide recommendations for VM RI purchases even if you haven't already made any reservation purchases.
You save the most money when a reservation is fully used. When a reservation isn't fully used, your maximum possible savings are reduced.
The following sections describe reports included in the Microsoft Cost Management Power BI app.
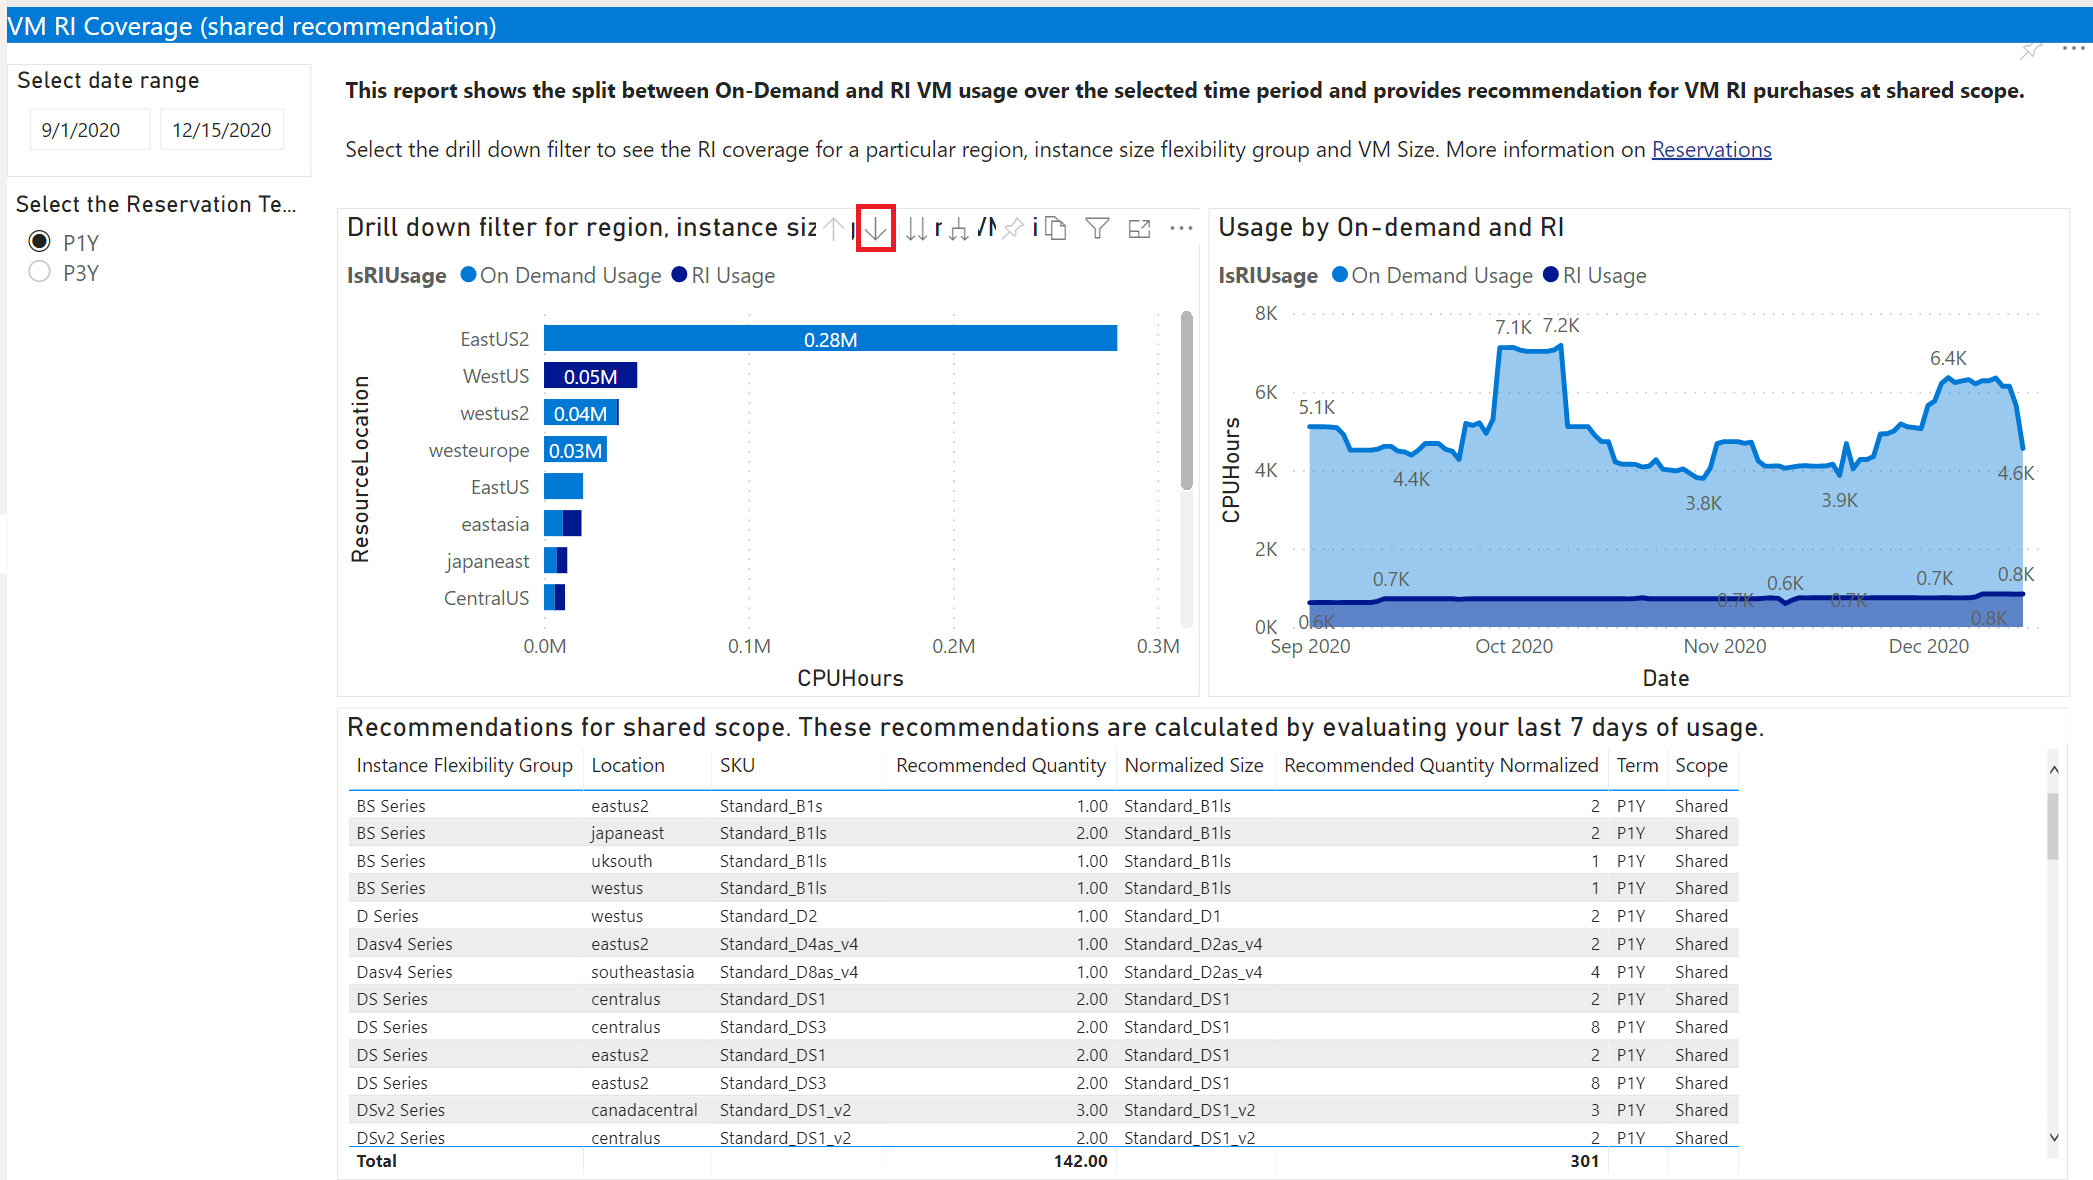
VM RI Coverage (shared recommendation)
The report provides recommendations for VM RI purchases at a shared scope, even if you haven't made any reservation purchases. The report is split between on-demand VM usage and RI VM usage over the selected period.
To use the report, select the drill-down filter, as marked in the following image.
Select the region that you want to analyze, then select the instance size flexibility group, and so on.
For each drill-down level, the following filters are applied to the report:
- The coverage data is the filter showing how much usage is charged using the on-demand rate versus how much is covered by the reservation. Current reservation usage is shown in dark blue, while more expensive on-demand usage is shown in light blue.
- Recommendations are also filtered.
The table of recommendations below the graphs provides recommendations for reservation purchases based on the VM sizes used.
The Normalized Size and Recommended Quantity Normalized values help you normalize the purchase to the smallest size for an instance size flexibility group. The information is helpful if you plan to purchase just one reservation for all sizes in the instance size flexibility group.
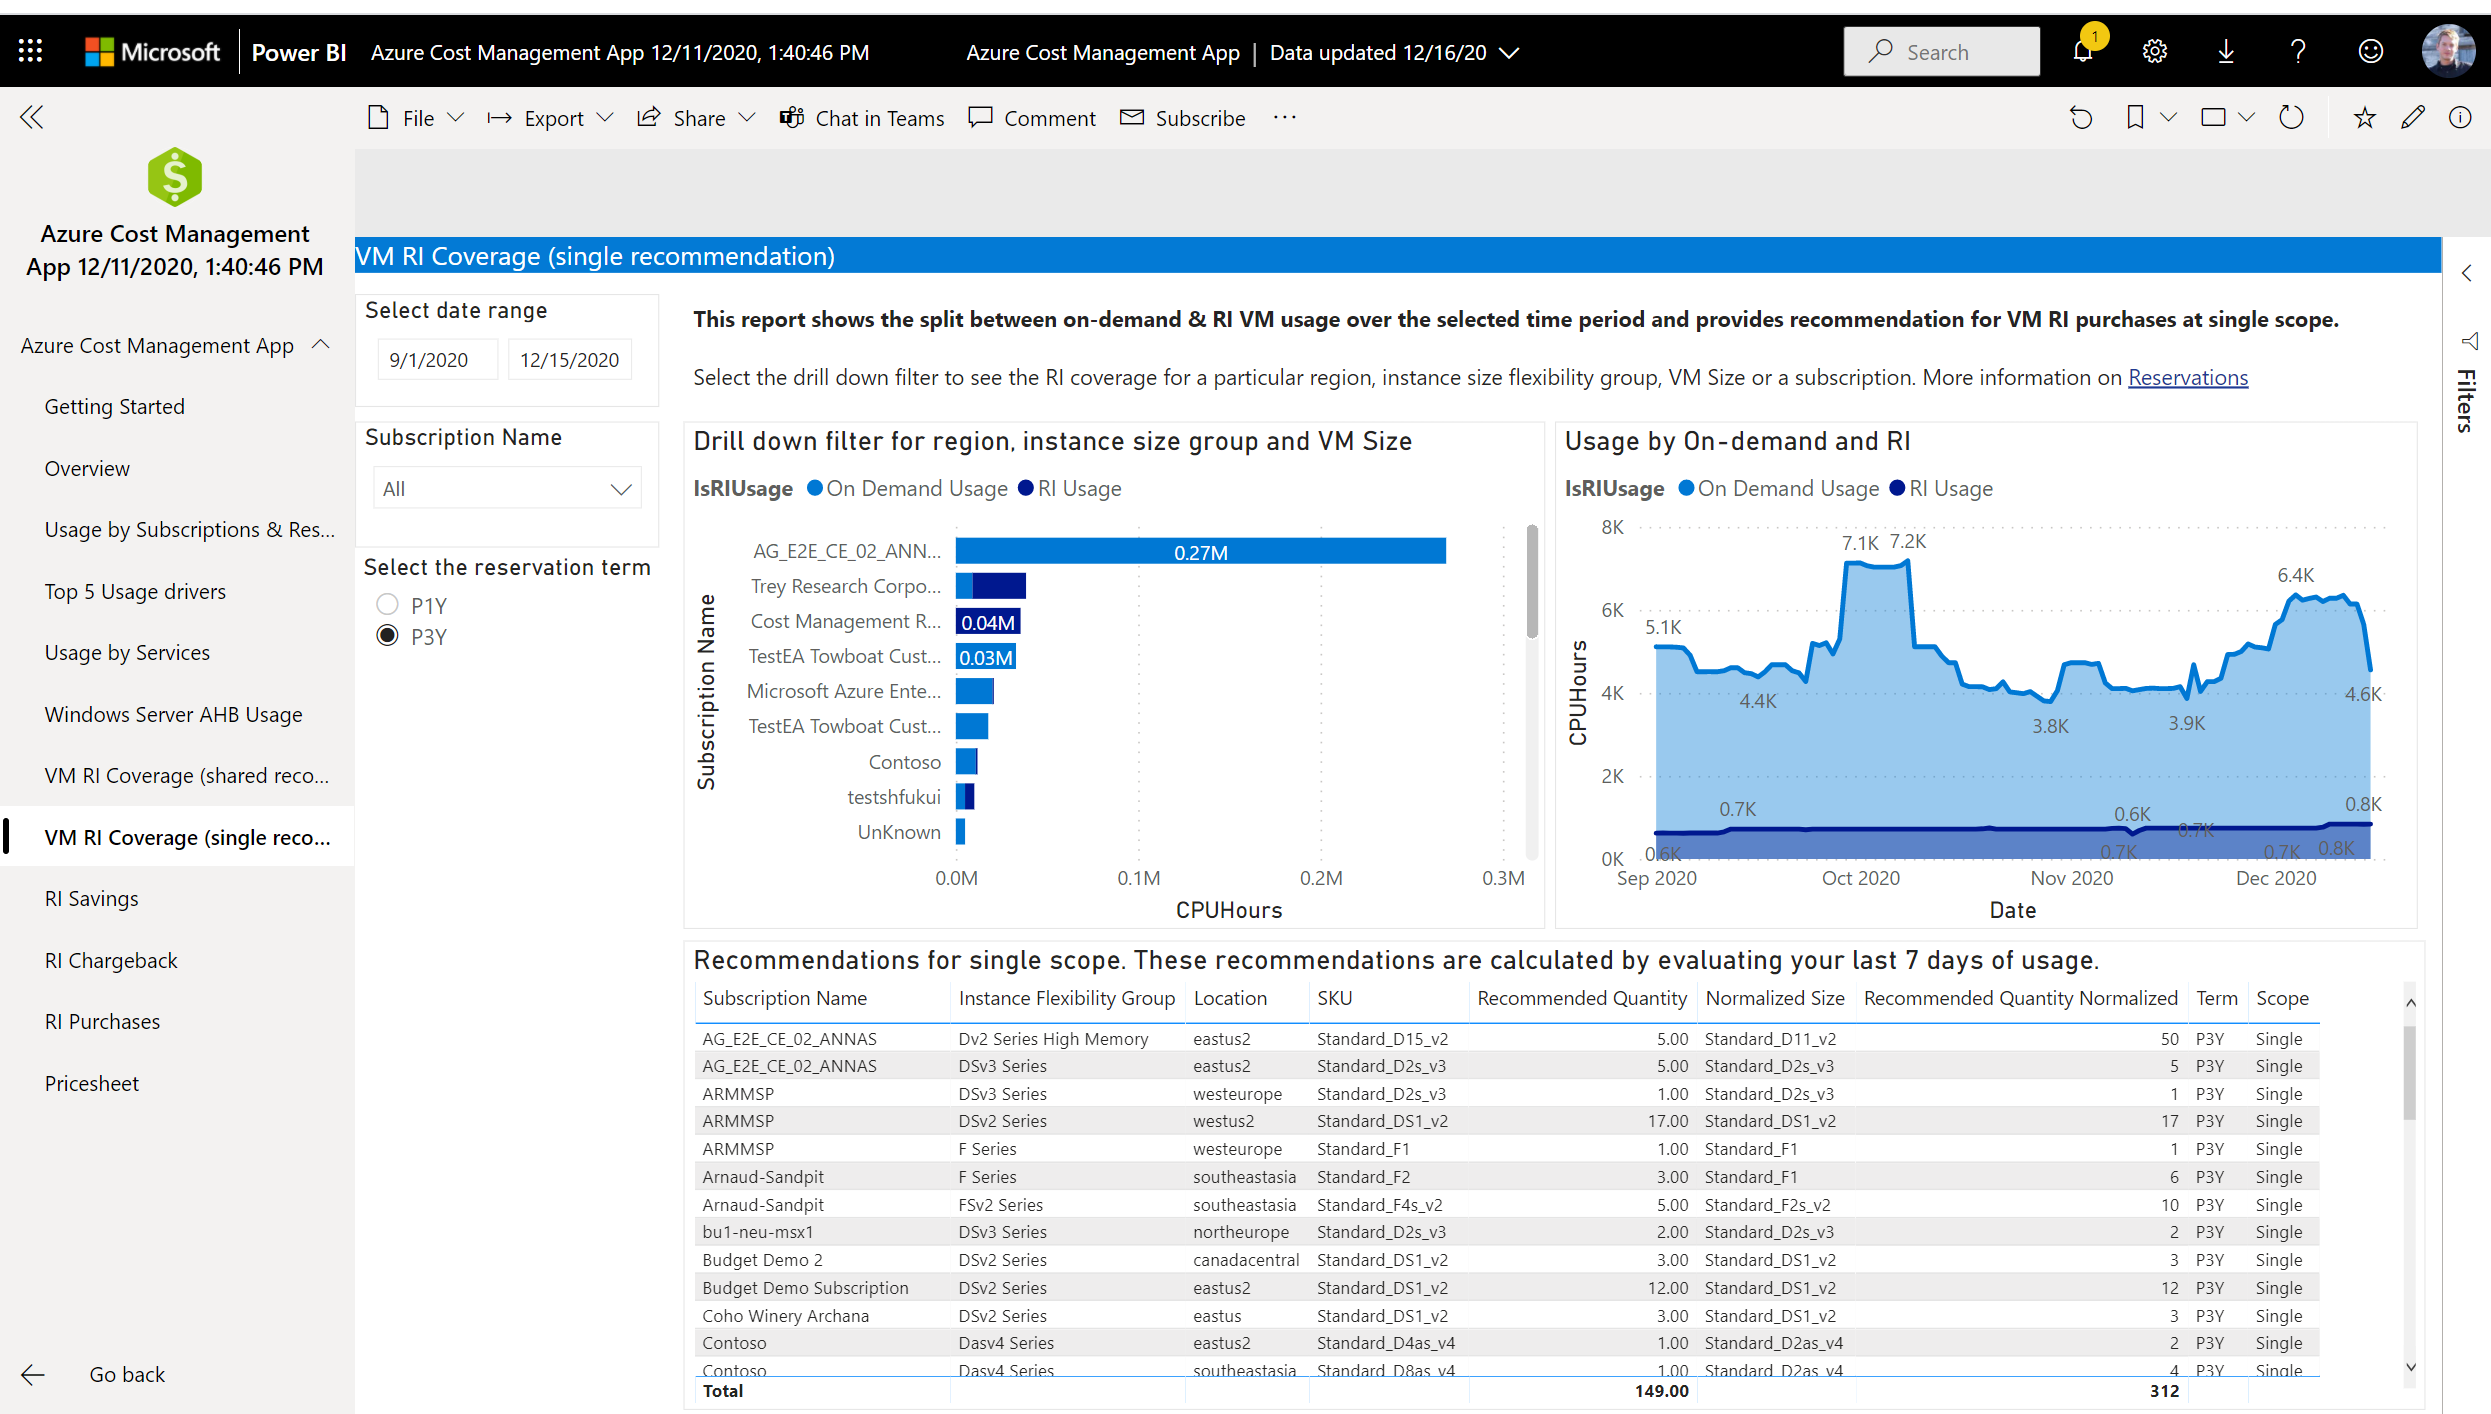
VM RI Coverage (single recommendation)
The report provides recommendations for VM RI purchases at a single subscription scope, even if you haven't made any reservation purchases. The report is split between on-demand VM usage and RI VM usage over the selected time period.
For details about how to use the report, see the previous VM RI Coverage (shared recommendation) section.
RI Savings
The Reservations Savings report shows the savings accrued by reservations for subscriptions, resource groups, and resources. It displays:
- Cost with reservation.
- Estimated on-demand cost if the reservation didn't apply to the usage.
- Cost savings accrued from the reservation.
The report subtracts any underutilized reservation waste cost from the total savings, because the waste wouldn't occur without a reservation. If you have negative savings, then you have underused reservations. Try to maximize the use of all underused reservations. Otherwise, the reservation savings are wasted. You should consider exchanging unused reservations.
You can use the amortized usage data to build on the data.
Pricing information in the following image is an example for informational purposes only.
RI Chargeback
The report helps you understand where and how much of a reserved instance (RI) benefit is applied per region, subscription, resource group, or resource. The report uses amortized usage data to show the view.
You can apply a filter on chargetype to view RI underutilization data only.
Pricing information in the following image is an example for informational purposes only.
For more information about amortized data, see Get Enterprise Agreement and Microsoft Customer Agreement reservation costs and usage.
RI Purchases
The Reservations Purchases report is a simple report that shows reservation purchases over the specified period that you select.
Pricing information in the following image is an example for informational purposes only.


