Create personalized visuals
In this unit, you explore the Create personalized visuals showcase. This showcase demonstrates how to use the authoring APIs to create personalized visuals.
In the Power BI Embedded Analytics Playground menu, select the Create personalized visuals showcase.
In the embedded Power BI report, in the lower right, select the Create quick visual button.
In the Create quick visual window, choose a visual type, set the fields, and then optionally format the visual, perhaps by including a specific title. When you've completed the setup, select Create.
The app has used the createVisual function to add a new visual with a default layout to the page.
Hover the cursor over the new visual, and then in the upper-right corner, select the ellipsis (...) to open the visual's context menu. (Your visual might differ from the one that's shown in the following image.)
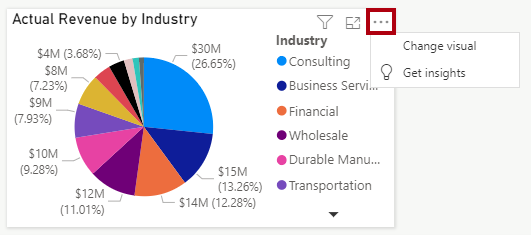
The app has used the updateSettings function to pass in new settings that define a command extension. For more information, see Modify menu commands for a report visual.
Select the Change visual command. In the Create quick visual window, set up a different visual and then select Create.
The app should have replaced the visual with the new setup.
For more information, see Quickly create personalized visuals showcase.