Personalize top insights
In this unit, you explore the Personalize top insights showcase. This showcase demonstrates how to use the authoring and layout APIs to allow users the ability to choose which visuals and layouts that they want to view.
In the Power BI Embedded Analytics Playground menu, select the Personalize top insights showcase.
In the embedded Power BI report, use the vertical scrollbar to scroll to the bottom of the report. The report page layout contains nine visuals.
In the upper-left corner of the page, select Choose visuals, and then in the checklist, clear one or two visuals.
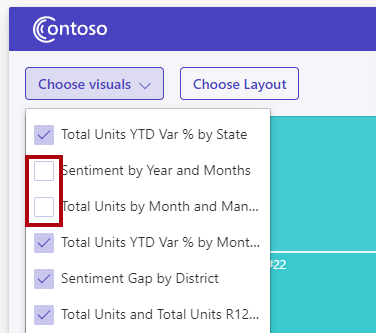
The cleared visuals no longer appear on the page. The app used the authoring APIs to set visual properties to hide or show a visual.
Next, select the Choose Layout button and then select the first layout option.
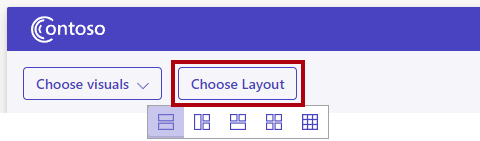
Notice how the report page layout has changed. Try the other layout options as well. The app used the updateSettings function to update a settings object with a modified customLayout property.
For more information, see Personalize top insights showcase.