Create and customize analytics rules in Microsoft Sentinel
After connecting your data sources to Microsoft Sentinel, create custom analytics rules to help discover threats and anomalous behaviors in your environment.
Analytics rules search for specific events or sets of events across your environment, alert you when certain event thresholds or conditions are reached, generate incidents for your SOC to triage and investigate, and respond to threats with automated tracking and remediation processes.
Create a custom analytics rule with a scheduled query
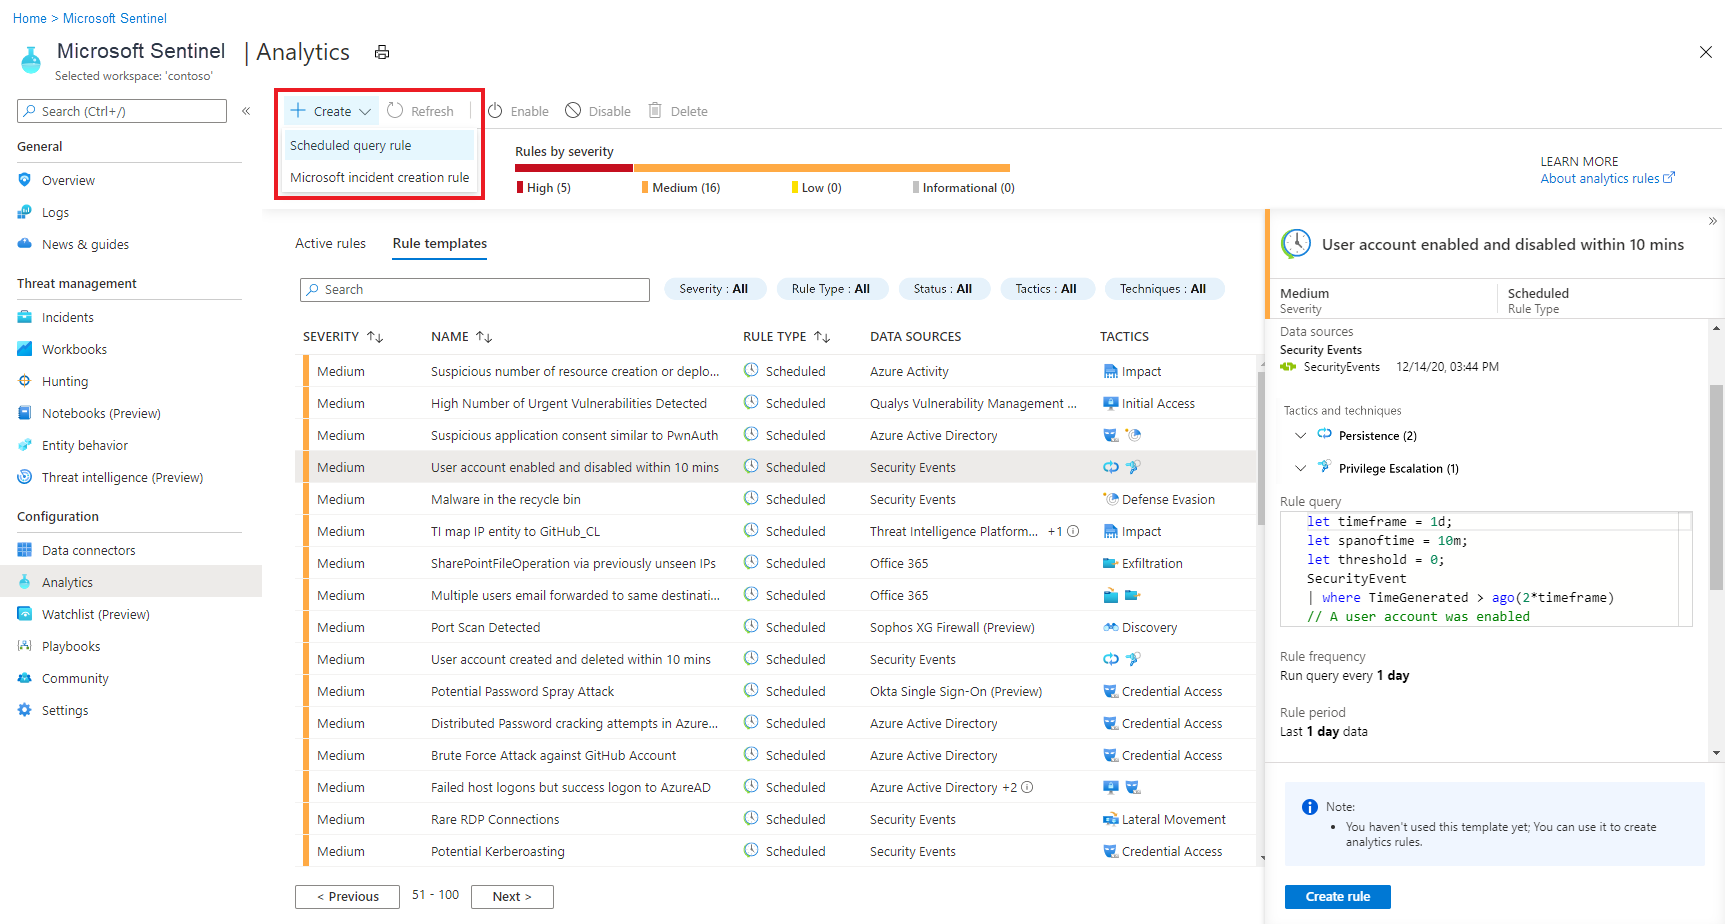
From the Microsoft Sentinel navigation menu, select Analytics.
In the action bar at the top, select + Create and select Scheduled query rule. This opens the Analytics rule wizard.
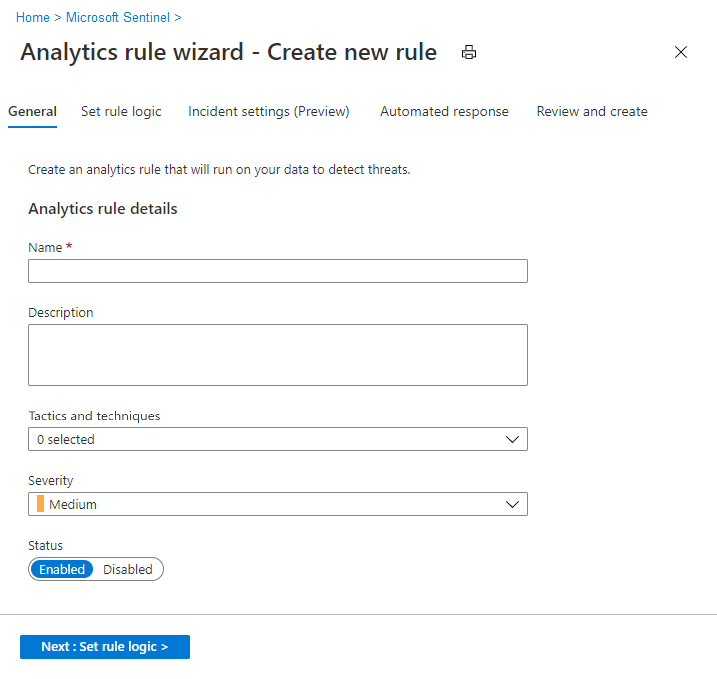
Analytics rule wizard - General tab
- Provide a unique Name and a Description.
- In the Tactics and techniques field, you can choose from among categories of attacks by which to classify the rule. These are based on the tactics and techniques of the MITRE ATT&CK framework.
- Incidents created from alerts that are detected by rules mapped to MITRE ATT&CK tactics and techniques automatically inherit the rule's mapping.
- Set the alert Severity as appropriate.
- Informational. No impact on your system, but the information might be indicative of future steps planned by a threat actor.
- Low. The immediate impact would be minimal. A threat actor would likely need to conduct multiple steps before achieving an impact on an environment.
- Medium. The threat actor could have some impact on the environment with this activity, but it would be limited in scope or require additional activity.
- High. The activity identified provides the threat actor with wide ranging access to conduct actions on the environment or is triggered by impact on the environment.
- Informational. No impact on your system, but the information might be indicative of future steps planned by a threat actor.
- Severity level defaults aren't a guarantee of current or environmental impact level. Customize alert details to customize the severity, tactics, and other properties of a given instance of an alert with the values of any relevant fields from a query output.
- Severity definitions for Microsoft Sentinel analytics rule templates are relevant only for alerts created by analytics rules. For alerts ingested from other services, the severity is defined by the source security service.
- When you create the rule, its Status is Enabled by default, which means it will run immediately after you finish creating it. If you don’t want it to run immediately, select Disabled, and the rule will be added to your Active rules tab and you can enable it from there when you need it.
Define the rule query logic and configure settings
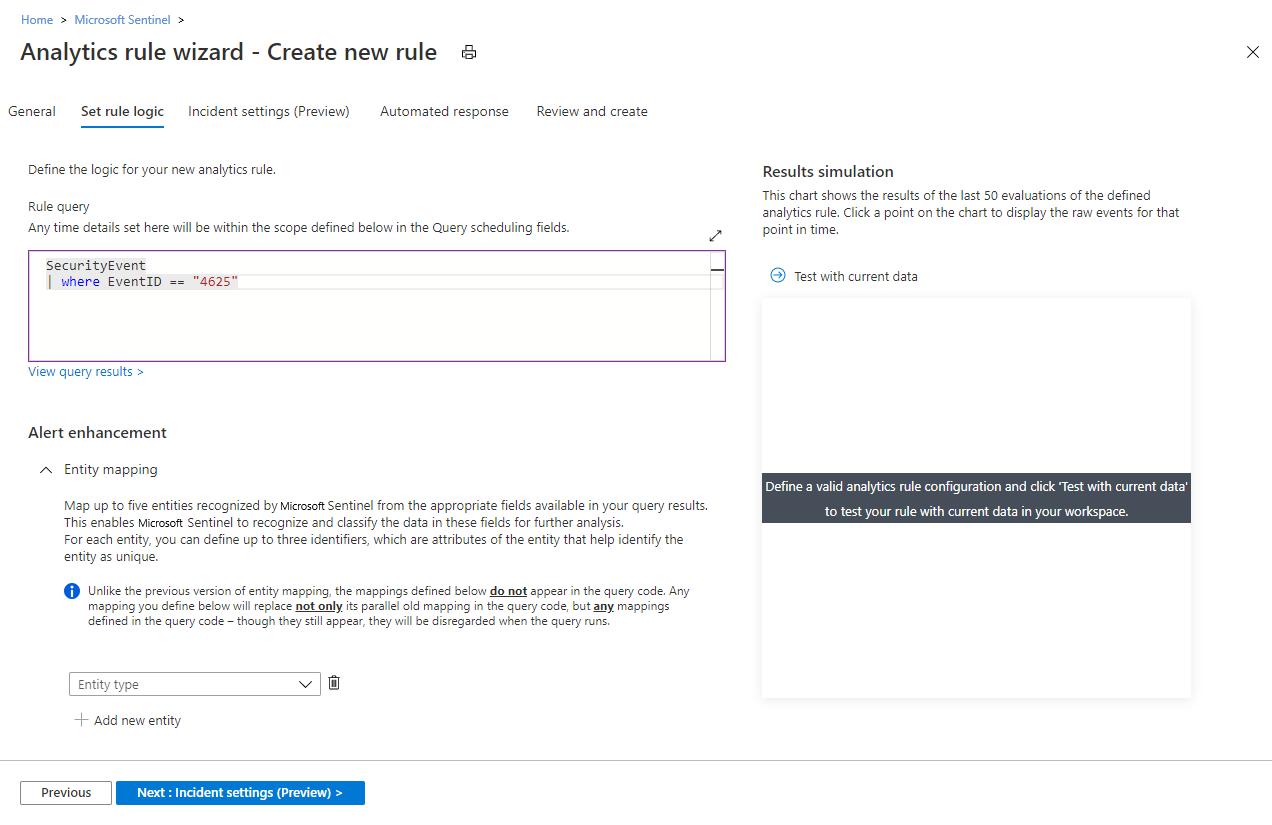
In the Set rule logic tab, you can either write a query directly in the Rule query field, or create the query in Log Analytics and then copy and paste it here.
- Queries are written in Kusto Query Language (KQL).
- The example shown in this screenshot queries the SecurityEvent table to display a type of failed Windows logon events.
Here's another sample query, one that would alert you when an anomalous number of resources is created in Azure Activity.
Kusto
AzureActivity
| where OperationNameValue == "MICROSOFT.COMPUTE/VIRTUALMACHINES/WRITE" or OperationNameValue == "MICROSOFT.RESOURCES/DEPLOYMENTS/WRITE"
| where ActivityStatusValue == "Succeeded"
| make-series dcount(ResourceId) default=0 on EventSubmissionTimestamp in range(ago(7d), now(), 1d) by Caller
Important
We recommend that your query uses an Advanced Security Information Model (ASIM) parser and not a native table. This will ensure that the query supports any current or future relevant data source rather than a single data source.
Rule query best practices:
- The query length should be between 1 and 10,000 characters and can't contain
search *orunion *. You can use user-defined functions to overcome the query length limitation. - Using ADX functions to create Azure Data Explorer queries inside the Log Analytics query window isn't supported.
- When using the
bag_unpackfunction in a query, if you project the columns as fields usingproject field1and the column doesn't exist, the query will fail. To guard against this happening, you must project the column as follows:
project field1 = column_ifexists("field1","")
Alert enrichment
- Use the Entity mapping configuration section to map parameters from your query results to Microsoft Sentinel-recognized entities. Entities enrich the rules' output (alerts and incidents) with essential information that serves as the building blocks of any investigative processes and remedial actions that follow. They're also the criteria by which you can group alerts together into incidents in the Incident settings tab.
- Use the Custom details configuration section to extract event data items from your query and surface them in the alerts produced by this rule, giving you immediate event content visibility in your alerts and incidents.
- Use the Alert details configuration section to override default values of the alert's properties with details from the underlying query results. Alert details allow you to display, for example, an attacker's IP address or account name in the title of the alert itself, so it will appear in your incidents queue, giving you a much richer and clearer picture of your threat landscape.
Note
The size limit for an entire alert is 64 KB.
- Alerts that grow larger than 64 KB will be truncated. As entities are identified, they're added to the alert one by one until the alert size reaches 64 KB, and any remaining entities are dropped from the alert.
- The other alert enrichments also contribute to the size of the alert.
- To reduce the size of your alert, use the
project-awayoperator in your query to remove any unnecessary fields. (Consider also theprojectoperator if there are only a few fields you need to keep.)
Query scheduling and alert threshold
- In the Query scheduling section, set the following parameters:
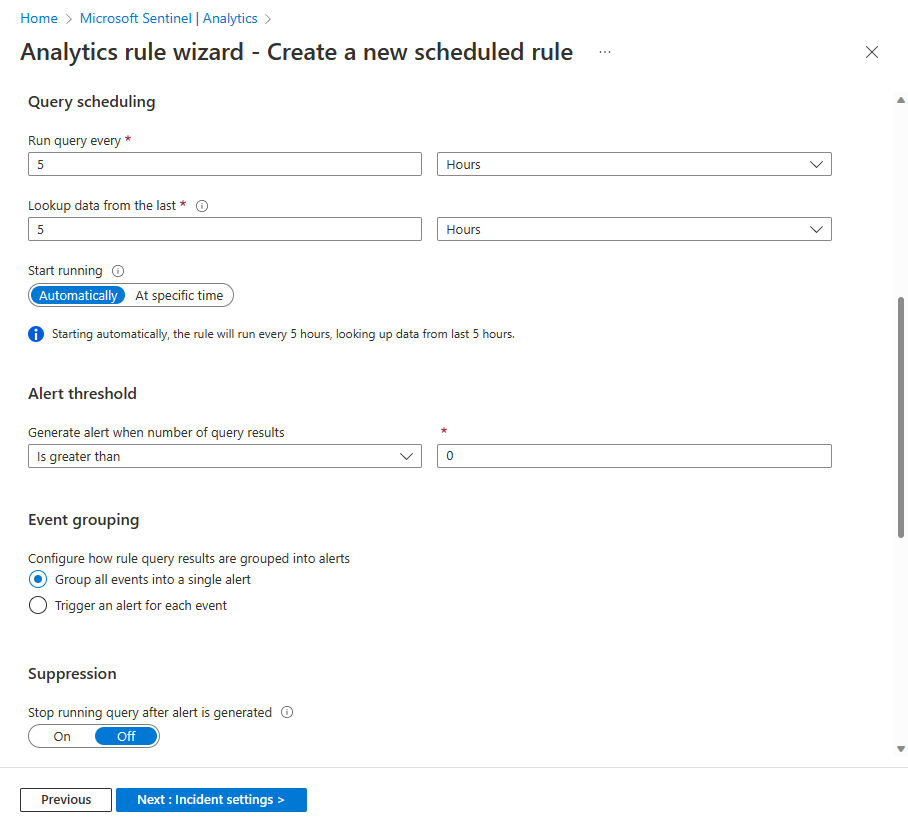
- Set Run query every to control how often the query is run—as frequently as every 5 minutes or as infrequently as once every 14 days.
- Set Lookup data from the last to determine the time period of the data covered by the query—for example, it can query the past 10 minutes of data, or the past 6 hours of data. The maximum is 14 days.
- For the new Start running setting (in Preview):
- Leave it set to Automatically continue the original behavior: the rule will run for the first time immediately upon being created, and after that at the interval set in the Run query every setting.
- Toggle the switch to At specific time if you want to determine when the
- rule first runs, instead of having it run immediately. Then choose the date using the calendar picker and enter the time in the format of the example shown.
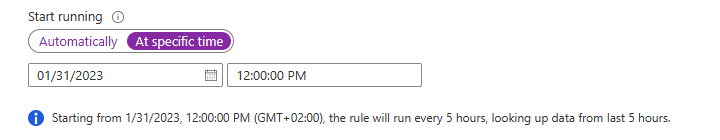
Future runnings of the rule will occur at the specified interval after the first running.
The line of text under the Start running setting (with the information icon at its left) summarizes the current query scheduling and lookback settings.
Query intervals and lookback period
These two settings are independent of each other, up to a point. You can run a query at a short interval covering a time period longer than the interval (in effect having overlapping queries), but you can't run a query at an interval that exceeds the coverage period, otherwise you'll have gaps in the overall query coverage.
Ingestion delay
To account for latency that may occur between an event's generation at the source and its ingestion into Microsoft Sentinel, and to ensure complete coverage without data duplication, Microsoft Sentinel runs scheduled analytics rules on a five-minute delay from their scheduled time.
Use the Alert threshold section to define the sensitivity level of the rule. For example, set Generate alert when number of query results to Is greater than and enter the number 1000 if you want the rule to generate an alert only if the query returns more than 1000 results each time it runs. This is a required field, so if you don’t want to set a threshold – that is, if you want your alert to register every event – enter 0 in the number field.
Configure the incident creation settings
In the Incident Settings tab, you can choose whether and how Microsoft Sentinel turns alerts into actionable incidents. If this tab is left alone, Microsoft Sentinel will create a single, separate incident from each and every alert. You can choose to have no incidents created, or to group several alerts into a single incident, by changing the settings in this tab.
Incident settings
In the Incident settings section, Create incidents from alerts triggered by this analytics rule is set by default to Enabled, meaning that Microsoft Sentinel will create a single, separate incident from each and every alert triggered by the rule.
- If you don’t want this rule to result in the creation of any incidents (for example, if this rule is just to collect information for subsequent analysis), set this to Disabled.
- If you want a single incident to be created from a group of alerts, instead of one for every single alert, see the next section.
Alert grouping
In the Alert grouping section, if you want a single incident to be generated from a group of up to 150 similar or recurring alerts (see note), set Group related alerts, triggered by this analytics rule, into incidents to Enabled, and set the following parameters.
- Limit the group to alerts created within the selected time frame: Determine the time frame within which the similar or recurring alerts will be grouped together. All of the corresponding alerts within this time frame will collectively generate an incident or a set of incidents (depending on the grouping settings below). Alerts outside this time frame will generate a separate incident or set of incidents.
- Group alerts triggered by this analytics rule into a single incident by: Choose the basis on which alerts will be grouped together:
| Option | Description |
|---|---|
| Group alerts into a single incident if all the entities match | Alerts are grouped together if they share identical values for each of the mapped entities (defined in the Set rule logic tab above). This is the recommended setting. |
| Group all alerts triggered by this rule into a single incident | All the alerts generated by this rule are grouped together even if they share no identical values. |
| Group alerts into a single incident if the selected entities and details match | Alerts are grouped together if they share identical values for all of the mapped entities, alert details, and custom details selected from the respective drop-down lists. You might want to use this setting if, for example, you want to create separate incidents based on the source or target IP addresses, or if you want to group alerts that match a specific entity and severity. Note: When you select this option, you must have at least one entity type or field selected for the rule. Otherwise, the rule validation will fail and the rule won't be created. |
- Re-open closed matching incidents: If an incident has been resolved and closed, and later on another alert is generated that should belong to that incident, set this setting to Enabled if you want the closed incident re-opened, and leave as Disabled if you want the alert to create a new incident.
Note
Up to 150 alerts can be grouped into a single incident.
- The incident will only be created after all the alerts have been generated. All of the alerts will be added to the incident immediately upon its creation.
- If more than 150 alerts are generated by a rule that groups them into a single incident, a new incident will be generated with the same incident details as the original, and the excess alerts will be grouped into the new incident.
Set automated responses and create the rule
In the Automated responses tab, you can use automation rules to set automated responses to occur at any of three types of occasions:
- When an alert is generated by this analytics rule.
- When an incident is created with alerts generated by this analytics rule.
- When an incident is updated with alerts generated by this analytics rule.
The grid displayed under Automation rules shows the automation rules that already apply to this analytics rule (by virtue of it meeting the conditions defined in those rules). You can edit any of these by selecting the ellipsis at the end of each row. Or, you can create a new automation rule.
Use automation rules to perform basic triage, assignment, workflow, and closing of incidents.
Automate more complex tasks and invoke responses from remote systems to remediate threats by calling playbooks from these automation rules. You can do this for incidents as well as for individual alerts.
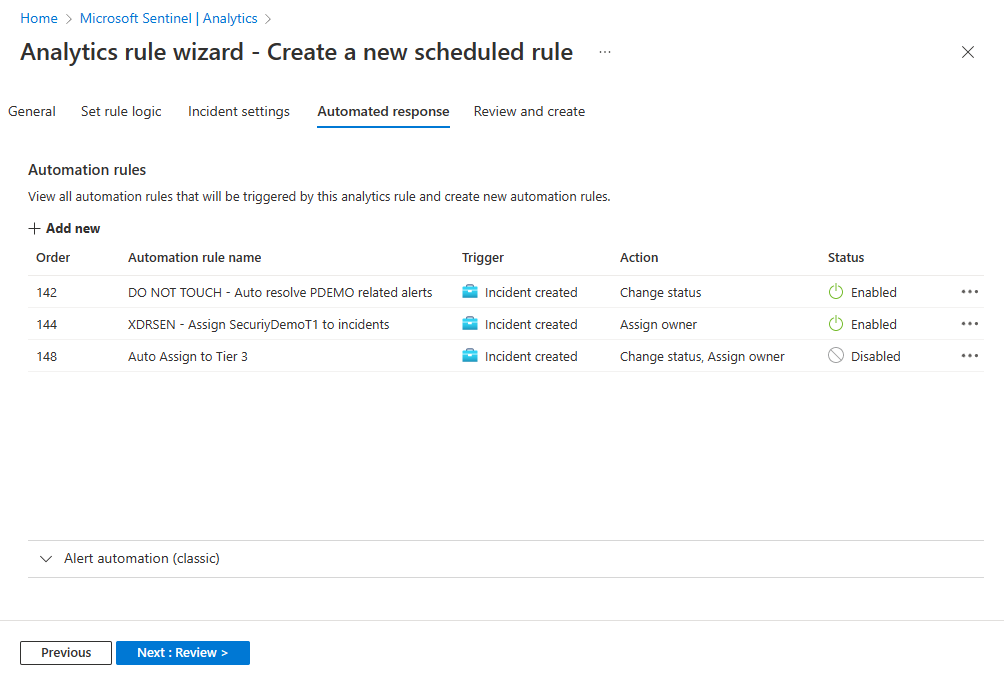
- Under Alert automation (classic) at the bottom of the screen, you'll see any playbooks you've configured to run automatically when an alert is generated using the old method.
- As of June 2023, you can no longer add playbooks to this list. Playbooks already listed here will continue to run until this method is deprecated, effective March 2026.
- If you still have any playbooks listed here, you should instead create an automation rule based on the alert created trigger and invoke the playbook from there. After you've done that, select the ellipsis at the end of the line of the playbook listed here, and select Remove.
Select Review and create to review all the settings for your new analytics rule. When the "Validation passed" message appears, select Create.
View the rule and its output
- You can find your newly created custom rule (of type "Scheduled") in the table under the Active rules tab on the main Analytics screen. From this list you can enable, disable, or delete each rule.
- To view the results of the analytics rules you create, go to the Incidents page, where you can triage incidents, investigate them, and remediate the threats.
- You can update the rule query to exclude false positives.