Overview of Azure Workbooks
Workbooks provide a flexible canvas for free-form data exploration. Azure Workbooks combine text, log queries, metrics, and parameters, and include multiple kinds of visualizations and analyses. Use Workbooks to extract data from multiple data sources and combine them into an individualized report. You can share Workbooks with your team in the Azure portal, to interactively gather and share information.
Workbooks are helpful to analyze things like:
- Virtual machine usage. You can discover metrics for CPU utilization, disk space, memory, and network dependencies.
- Performance of a recently provisioned VM. You can display metrics for key counters and other log events to other team members.
- Results of a resizing experiment of your VM. You can show each usage metric and the analytics queries used to evaluate the experiment, and clearly call-out if a metric isn't within the target range.
- The effect of an outage on the usage of a resource.
Data Sources
Workbooks can query data from multiple sources. You can combine the data from multiple data sources within a single report, and transform the data to give you visual insights into the availability, performance, usage, and overall health of your resources.
Visualizations
Workbooks provide a rich set of visualizations you can use to customize reports, including:
- Text parameters
- Charts
- Grids
- Tiles
- Trees
- Honeycombs
- Graphs
- Maps
- Text visualizations
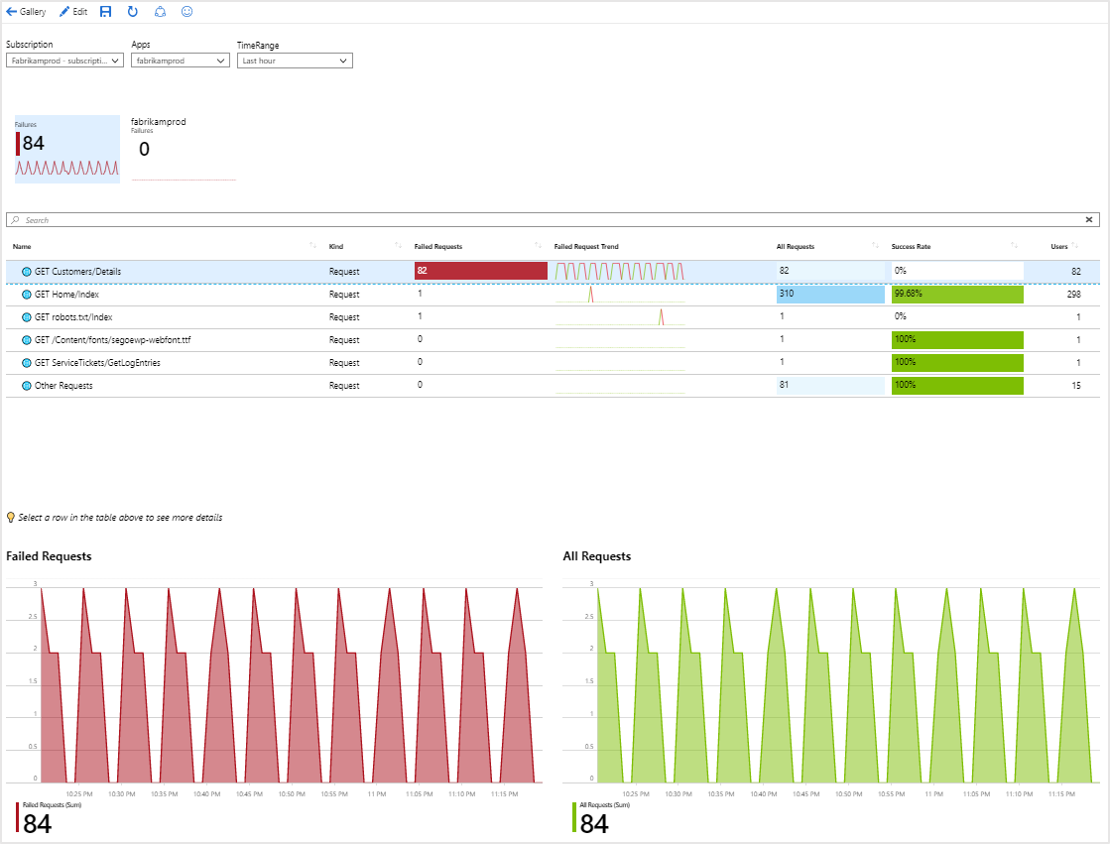
This is an example of a report that combines data from multiple sources and uses visualizations that help analyze data.